China Stocks May Be On to Something
China's stock market exploded last week in an amazing rally, so formidable that it raises the question of whether it could be the start of a new bull market, or just a short-covering rally which will quickly fizzle out. In that respect, it's important to note that classic bear market lows for stocks occur when several factors are present, including:
- A price that has been declining for 1-2-years, as the market discounts a weakening economy.
- Widespread pessimism amongst investors.
- A robust and broad advance off the lows, ideally on heavy volume, as a reaction to some game-changing development. That could be a fresh injection of liquidity to avoid a financial crisis.
- A general disbelief or confusion as to whether the advance is genuine or not.
- An initial advance off the lows eventually resulting in some confirmatory primary trend signals, such as a 12-month MA crossover, or long-term smoothed momentum, such as the KST turning up.
Last week's rally in the Shanghai Composite qualifies on all fronts, so it's in light of several of these factors that we can better gauge whether this will turn out to be a trick-or-treat rally.
Chart 1 features one of my favorite indicators, a monthly PPO incorporating the 6 and 15 parameters. When above zero, it is in a bullish mode and earns a green highlight. Note there have been very few whipsaw signals in the last 25 years. Last month saw the oscillator almost cross zero with a reading of -.055%. Unless the Index drops precipitously next month, it is almost certain to go bullish.

Chart 2 agrees, as the Index has crossed above its 12- and 24-month MAs as well as decisively violating a 2-year down trendline. Furthermore, the 9-month ROC has violated a down trendline of its own in a similar manner to the 2006 and 2014 setups between the Index and its ROC.
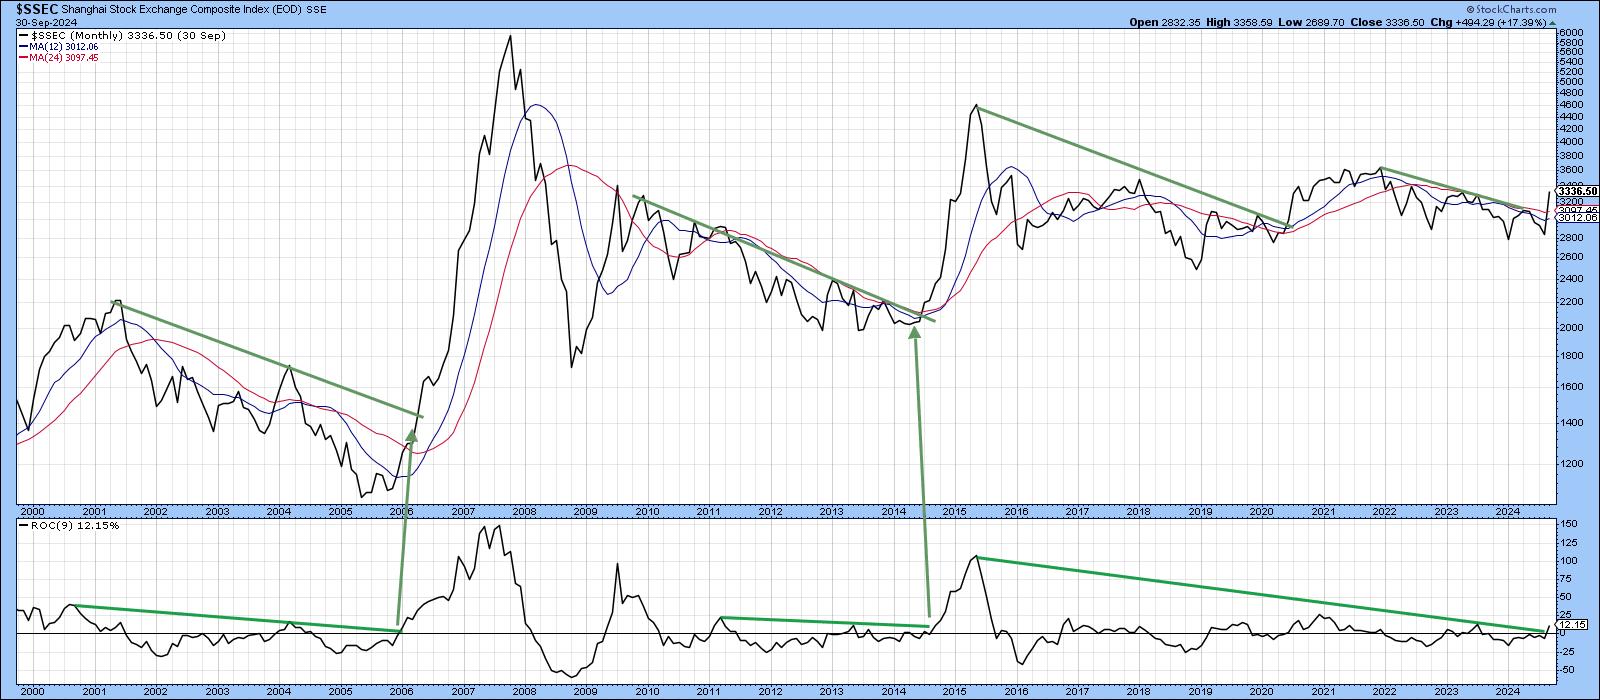
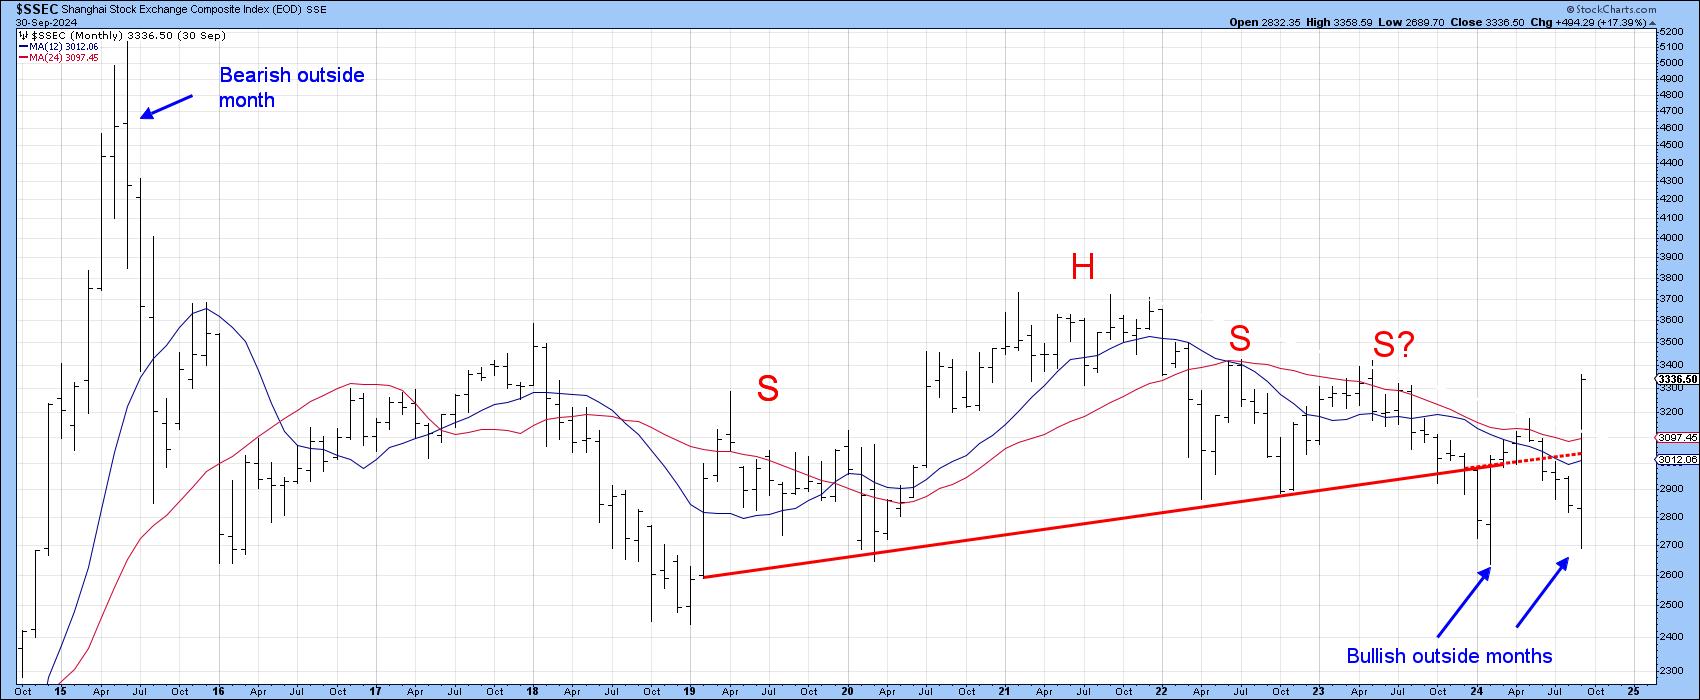
Chart 3 offers further indications a major reversal is underway. This monthly bar chart shows the early 2024 false breakdown and another earlier this year. Now, the Index has rallied back above the extended breakdown trendline as well as its 2022-24 down trendline. There could always be a third breakdown, of course, but that seems unlikely because of September's giant outside month. Outside bars are only expected to have an effect for between 5-10-periods, in this case months. However, they can have far greater significance as indicated by the bearish bar that formed in 2015. Do not forget failed patterns such as this head-and-shoulders are often followed by above-average moves, as traders scramble to get back to the right side of the market. Any way you look at it, an important low was established last month.
Two indications of a huge change in sentiment are provided in Charts 4 and 5. Chart 4 shows that last Friday's advance was accompanied by record volume. If record volume appears after an advance, we have to be careful, because it could represent an exhaustion move. However, when it comes off a major low, it's usually a bullish game-changer. The 1978, 1982, and 1984 lows in the US market were all followed by record volume. Over the years, I have noticed that the Chinese market is particularly sensitive to volume swings, so this is a very important development.
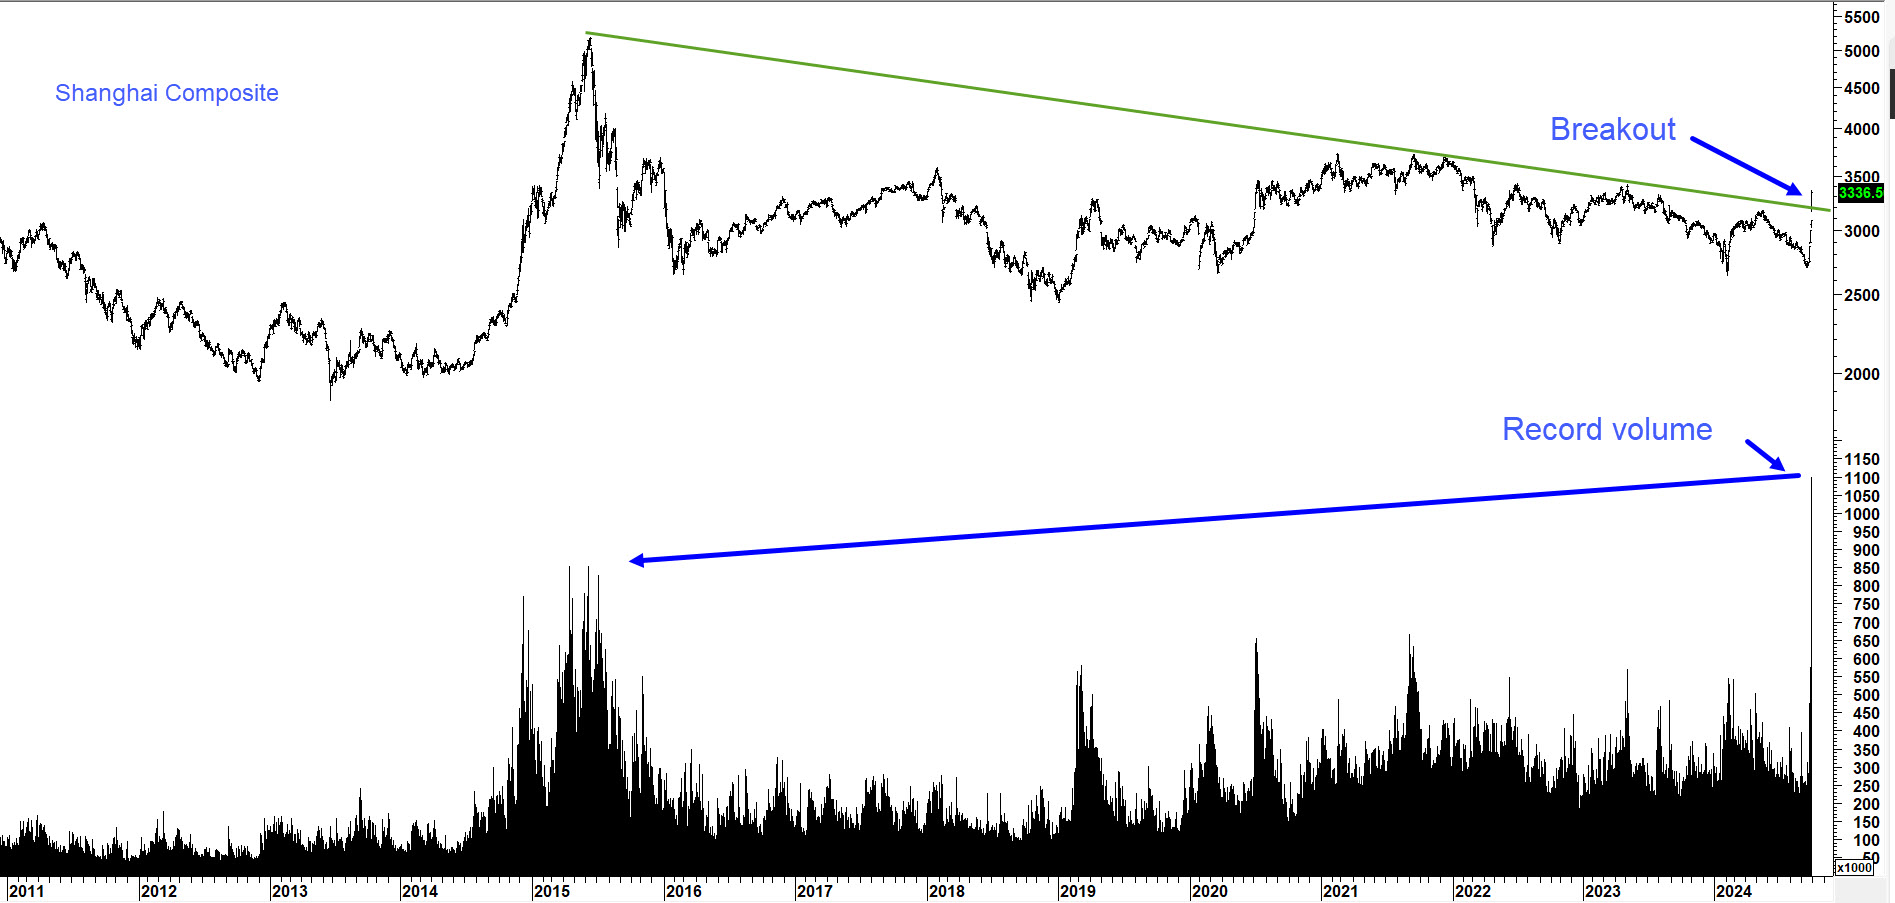
Chart 5 shows us another bull market characteristic, which is 25-year record reading in the 10-day ROC for the Shanghai Composite. It's what I call a "mega overbought". Like a breadth thrust, this price thrust represents an early bird sign of a bull market. In Technical Analysis Explained, I refer to this condition as "a reading in the momentum indicator (usually an ROC) that takes it beyond the normal overbought condition witnessed in either a preceding bull or bear market. It should, for example represent a multi-year high...perhaps a record overbought reading. Such conditions are usually the sign of a young and vibrant bull market." Chart 5 offers a textbook example.
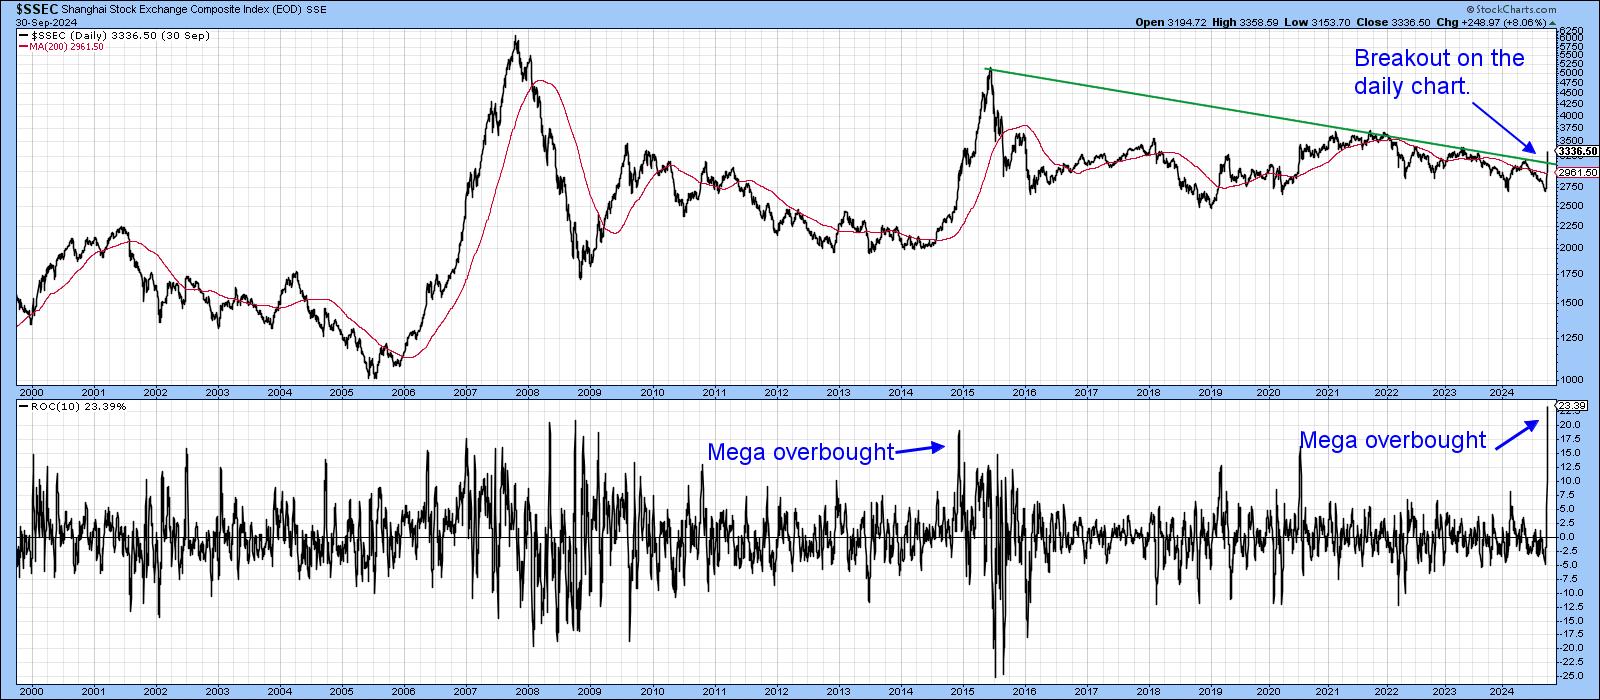
Another indication of upside momentum comes from the 2015-2024 down trendline violation. We have to be a bit careful on that one, because a breakout has not occurred when monthly data is plotted.
What's the Potential
The next thing to note is that the long-term KST is already bullish, but not decisively so. The indicator is certainly positioned to support a nice primary trend rally. It's important to note the arrows in Chart 6 do not represent a forecast. Using price objective techniques, they merely point out that, if things fall into line, the Chinese market is positioned to support substantially higher prices.
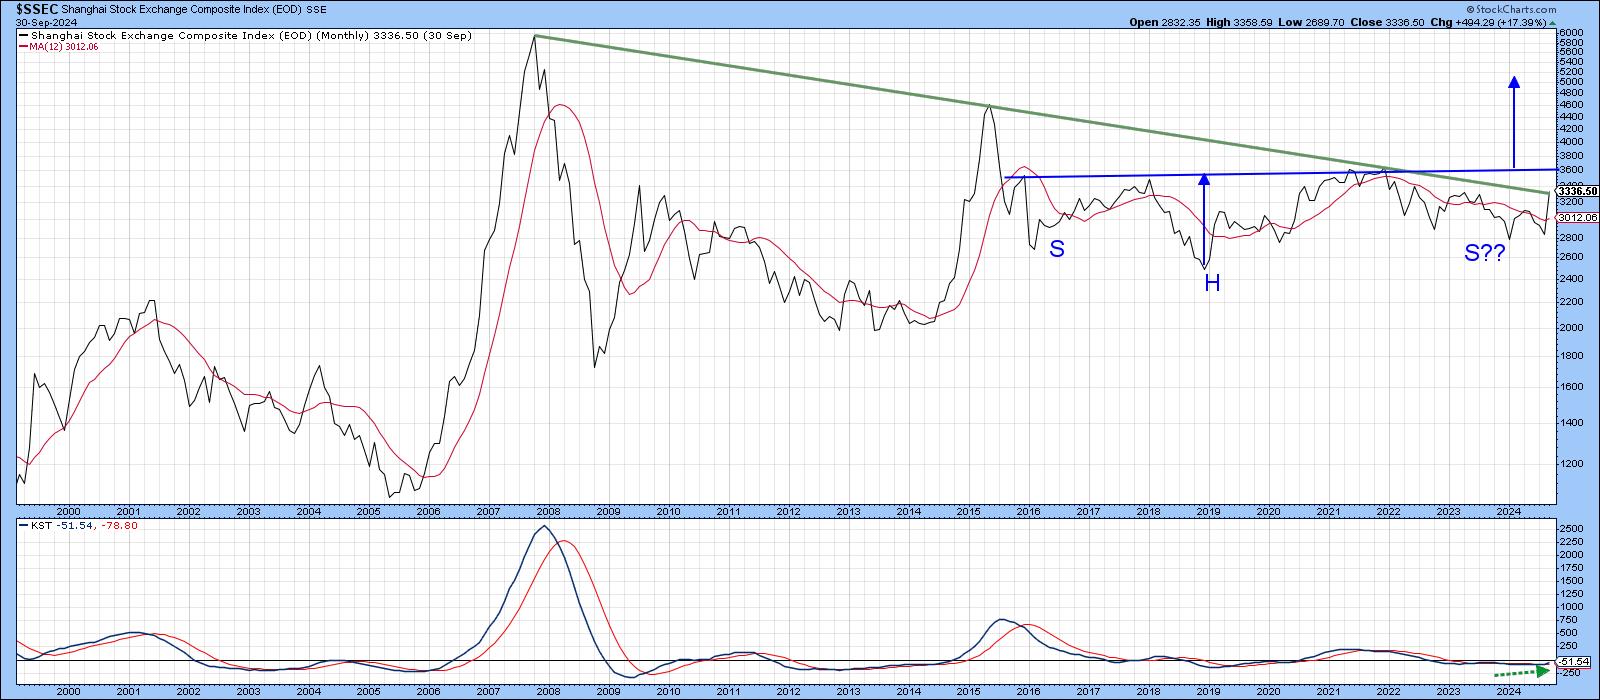
In the meantime, the market is obviously very overstretched, so those entering right now would likely have to stomach a really sharp correction. Waiting for some form of a retracement move or a quiet entry point is more advisable. Missing out is also an option, and, as a good friend of mine used to say, " Don't forget, there will always another train leaving the station!"
Good luck and good charting,
Martin J. Pring
The views expressed in this article are those of the author and do not necessarily reflect the position or opinion of Pring Turner Capital Groupof Walnut Creek or its affiliates.


