The Trump Trade? Not All as MAGA as You Might Think
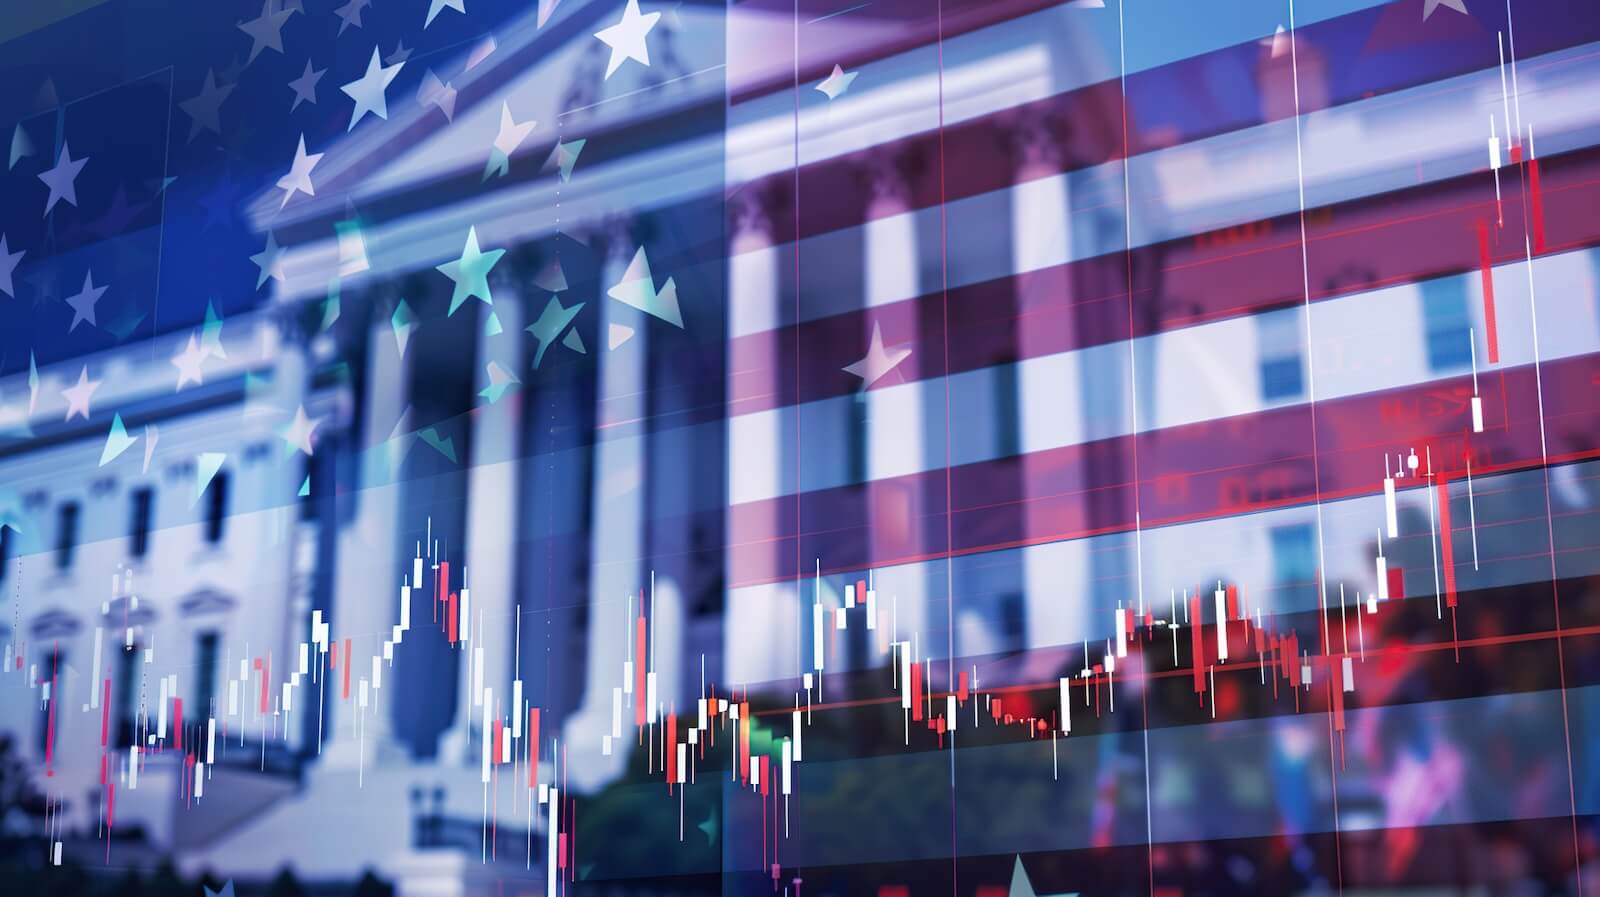
The "Trump Trade" refers to the market reaction and investment strategies that emerged following Donald Trump's election victories and his economic policies. It describes the shift in market sentiment driven by anticipated pro-business policies, tax cuts, and deregulation under his administration.
Investors initially rushed into sectors like Financials and Energy. They also rushed into small caps, anticipating that these areas would benefit the most from Trump's anticipated policies. Some of the biggest beneficiaries of the Trump Trade, though, are companies tied to Trump, his family, or his close associates, giving us mere mortals the fear of missing out. We'll look at some of those a little later on.
S&P Rallies Straight Out of the Gate
Most noteworthy was the sharp upside gap in the S&P 500 ($SPX) on November 6. It looked unstoppable at the time. However, it has now followed the technical rule that the vast majority of gaps are filled or experience a good-faith attempt at being filled. In this case, we are at the "good" faith stage. The upper and lower parts of a gap represent potential support and resistance points, so a small year-end rally seems likely at this point.

CHART 1. UPSIDE GAP ATTEMPTS TO GET FILLED. In the daily chart of the S&P 500 index, the November 6 upside gap is attempting to get filled with the upper and lower parts of the gap representing support and resistance levels.
Chart source: StockCharts.com. For educational purposes.
Strong Sectors Not So Strong
Chart 2 features three sectors/asset classes that came out strongly from the starting gate—Financials, Energy, and small caps. Financials are still slightly ahead of the game, but Energy and small caps are starting to show losses.

CHART 2. FINANCIALS, ENERGY, AND SMALL CAPS. All three sectors gave up their gains after the election rally.
Chart source: StockCharts.com. For educational purposes.
Bitcoin
Trump's endorsement and support for crypto has also led to gains in that sector. In that respect, Chart 3 features Bitcoin and Coinbase Global, Inc. (COIN). Both jumped sharply on the election news, experienced trading ranges, and have now broken down from them. This suggests that a test of the post-election gap in Coinbase's stock price could be in the cards.

CHART 3. BITCOIN AND COINBASE. Both rose on the election news, went through a trading range, and have now broken down from them. Will the post-election gap get tested?
Chart source: StockCharts.com. For educational purposes.
Trump Family and Associate Beneficiaries
Trump Media & Technology Group Corp. (DJT), with its interest in Truth Social, should be an obvious beneficiary with Trump's ability to cash in on expanding traffic in "Truths" as President. Chart 4 doesn't reveal much, since a lot of this good news had already been factored into the price, which has barely budged since the election.
For his associate Elon Musk, the election has resulted in a different outcome as the price gains for Tesla, Inc. (TSLA) have been nothing short of spectacular. A recent breakout from a three-year inverse head and shoulders and a long-term Know Sure Thing (KST) buy signal (not shown) didn't hurt either.

CHART 4. DJT STOCK PRICE AND TESLA, INC. Both stocks could benefit from Trump 2.0.
Chart source: StockCharts.com. For educational purposes.
And the Winner Is ...
The most positive market reaction to the election, not in terms of percentage move but rather in its influence on global markets, has come from the US Dollar Index ($USD). It is the winner when you think about the ultimate MAGA financial market instrument.

CHART 5. DAILY CHART OF THE US DOLLAR INDEX. The US dollar has been in a sharp upward trend since the US Presidential election.
Chart source: StockCharts.com. For educational purposes.
What is particularly noteworthy from a long-term technical aspect is that the US Dollar Index has broken out from a large base, which has been tentatively confirmed by a rising long-term KST in the lower window of Chart 6. I use the word "tentatively" because this chart is based on month-end closes, and several sessions have yet to populate for December. If it holds, though, it will rate it as a pretty big global financial market deal.

CHART 6. MONTHLY CHART OF THE US DOLLAR INDEX. The US Dollar Index has broken out of a basing pattern. If the long-term KST rises when the month ends, it will confirm the rise in the dollar.
Chart source: StockCharts.com. For educational purposes.
Prices North of the Border Head South
The Canadian Dollar Index ($XDC) in Chart 7 suffered severely as a reaction to the general strength of its US counterpart, tariff fears, and political uncertainty. After a brief run-up, the iShares MSCI Canada ETF (EWC) has been dragged down by the currency and is now sporting a post-election loss.

CHART 7. OH, CANADA! The Canadian dollar and EWC are falling post-US election. In addition to the strength of the US economy and tariff fears, Canada is facing internal political uncertainty, all of which is dragging $XDC and EWC lower.
Chart source: StockCharts.com. For educational purposes.
Good luck and good charting,
Martin J. Pring
The views expressed in this article are those of the author and do not necessarily reflect the position or opinion of Pring Turner Capital Groupof Walnut Creek or its affiliates.


