Stocks May No Longer Be the Preferred Asset Class
A couple of weeks ago, I wrote that stocks were beginning to slip against the gold price. Chart 1 shows that the ratio has now decisively broken below an important uptrend line, marking the lower region of a three-year top. The short-term KST is currently oversold, so some kind of a bounce is likely. However, the break is now sufficiently decisive to conclude beyond a reasonable doubt that it is genuine.
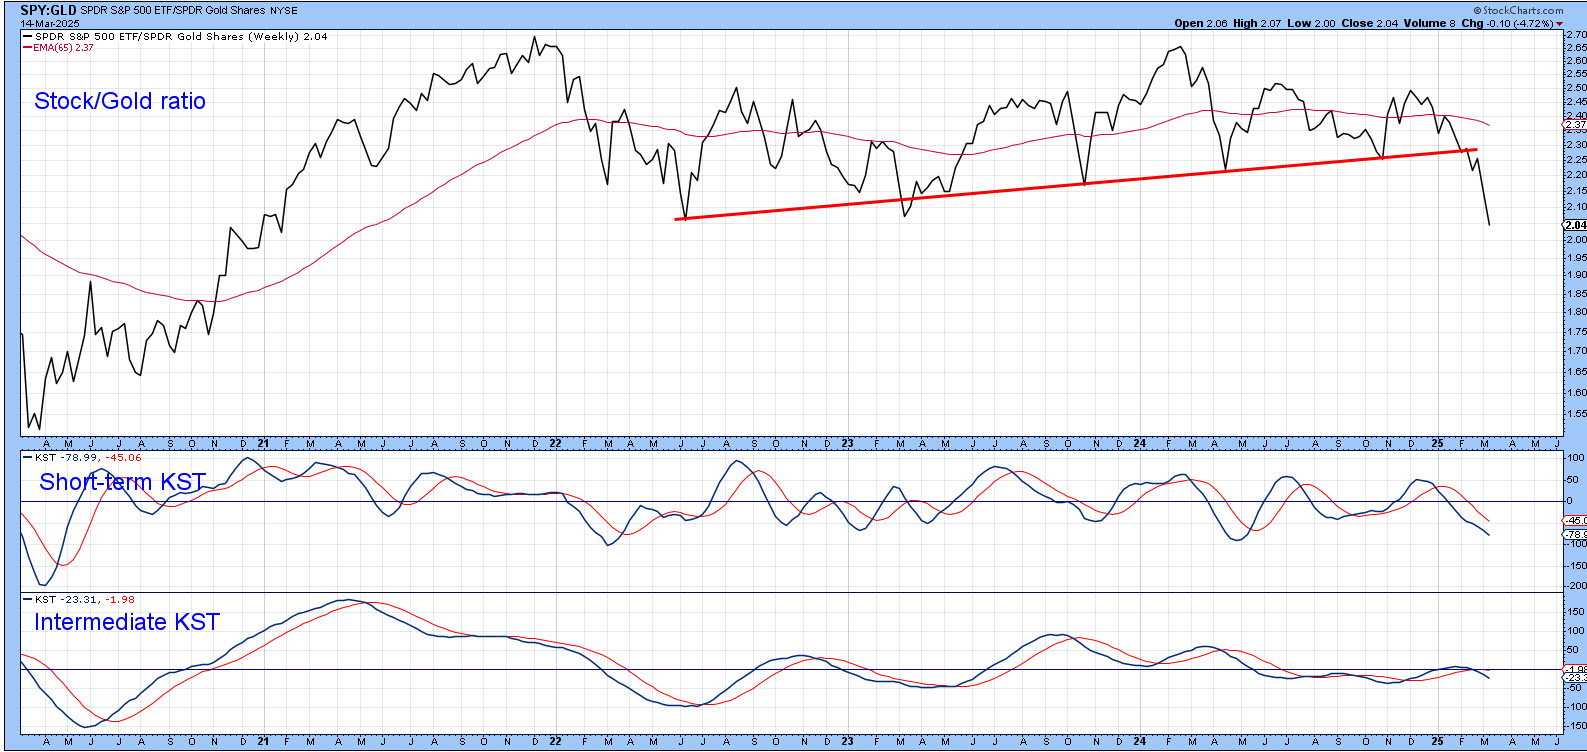
Chart 2 compares the S&P to the long-term KST for the ratio and indicates the implications of the break. The vertical lines approximate peaks in the long-term KST for the ratio. The solid ones identify examples of where a declining KST was followed by a bear market or trading range of some kind. The dashed ones tell us when there was no adverse effect on the stock market. The recent KST peak is therefore more of a negative than positive factor.

The Stock Commodity Relationship
Gold leads commodities and is therefore on a different cycle. However, stocks have now begun to break down against this asset class as well. Chart 3 compares the S&P composite to a KST calculated from the ratio between stocks ($SPX) and the CRB Composite ($CRB). This relationship tends to peak out towards the more mature phases of the business cycle, when commodities are running and a sector change favoring earnings driven stocks over defensive ones is taking place.

Chart 3 suggests the reversal is tentative. However, if we drill down to the daily charts, it is evident that a more serious break has taken place. That's because the ratio has violated its 2022-2025 bull market trendline. It has also completed a one-year head-and-shoulders top. It's true the Special Khas held above its bull market trendline, but, by the same token, it has dropped below its signal line, which the small green and red arrows indicate has been a reliable indication of trend reversals in the last five years.

This action should be regarded as negative for the market in general. However, it is usually positive for some sectors. These are generally resource-based and basic industry stocks. That said, it is mandatory to trust and verify. In other words, the environment may be favorable for such issues, but you want to make sure that they are acting well technically as confirmation they are responding favorably to it.
The Stock/Bond Ratio
Another relationship that is under pressure is the Stock/Bond relationship. It is featured in Chart 5, where the $SPX is compared to the 30-Year Bond ($USB). The arrows approximate KST peaks, events that were generally followed by weakness in the ratio. This softness tells us nothing about the absolute performance bonds and stocks, merely that bonds had begun a period of underperformance against equities.

To observe the performance of stocks in their own right, we need to go to Chart 7. Before we do, it is evident from Chart 5 that the KST has tentatively begun to roll over, but ratio is right at its 12-month MA.
Chart 6 also underlines the fact that this relationship has reached a make-or-break position, as it is anemically below its 200-day MA and the Special K is resting on a key trendline. Since 2021, this momentum indicator has been caught in a trading range, where signal line crossovers have been misleading. We have to turn to the trendline for guidance.

Finally, Chart 7 builds on Chart 5 by including the S&P Composite. The two sets of arrows connect peaks in the ratio's KST and the these events to the S&P itself. The slanting of most of them to the right indicates that the tops in the S&P generally lag KST sell signals for the ratio. In other words, weakness in the ratio is generally negative for stocks, but not usually right away and, in the 2005 case, not at all. The good news is that while the ratio may look toppy, it has not yet triggered a decisive sell signal.

Good luck and good charting,
Martin J. Pring
The views expressed in this article are those of the author and do not necessarily reflect the position or opinion of Pring Turner Capital Groupof Walnut Creek or its affiliates.


