Mapping the Road Ahead: Four Scenarios for the Nasdaq 100

While August and September are traditionally a very weak period for the stock market, the Nasdaq 100 has continued to drive ever higher. Were the pullbacks in late July and mid-August a brief pause within an uptrend that will just keep going higher? Or were those clear warning signs of a much deeper corrective move just around the corner?
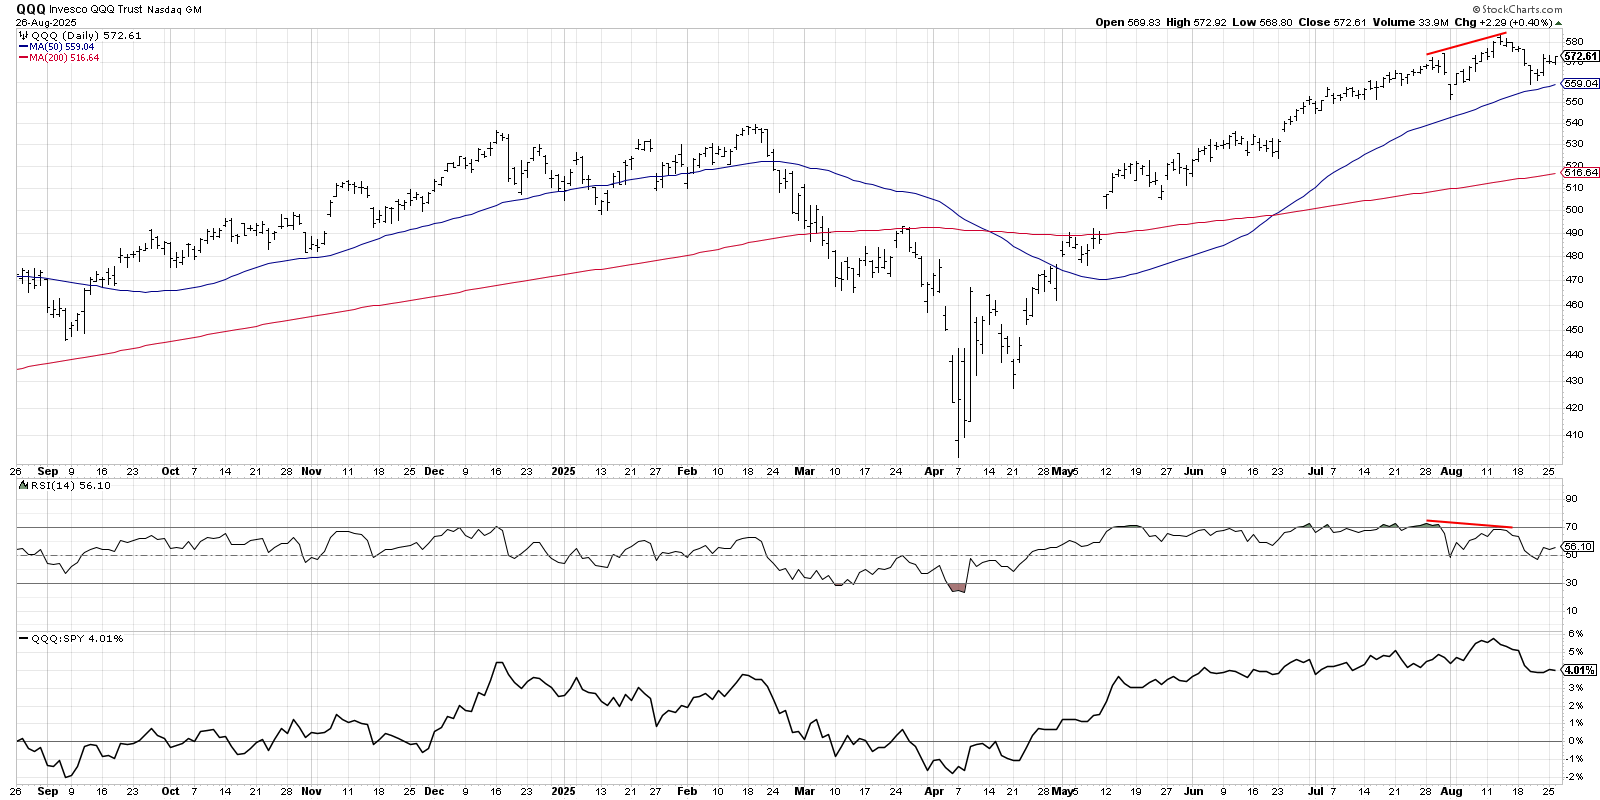
Even seasoned bulls may have taken a sudden inhale at the recent pullbacks, to say nothing of the fact that there is a clear bearish momentum divergence between price and Relative Strength Index (RSI) for the QQQ. With the weaker seasonal tendencies going into what often ends up being a major low in September, along with waning momentum in leading sectors like technology, it feels as if conditions are ripe for a significant change in trend.
So far, though, the chart of the Nasdaq 100 remains in a strong bullish position. Applying our Market Trend Model to the QQQ shows that the trend is positive in all three time frames. I tend to consider charts like this as “innocent until proven guilty”, and I’m not seeing any trend reversal signals just yet!
Today, we will revisit one of my favorite exercises, called “probabilistic analysis”. This is where we consider four different potential future paths for a major equity index, think about what could cause these scenarios to play out in real life, and reflect on all the different possibilities. It’s so easy to get focused on one narrative, so this approach forces us out of our comfort zone.
We most recently conducted this exercise on the S&P 500, and the results from early July to mid-August showed a clear winner out of the four scenarios.
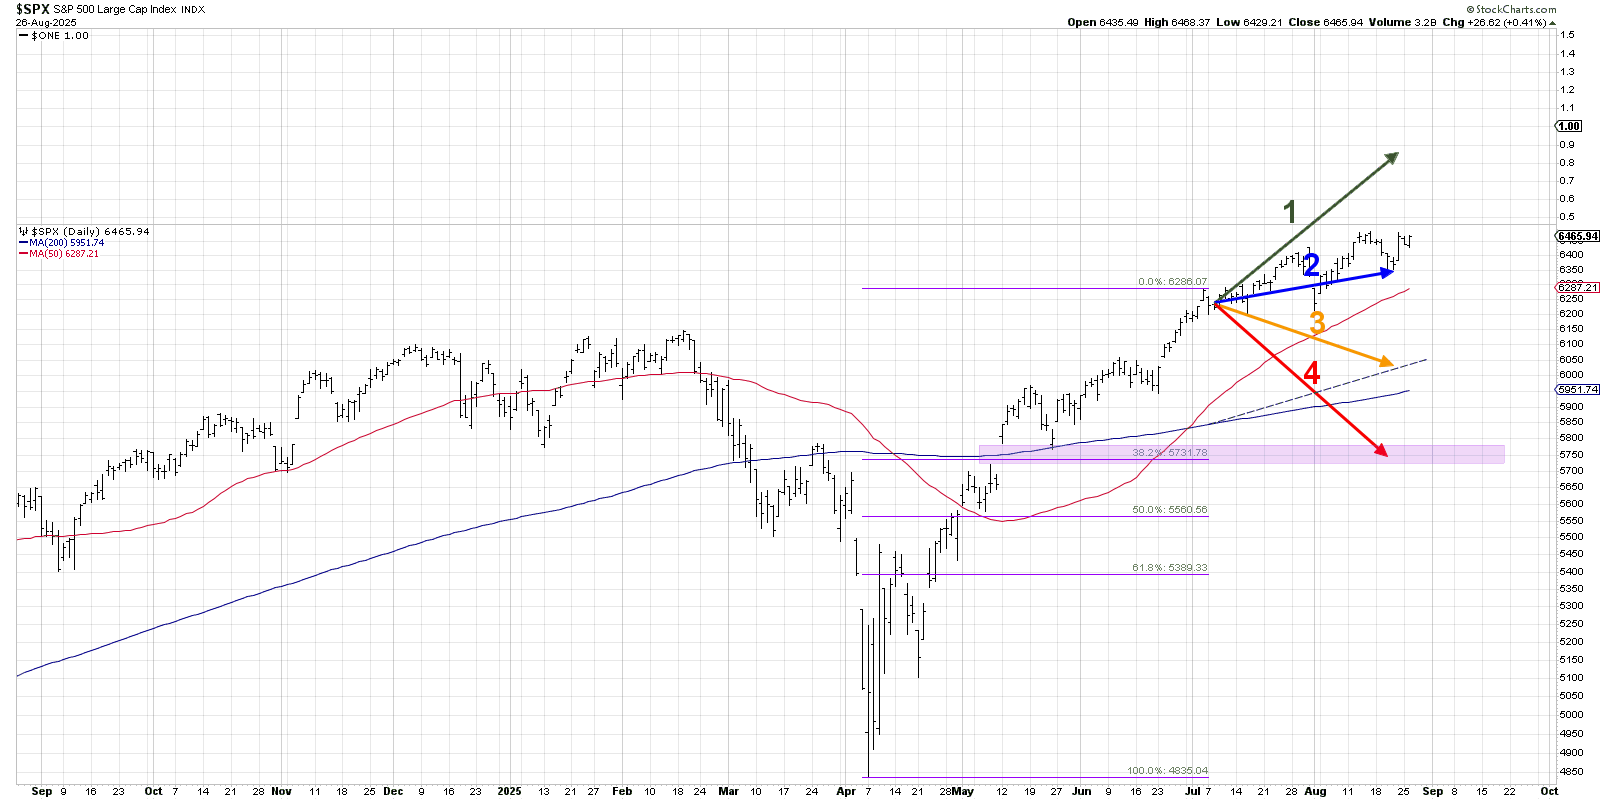
We can see that scenario #2, the “mildly bullish” scenario, followed almost exactly the actual price action for the S&P 500 over that six-week period. While leading growth names pulled back in August, improving breadth conditions and surges higher in other key sectors kept the S&P 500 in a fairly strong position.
Now let’s review four scenarios for the Nasdaq 100 between now and early October. As a friendly remember, the point of this exercise is threefold:
- Consider all four potential future paths for the index, think about what would cause each scenario to unfold in terms of the macro drivers, and reflect on what signals/patterns/indicators would confirm the scenario.
- Decide which scenario you feel is most likely, and why you think that's the case. Don't forget to drop me a comment and let me know your vote!
- Think about how each of the four scenarios would impact your current portfolio. How would you manage risk in each case? How and when would you take action to adapt to this new reality?
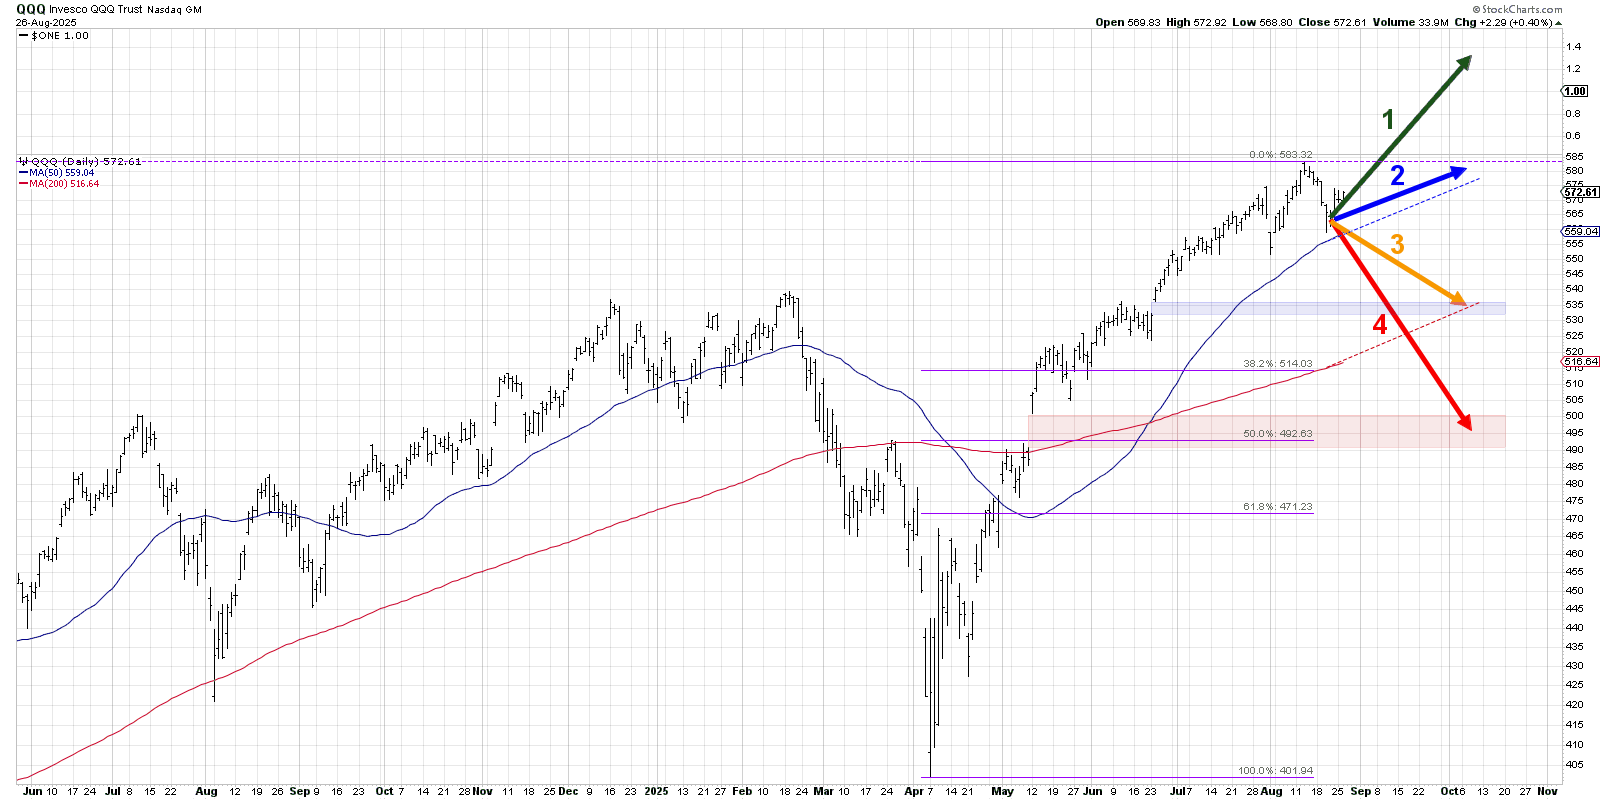
Let’s start with a very bullish outcome, where the Nasdaq 100 pushes “onward and ever upward” to further all-time highs.
Option 1: The Super Bullish Scenario
What if the QQQ shrugs off the recent pullbacks, and just resumes the uptrend with a similar pace that we observed back in July? That would put the Nasdaq 100 up to around $620 by early October, and would have to be driven by a strong recovery from the Magnificent 7 stocks. A 25 bps rate cut, along with a very accommodative stance from Fed Chair Powell at the September meeting, would allow the QQQ to completely ignore the usual seasonal weakness of September.
Dave’s Vote: 5%
Option 2: The Mildly Bullish Scenario
A more measured bullish scenario would mean the Nasdaq 100 pushes back higher, but only back to the August high around $580. Perhaps there’s further leadership rotation, and the lack of upside momentum in the Magnificent 7 names means limited upside for the equity markets. Maybe inflation data comes in higher, and investors begin to question how easily the Fed will manage its dual mandate of growing jobs while managing inflation.
Dave’s vote: 20%
Option 3: The Mildly Bearish Scenario
If the 50-day moving average fails to hold in the coming weeks, then it would appear that the normal seasonal weakness is taking hold. Calls for negative impact from tariff policies begin to show real signs of negative impact for consumers, pushing the QQQ down as growth stocks struggle.
A mildly bearish scenario would put the QQQ down to around the 200-day moving average, which could provide a perfect springboard for the market to rip higher as it often does in Q4. Bears will feel mildly vindicated, but, in the end, the secular trend remains clearly bullish.
Dave’s vote: 60%
Option 4: The Super Bearish Scenario
You always need a doomsday scenario, if only to serve as a reminder that big corrections can and will happen! In our super bearish scenario, we would see potential downside to just below $500 for the QQQ, representing about a 50% retracement of the April to August rally phase.
A combination of stronger inflation readings, along with further evidence that tariff policies are set to cause a significant slowdown in consumer spending, drives risk assets dramatically lower. By early October, we’re debating whether a retest of the April 2025 lows is in the cards in Q4.
Dave’s vote: 15%
What probabilities would you assign to each of these four scenarios? Check out the video below and then drop a comment with which scenario you select and why!
RR#6,
Dave
P.S. Ready to upgrade your investment process? Check out my free behavioral investing course!
David Keller, CMT
President and Chief Strategist
Sierra Alpha Research
Disclaimer: This blog is for educational purposes only and should not be construed as financial advice. The ideas and strategies should never be used without first assessing your own personal and financial situation, or without consulting a financial professional.
The author does not have a position in mentioned securities at the time of publication. Any opinions expressed herein are solely those of the author and do not in any way represent the views or opinions of any other person or entity.


