Bottom Fishing or Breakdown? How to Spot a True Trend Reversal
When a stock like Palantir (PLTR) or Coinbase (COIN) experiences a strong downside move, how can we determine when this sudden loss becomes a huge opportunity to play an upside reversal?
“Bottom fishing” can be a dangerous game to play, because prices usually go down for a reason. Betting on an end to the downtrend can result in significant losses if and when an upturn never really materializes. The good news is that the technical analysis toolkit includes a series of indicators to help us identify potential reversals during a downtrend phase.
Today, we’re going to look at a recent example of a classic upside reversal, using Alaska Air Group (ALK) to demonstrate the indicators that can help us anticipate a bottom and then confirm the turn. We’ll then apply those techniques to PLTR and COIN to see if they are providing reasons to be optimistic in mid-February.
Watching for Changes of Character: ALK
By November 2025, ALK had pounded out a consistent pattern of lower lows and lower highs off its September swing high. All along the way, the price experienced countertrend rallies that tended to stall out right around a descending 21-day exponential moving average.
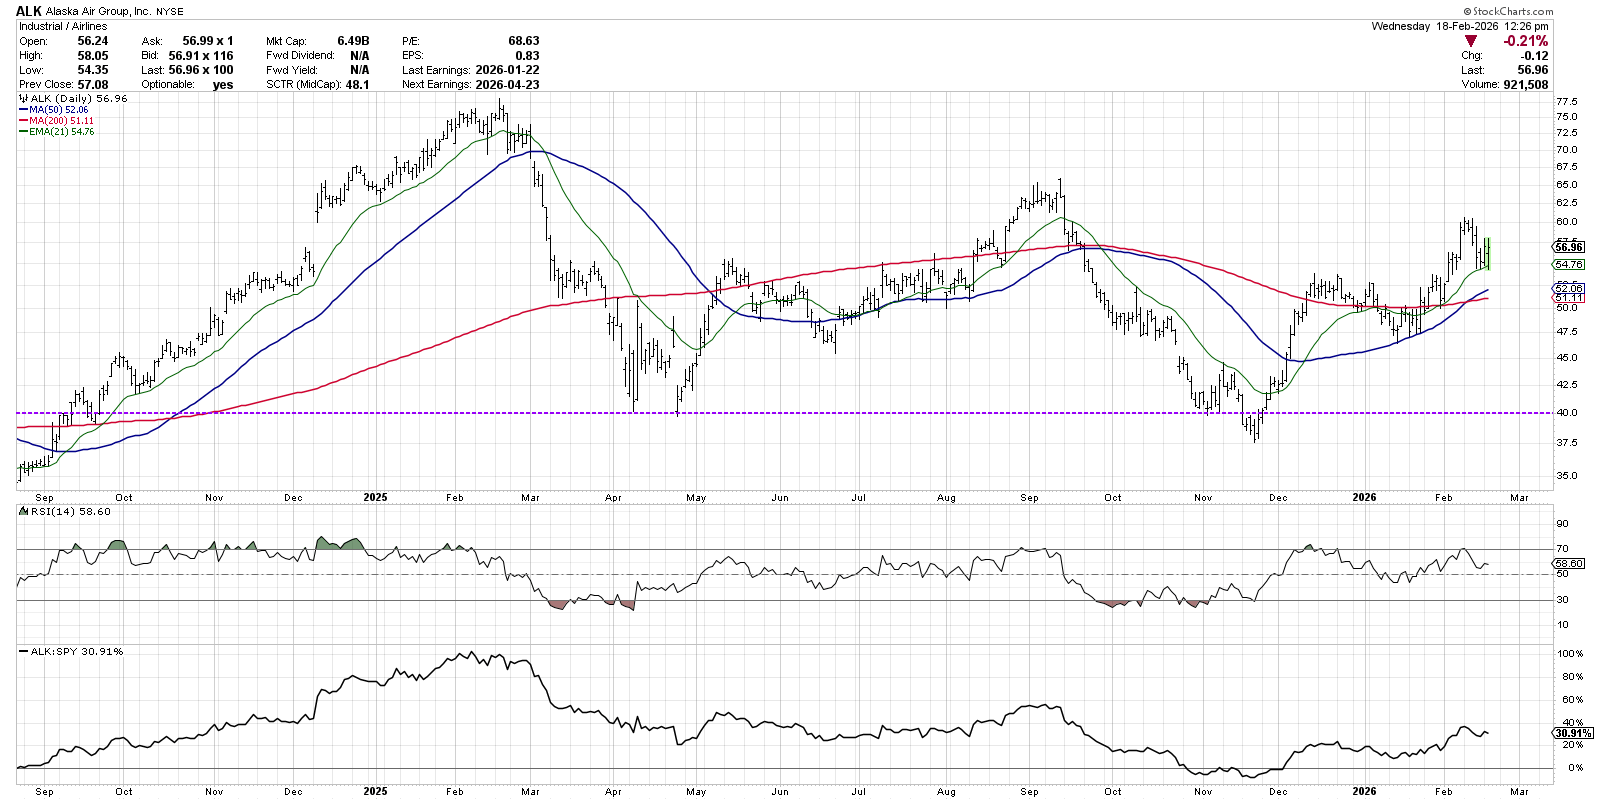
Those October and November lows lined up very well with a major low in April 2025, providing one clue that a bottoming pattern may emerge. That second low in late November was marked by a higher RSI reading, resulting in a classic “bullish momentum divergence” where price goes lower but the momentum indicator trends higher.
🚨 FREE WEBCAST ALERT 🚨
As market cycles mature, leadership often shifts in subtle but important ways. In our upcoming free webcast, "The Calm Before the Turn: Late-Cycle Sector Leadership", I break down the classic sector rotation model, review how leadership has evolved at key historical inflection points, and compare those patterns with what we’re seeing in today’s market.
I'll also highlights the key risk and confirmation signals I'm monitoring, focusing on leadership, breadth, and relative strength, to assess whether the market is merely consolidating or entering a more meaningful transition.
👉 Register and get access at: marketmisbehavior.com/calm
After Alaska featured a bullish momentum divergence as it tested key price support, the chart experienced what I’d consider a “change of character” where evidence shifted from a distribution phase to an accumulation phase. The price rallied and finally broke above the 21-day EMA, followed soon after by a move above the 50-day moving average. The RSI pushed above 50, then 60 as buyers began to believe and signs of accumulation emerged.
To summarize the Q4 low for ALK, it’s all about balancing the leading indicators such as traditional support levels and momentum divergences, and also looking for confirmation in the form of improved price action and momentum readings.
Being Patient for Evidence to Emerge: PLTR
Now that we’ve analyzed a classic bottoming pattern, let’s apply that framework to the chart of Palantir. We can definitely detect clear signs of distribution, with a December retest of November’s all-time high, followed by a breakdown of moving average support and declining momentum.
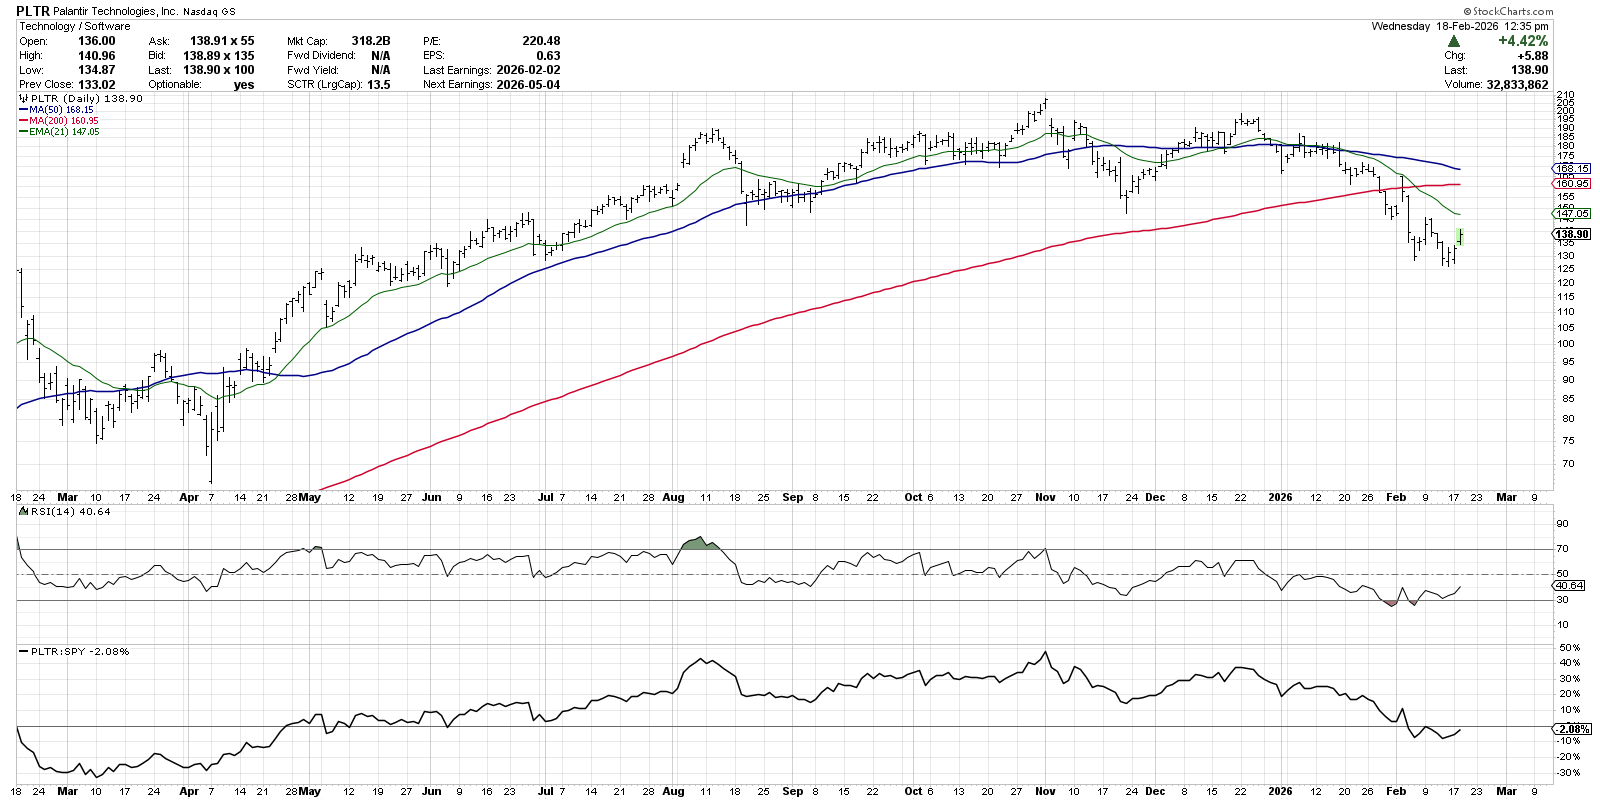
Just in the last week, we've been detecting a potential bullish momentum divergence, with the most recent swing low marked by higher RSI readings. That would imply a potential bottoming signal. On the other hand, PLTR has already broken through a significant support level around $150, and we have yet to test the 21-day EMA since early February.
Remember how the chart of Alaska experienced a change of character, with a price breakout and improved momentum levels signaling a rotation to a new accumulation phase? That’s exactly what I’m looking for on the chart of Palantir. Until and unless PLTR breaks above its 21-day EMA, accompanied by an RSI pushing above 50 and 60 to represent improved buying power, I’m inclined to consider this chart “guilty until proven innocent.”
When In Doubt, Zoom Out: COIN
Shares of Coinbase have experienced an even more significant drop than PLTR, with the price down as much as 68% off the July 2025 all-time high. A bounce higher this week has many investors thinking about a bottom here! Let’s review the evidence in light of this suite of technical indicators.
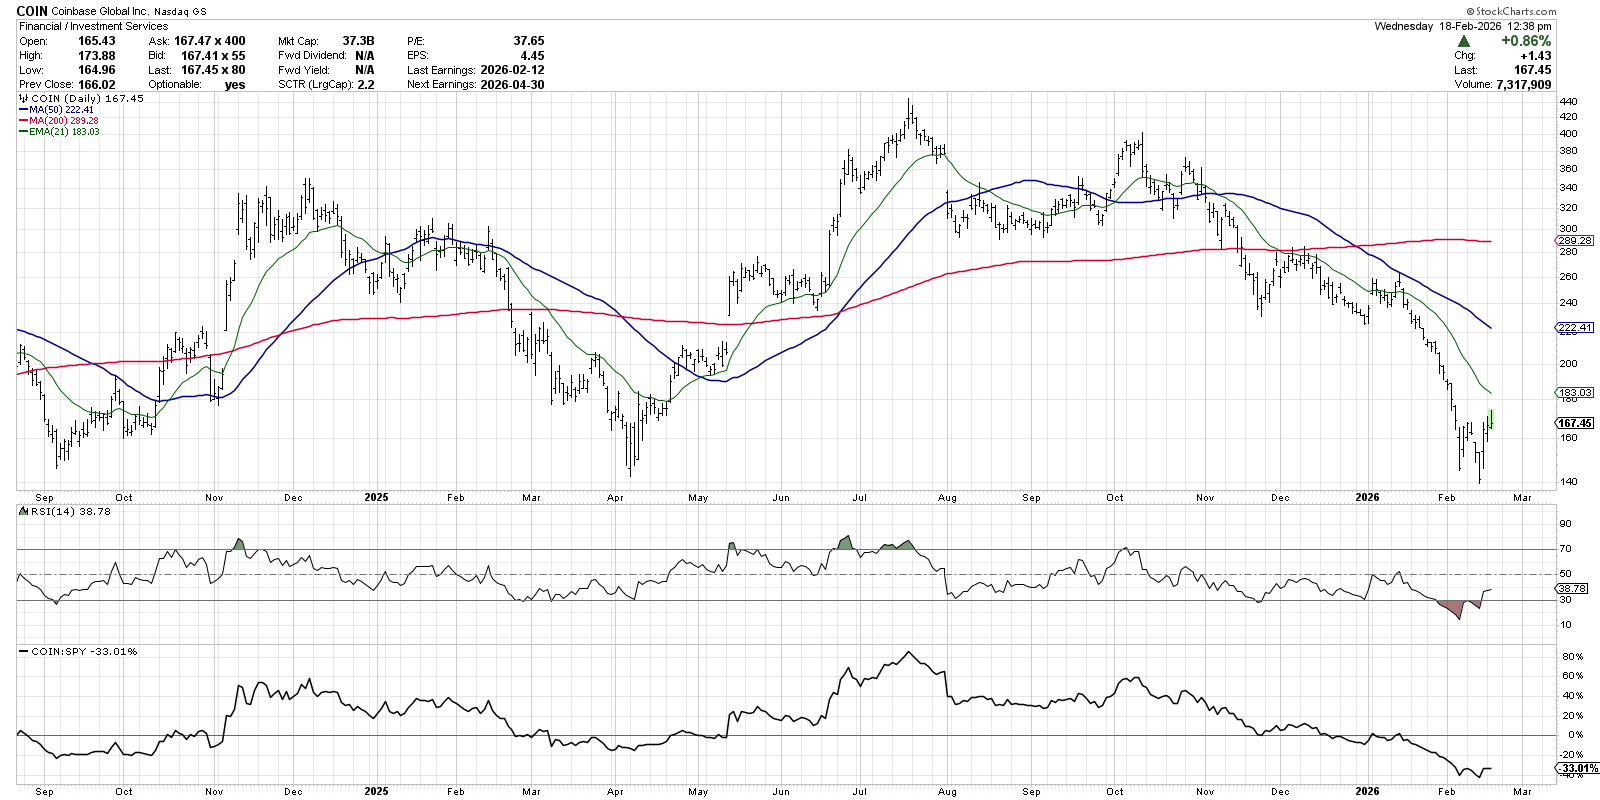
The price remains in a primary downtrend of lower lows and lower highs, but this week’s rally may finally give us a higher high, which would be an encouraging sign. We’re noting a short-term bullish momentum divergence, although the signal would be more powerful if that second low was marked by an RSI above the oversold level.
Despite that potential divergence, we haven’t really seen any signs of accumulation in terms of moving average breaks or improved price momentum. So this could be a similar situation to Palantir, where we’ve detected some initial signs of a bottom but no confirmational signals.
Any time a chart appears unclear, it can be quite helpful to bring in more data to provide greater context. Let’s review the weekly chart and see how this could help solidify the picture.
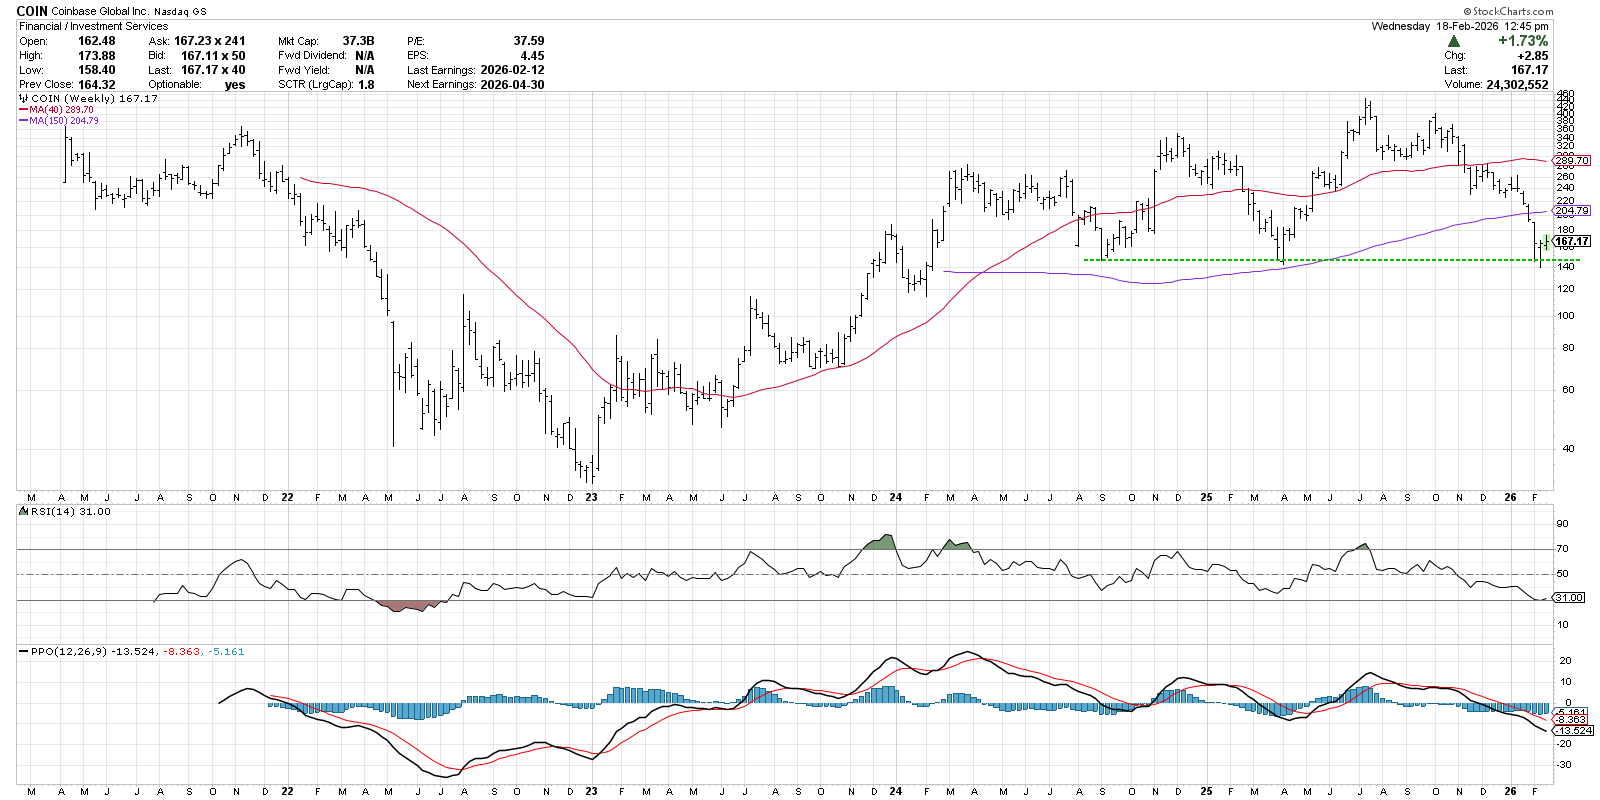
A quick glance at the weekly chart shows that this recent low aligns quite well with major lows in Q1 2025 and Q3 2024. Last week featured a hammer candle on the weekly chart, with the open and close for the week near the top of the range and long lower shadow. This implies short-term accumulation as the price tested that significant support level.
The weekly chart seems to confirm the importance of price support around current levels. And similar to the lagging indicators we discussed on the weekly chart, we can use an indicator like the weekly PPO to validate that a major low has occurred. Just as the 2024 and 2025 lows were confirmed soon after by a bullish PPO crossover, a similar pattern in February and March 2026 could indicate another major low for this crypto play.
The technical analysis toolkit is actually quite diverse. Mindful investors know that, by combining leading and lagging indicators, we can improve our returns by anticipating and then confirming major price lows.
RR#6,
Dave
P.S. Ready to upgrade your investment process? Check out my free behavioral investing course!
David Keller, CMT
President and Chief Strategist
Sierra Alpha Research LLC
marketmisbehavior.com
https://www.youtube.com/c/MarketMisbehavior
Disclaimer: This blog is for educational purposes only and should not be construed as financial advice. The ideas and strategies should never be used without first assessing your own personal and financial situation, or without consulting a financial professional.
The author does not have a position in mentioned securities at the time of publication. Any opinions expressed herein are solely those of the author and do not in any way represent the views or opinions of any other person or entity.