Below the 200-Day: What’s Next for the S&P 500?

Key Takeaways
- The S&P 500 is below its 200-day moving average, and a bearish trend could continue until further notice.
- Looking at Fibonacci retracement levels, the next downside target for the S&P 500 could be 6170.
- Snapback rallies often occur during bear market phases, so look for patterns that indicate buyer exhaustion.
Since the end of February, the S&P 500 has broken below our initial support at 6800 and even our ultimate “line in the sand” at SPX 6550. With the major averages sitting below their 200-day moving averages, the equity market appears to be in a confirmed bearish phase.
How can we develop updated downside targets to anticipate an eventual end to a bearish phase? To answer that, let's analyze why this breakdown in March feels different than previous pullbacks, share how we’ve calculated an updated downside target for the S&P 500, and discuss how a snapback rally could make sense here.
Nothing Good Happens Below the 200-Day Moving Average
The S&P 500 is now below its 200-day moving average for the first time since May 2025. And with price momentum indicating a clear rotation from a sideways phase to a distribution phase, we’re detecting a bearish trend until further notice.
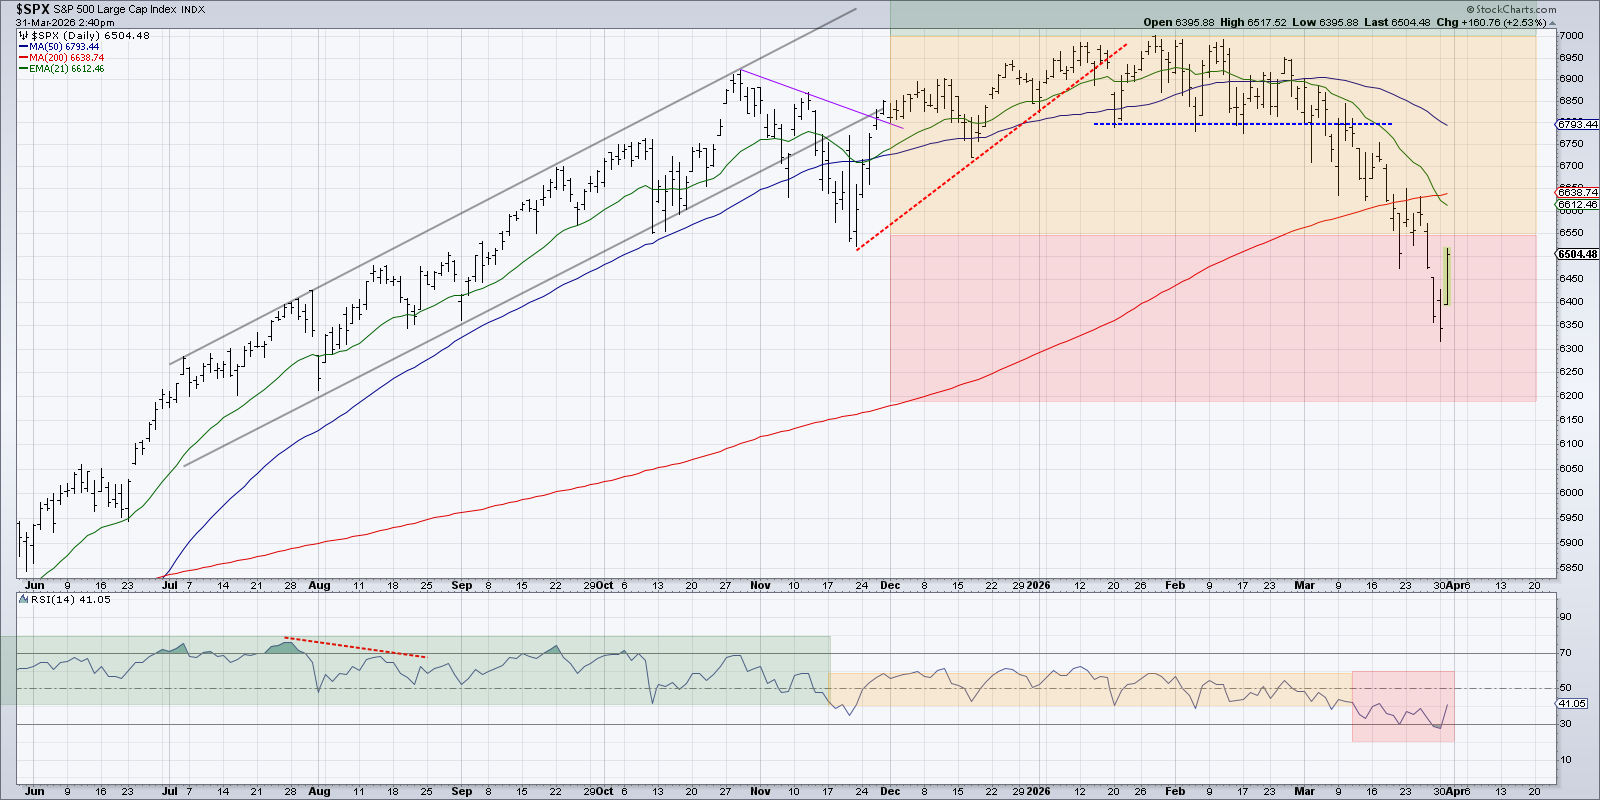
Our “traffic light” technique was focused on two key price levels, namely SPX 7000 as an important resistance level and SPX 6550 as a vital area of potential support. With the S&P 500 breaking below 6550, leaving the 200-day moving average in the rearview mirror, we see the equity markets as being in a “red light” downtrend unless the 200-day moving average can be regained.
The RSI remained in a neutral range between 40 and 60, going back to November 2025. As the S&P 500 remained rangebound, the neutral momentum suggested that buyers and sellers were in equilibrium. Perhaps more concerning than the price breakdown itself is the breakdown in price momentum, which shows that strong down days are a defining feature of the current bearish trend.
Multiple Indicators Suggest Downside Target Around SPX 6200
With the S&P 500 now comfortably below its 200-day moving average, it’s time to develop a new downside target, given the likelihood of further potential downside. Following the market maxim of “when in doubt, zoom out,” let’s go back to the beginning of 2025 to put the current corrective move into proper perspective.
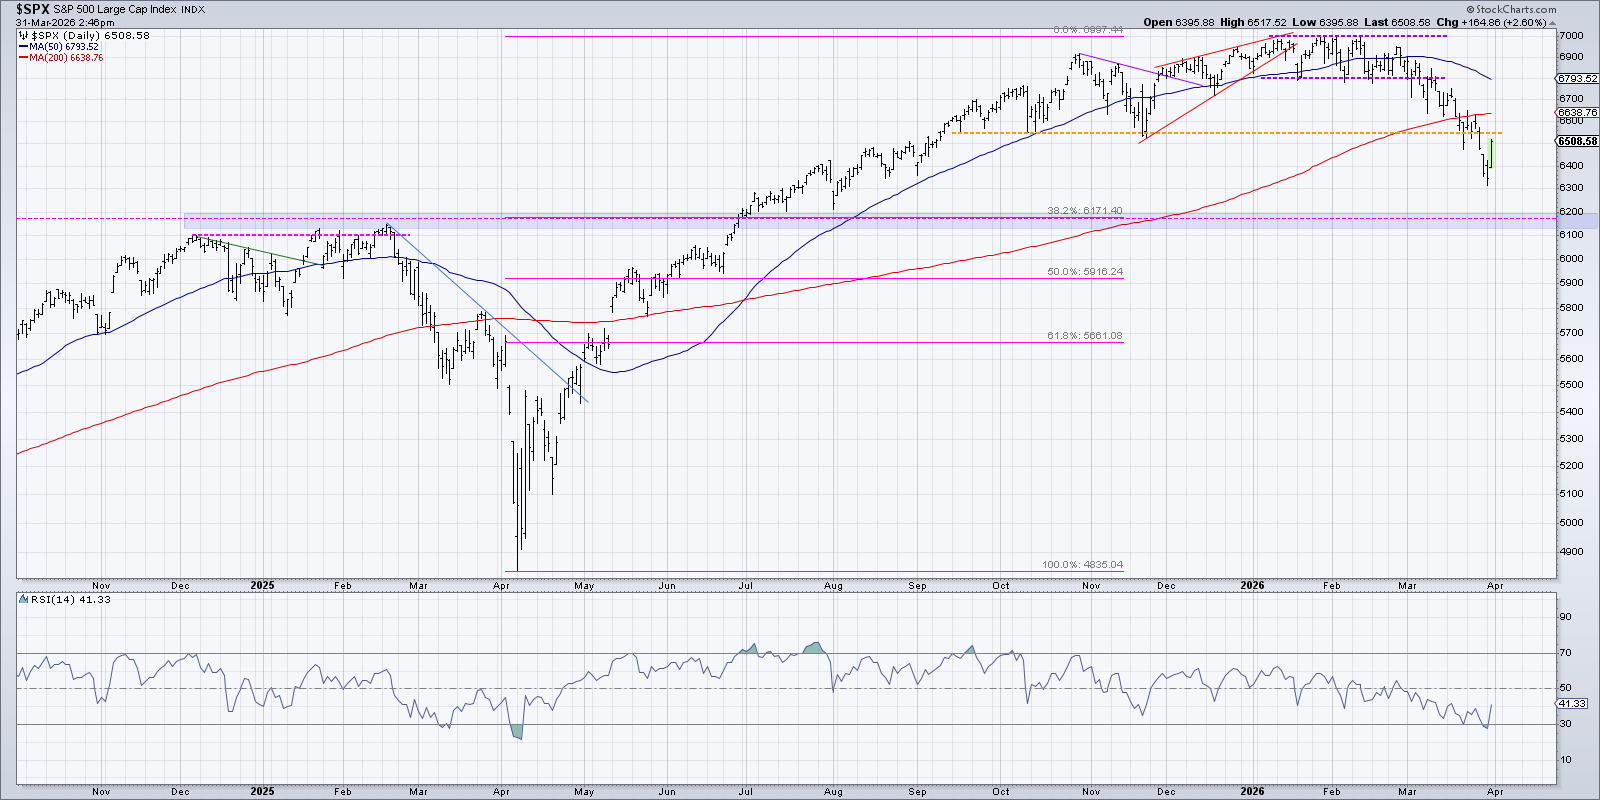
Applying a Fibonacci framework to the 2025–2026 period, we can use the April 2025 low around SPX 4850 and the January 2026 high at SPX 7000. A 38.2% retracement back to the April 2025 low suggests an initial downside target around 6170. We can see that this Fibonacci level lines up pretty well with the early 2025 peak around 6150.
A move down to 6150 would mean about a 12% drawdown from its all-time high earlier this year. What’s fascinating is that most years, including the most bullish uptrend years, often feature at least one pullback in this sort of range. So, while macro pressures and increased volatility have made March 2026 feel like a new secular bear market, a move down to our upside price objective would still be a fairly common and straightforward pullback.
Snapback Rallies Can be Sudden, Severe, and Seductive
The most bullish price moves often happen during bear market phases, when anxious buyers jump into a short-term bounce with the hope of a full recovery. We can look back to early 2025 for a perfect example of what we could see in the coming weeks.
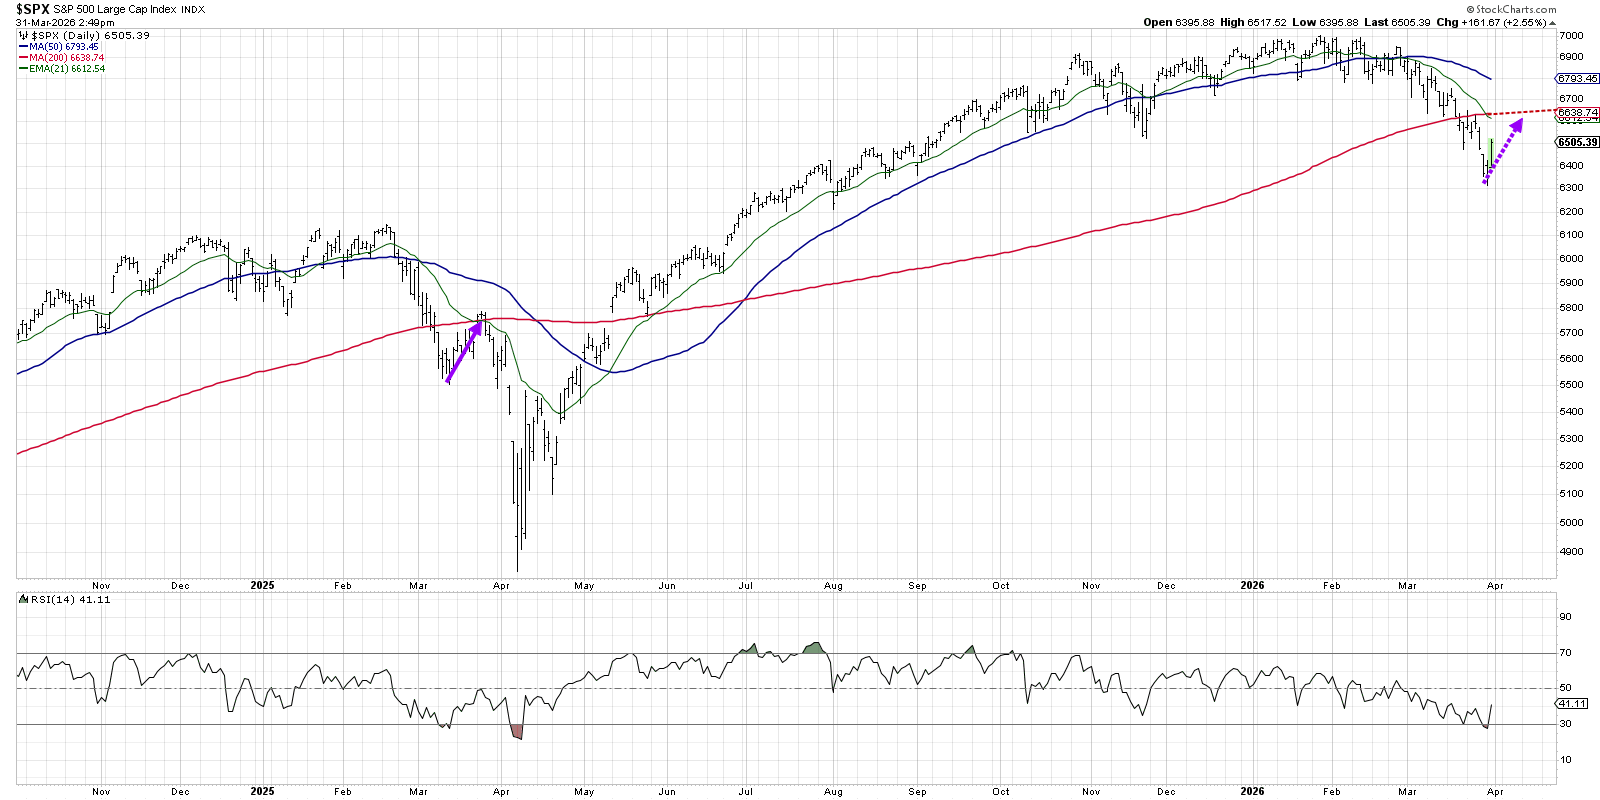
After a peak around 6150 in February 2025, the S&P 500 dropped to 5500 before its first upside reversal. This bounce took the SPX back to its 200-day moving average, which then served as price resistance. After the rest of the 200-day MA, an absence of willing buyers meant the downtrend could continue, eventually leading to the April 2025 market low.
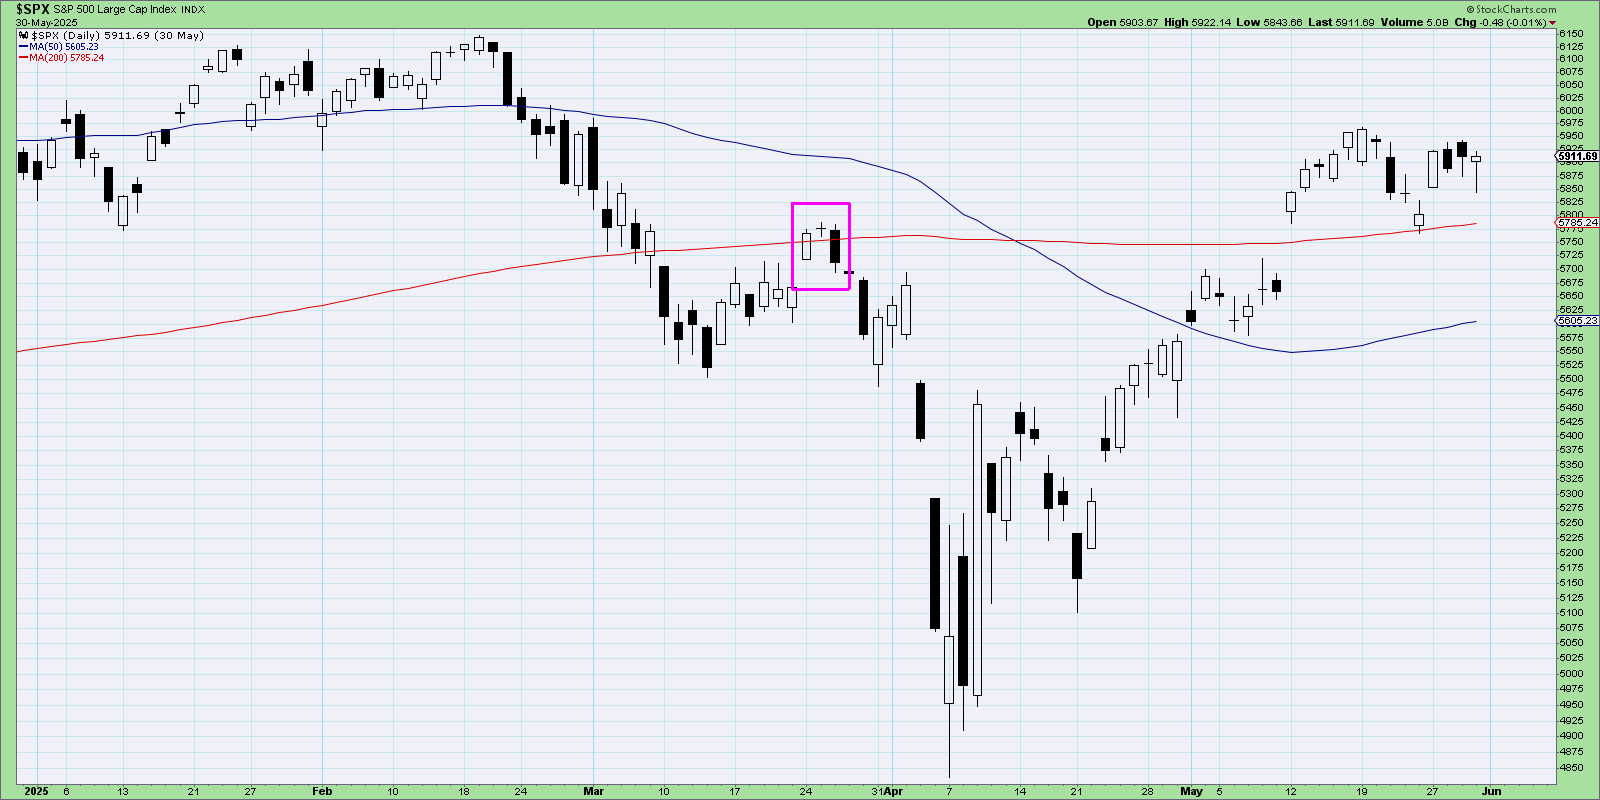
A closer look at the countertrend rally in March 2025 shows a classic candle reversal pattern called an “evening doji star” pattern. This pattern is marked by one big up day, followed by a doji candle where the open and close are almost identical. The final day is a big down day, representing a surge in selling pressure. This three-candle pattern suggested an exhaustion of buyers into the retest of the 200-day moving average.
If we see a similar countertrend rally to the 200-day moving average, we’ll be watching closely for any short-term signs of trend exhaustion. While candle patterns aren't usually meaningful for longer-term trend analysis, I’ve found that short-term reversal patterns often bring excellent validation of what trend may come next.
RR#6,
Dave
P.S. Ready to upgrade your investment process? Check out my free behavioral investing course!
David Keller, CMT
President and Chief Strategist
Sierra Alpha Research LLC
marketmisbehavior.com
https://www.youtube.com/c/MarketMisbehavior
Disclaimer: This blog is for educational purposes only and should not be construed as financial advice. The ideas and strategies should never be used without first assessing your own personal and financial situation, or without consulting a financial professional.
The author does not have a position in mentioned securities at the time of publication. Any opinions expressed herein are solely those of the author and do not in any way represent the views or opinions of any other person or entity.


