Cracks in Mega-Cap Leadership: What MSFT, AMZN, and TSLA Are Telling Us

While the S&P 500 and the Nasdaq 100 have spent much of the last few months in a frustrating sideways range, the recent action beneath the surface is starting to tell a different story. The resilience in the major averages has largely been driven by mega-cap growth names holding key support, but cracks are beginning to form as we move through March.
The three charts we are reviewing today all come from that group of mega-cap leadership names. If these names continue to weaken, it will become much more difficult to make a bullish case for our market cap-weighted benchmarks.
Microsoft: Downtrend Confirmed, Again
Microsoft (MSFT) was one of the first mega-cap names to show signs of deterioration, and the pattern that developed over the last six months now looks quite problematic. The stock carved out a classic double top in 2025, with major peaks in July and again in October. From there, price pulled back to a confluence of support defined by the 38.2 percent Fibonacci retracement level and the 200-day moving average.
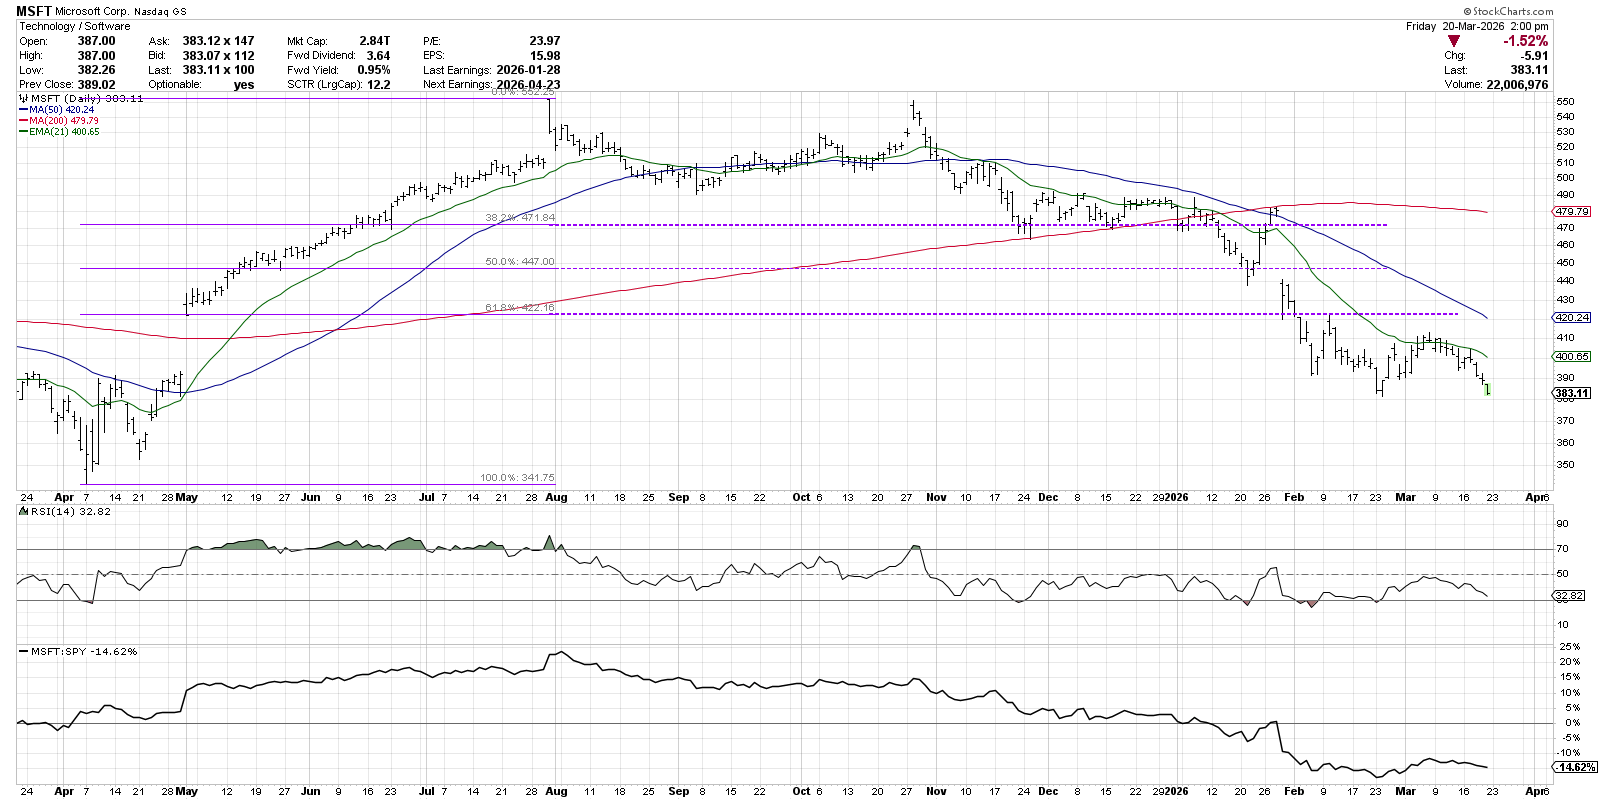
After holding the $470 level in November and December of last year, MSFT finally broke below both support levels in January. A short-term rally into late January brought the stock back up to test that same resistance zone near $470, but that move eventually failed. A gap lower following Q4 earnings confirmed the breakdown and, since then, the chart has continued to weaken.
MSFT has now violated additional support levels, including the 61.8% retracement, and is trading below multiple downward-sloping moving averages. The RSI has remained mostly below 50, reinforcing the idea that this is indeed a bearish phase. With the price now approaching the 52-week low around $382, the lack of buying interest stands out. What could have been a compelling dip-buying opportunity instead continues to show persistent distribution.
Amazon.com: Bearish Continuation Pattern
Amazon (AMZN) presents a different, but equally concerning, technical setup. After peaking in early November 2025, the stock failed to reclaim those highs during subsequent rallies in January, stalling below the $250 level. A series of downside gaps then pushed AMZN below its 200-day moving average in early February, signaling a meaningful change of character.
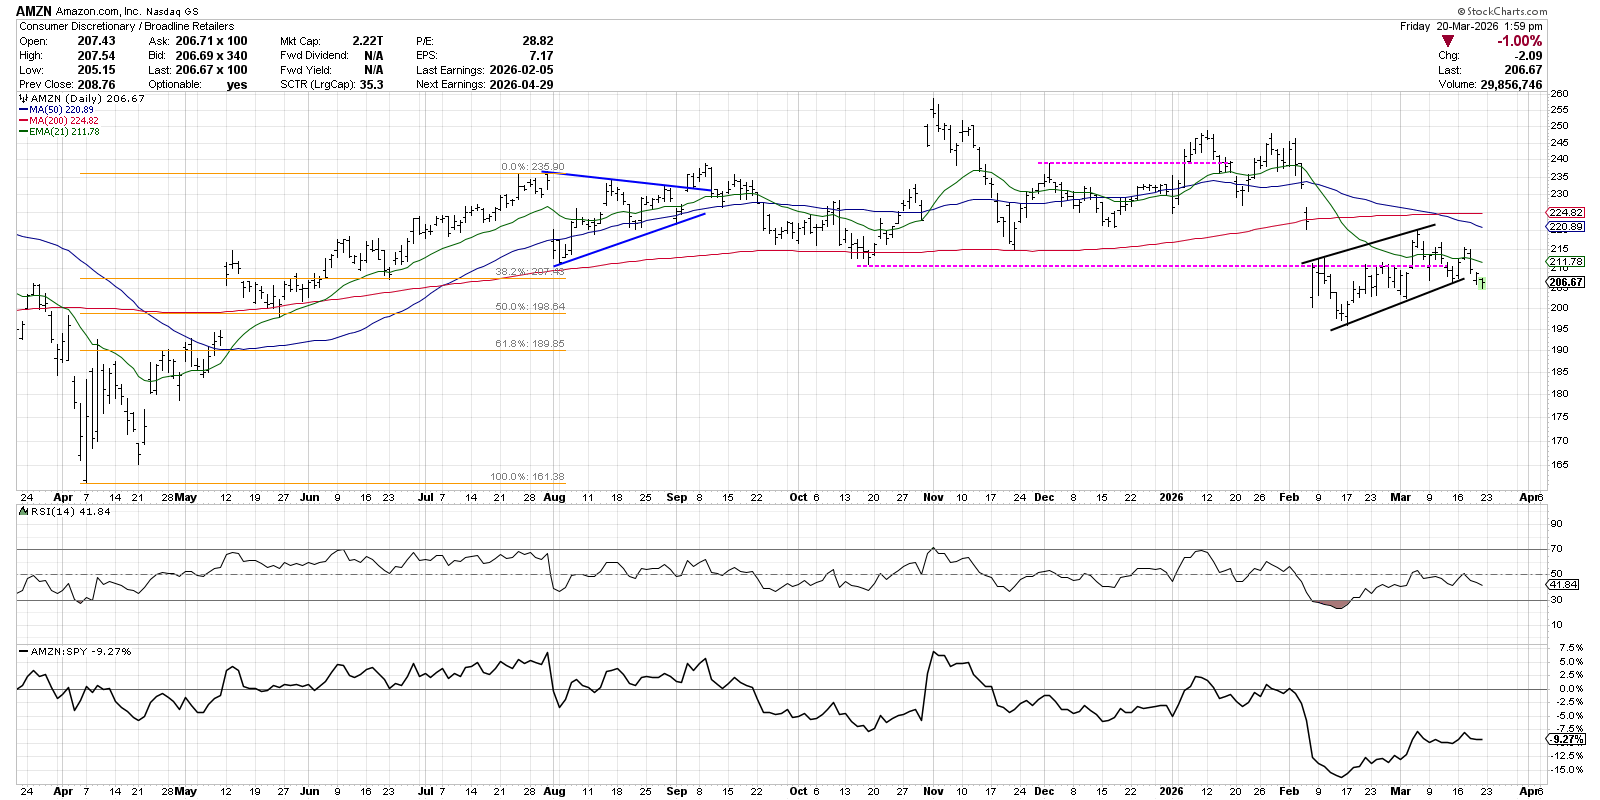
From there, the chart developed a classic bear flag pattern. Following an established downtrend, AMZN formed a short-term rising channel defined by higher highs and higher lows into mid-March. While that type of structure can appear constructive at first glance, it often represents simply a pause within a larger decline.
This week, AMZN confirmed a breakdown below the lower boundary of that channel. That move suggests a continuation of the previous downtrend, rather than an upside reversal. Bear flag patterns are classic continuation signals, and the resolution to the downside implies further weakness ahead as sellers regain control.
Tesla: Violating Key Support
Tesla (TSLA) highlights a third variation of concern, one that may be even more important from a sentiment perspective. Along with names like NVIDIA (NVDA) and Broadcom (AVGO), Tesla had been part of a group of mega-cap stocks holding key support levels while the broader market chopped sideways.
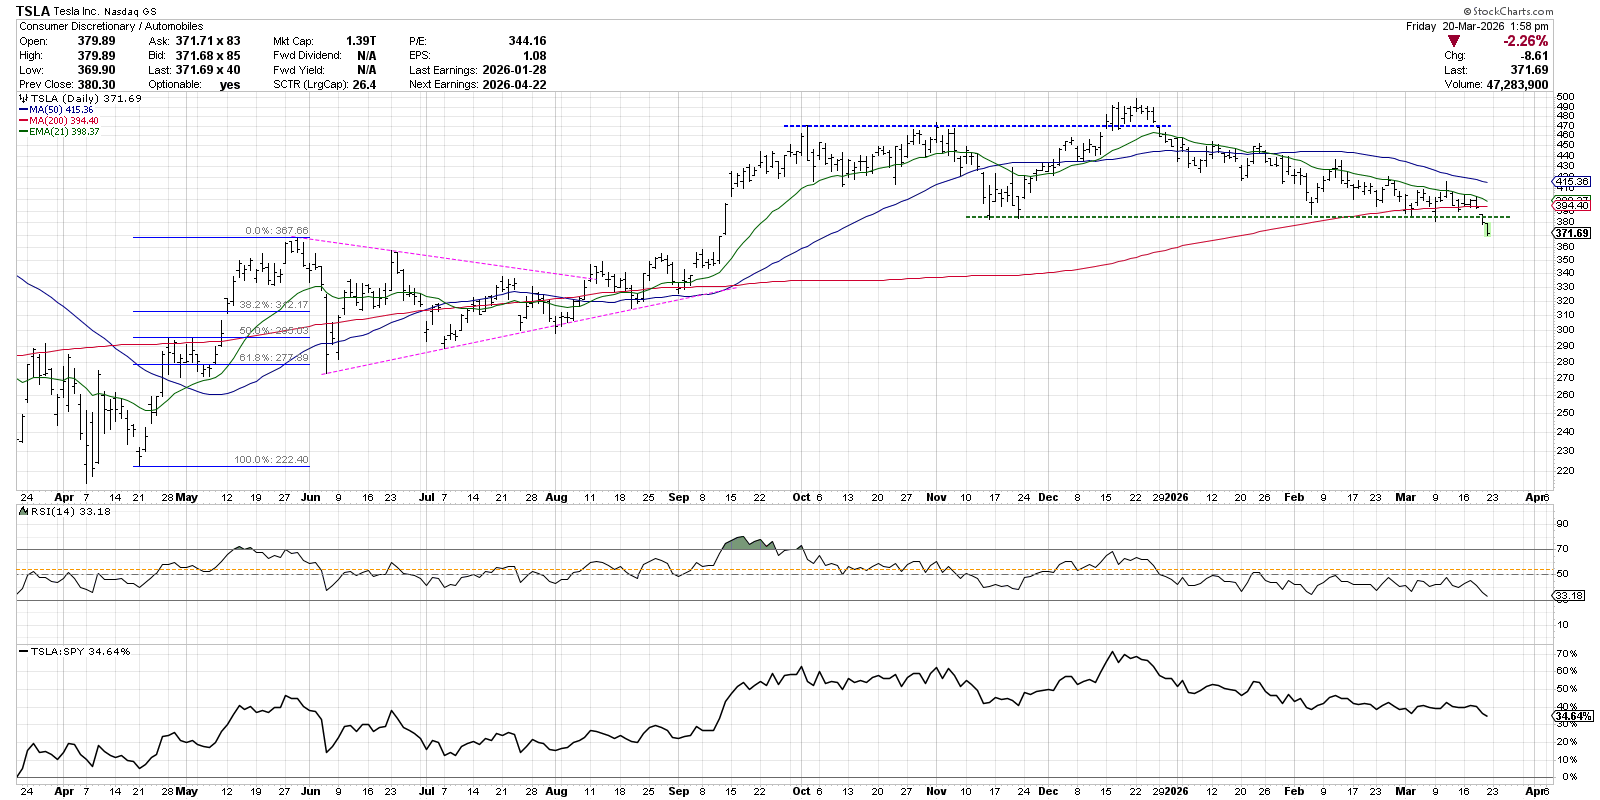
For much of March, Tesla repeatedly tested its 200-day moving average and managed to hold. Each successful test reinforced the idea that buyers were willing to step in at key levels, providing a foundation for the broader indexes. That dynamic appears to be changing.
Late this week, Tesla broke decisively below the 200-day moving average with a gap lower, and follow-through selling has confirmed that breakdown. What had previously been a reliable support zone is no longer attracting buyers. When a stock tests support multiple times and eventually fails, it often reflects exhaustion from the demand side.
This shift is significant. As long as leading stocks were holding support, it was reasonable to argue that the market had a solid base. With Tesla now breaking down, that argument becomes much harder to defend. The absence of buyers at critical levels opens the door for further downside.
Taken together, these three charts illustrate three distinct bearish patterns emerging within the same leadership group. Microsoft reflects a confirmed downtrend with little evidence of accumulation. Amazon is resolving a continuation pattern to the downside. Tesla is breaking below previously well defended support levels, signaling a lack of willing buyers.
If these trends persist, it raises serious questions about the ability of the S&P 500 and Nasdaq 100 to maintain their recent range. When the largest components of those indexes begin to deteriorate, the broader market often follows.
For now, the message from these charts is clear. Weakening leadership is not a bullish signal. And until we see evidence of buyers stepping back in, the path of least resistance may continue to be lower.
RR#6,
Dave
P.S. Ready to upgrade your investment process? Check out my free behavioral investing course!
David Keller, CMT
President and Chief Strategist
Sierra Alpha Research LLC
marketmisbehavior.com
https://www.youtube.com/c/MarketMisbehavior
Disclaimer: This blog is for educational purposes only and should not be construed as financial advice. The ideas and strategies should never be used without first assessing your own personal and financial situation, or without consulting a financial professional.
The author does not have a position in mentioned securities at the time of publication. Any opinions expressed herein are solely those of the author and do not in any way represent the views or opinions of any other person or entity.