Nervous Investors Should Look Here in March

During a secular bull market, it's generally best to be overweight in aggressive sectors like Technology (XLK) and Consumer Discretionary (XLY). There are exceptions to this rule, however, and the third month of calendar quarters (March, June, September, and December) is one such exception. This is the month that sees the end of one earnings season and the start of another. Once we slip past earnings season, money tends to rotate and favor defensive areas of the market, and this is especially true in March.
First, to illustrate, let's check out the seasonal chart of Utilities (XLU) since 2013, the year that the S&P 500 finally cleared its double top from 2000 to 2007. It confirmed that a new secular bull market was underway. For the most part, Technology has led this bull market. March has been the month of Utilities, though, as you can see from this seasonal chart:
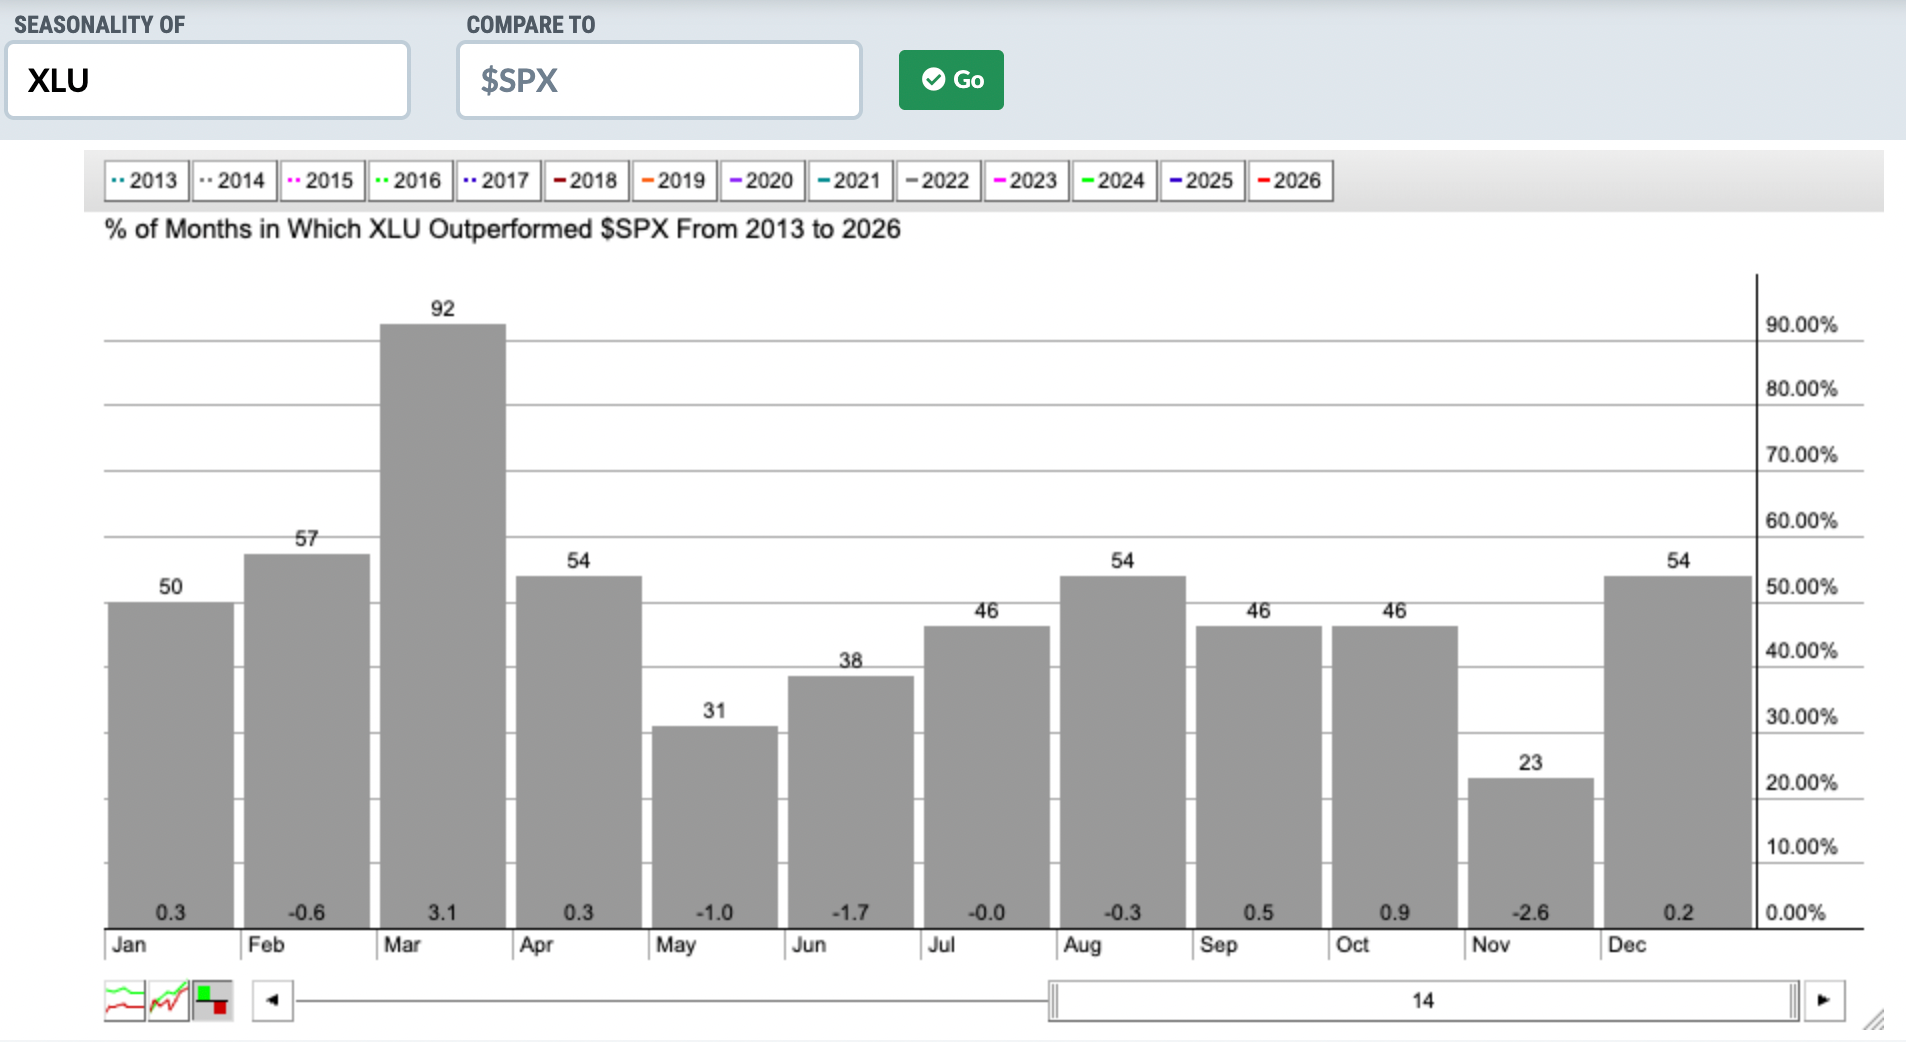
XLU has outperformed the S&P 500 in every March but one since 2013. Its average outperformance has been 3.1 percentage points. That relative strength really stands out on the above seasonality chart.
Technically, the XLU is strong right now, and is strengthening as we approach the seasonally-bullish month of March:
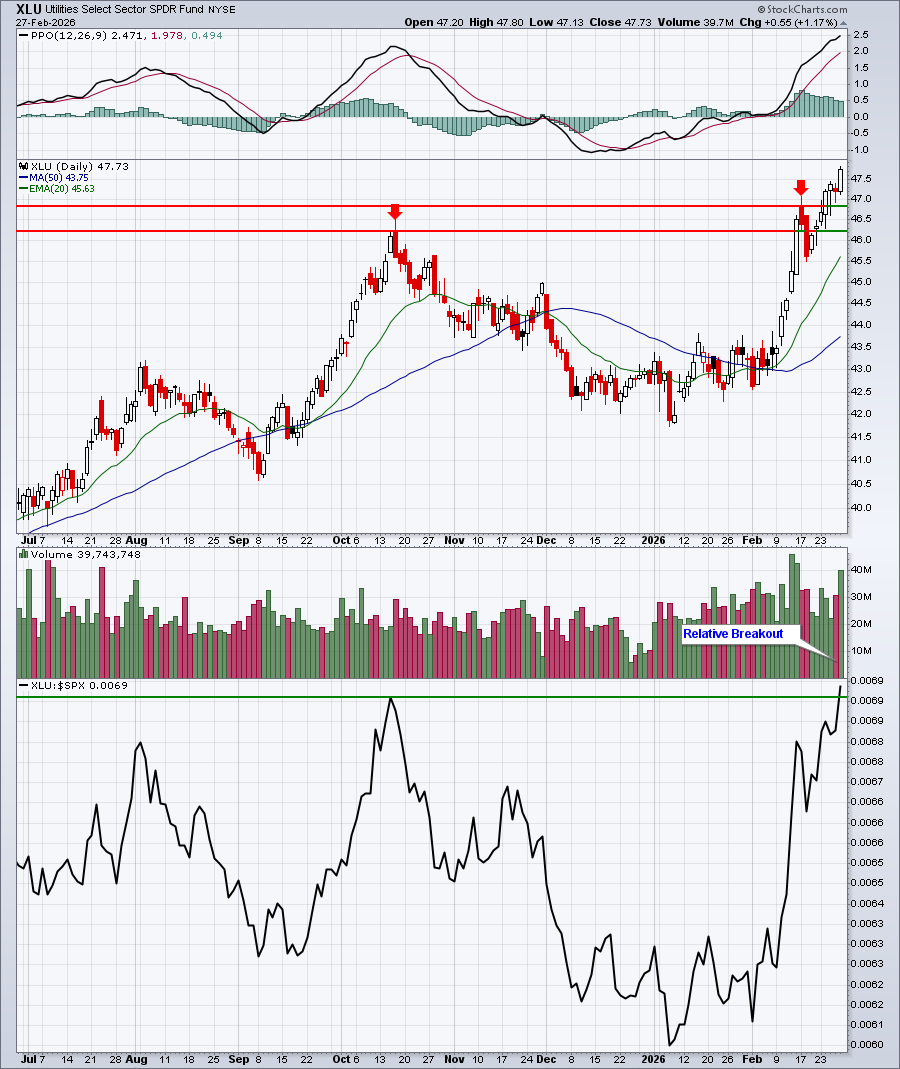
While nothing provides a guarantee of future performance, the combination of strong technical tailwinds, along with favorable seasonal tendencies, sets up this defensive sector nicely for the month ahead. It looks especially solid, given the overall market environment, which has been quite volatile and unsteady and as money rotates in more defensive fashion.
Monthly Seasonality Report
At the beginning of every month, we prepare a Seasonality Report for our EarningsBeats.com members, identifying sectors, industry groups, and individual stocks that show bullish tendencies for that month. At the beginning of February, I highlighted 20 large-cap stocks in either the S&P 500 or NASDAQ 100 that has shown seasonal strength during February since 2013 (during this secular bull market). These 20 stocks averaged gaining 3.05% during February, while the S&P 500 and NASDAQ 100 fell 0.86% and 2.34%, respectively. 13 of the 20 stocks finished the month higher, so it wasn't a slam dunk where they all gained ground. I also highlighted 10 small-cap stocks for February that performed extremely well, gaining an average of 9.05%, while the small-cap Russell 2000 (IWM) gained a mere 0.68%.
Among the February winners were Texas Pacific Land (TPL), which gained an astounding 50% in the last four weeks. Other big winners included Targa Resources Corp (TRGP) and Applied Materials (AMAT), which gained 17.33% and 15.65%, respectively. Six of our 10 small cap stocks gained from 10% to 20%, including Element Solutions (ESI), which jumped 20.58%. These are big gains during a period where our major indices essentially traded sideways to down.
If you'd like to receive your copy of our March Seasonality Report, you can do so for FREE by simply using our 30-day FREE trial offer. Kick the EarningsBeats.com tires throughout March and check out our service for yourself. We will reach out to you before your 30-day trial expires to make sure you want to continue and we'll provide you with an annual offer at that time that, if you enjoy our service, will save you a lot of money.
Happy trading!
Tom