Week Ahead: NIFTY Faces Resistance at These Levels; RRG Indicates Weakening Outpacing Shifts Within Sectors

The markets traded in a relatively narrow range throughout the week, displaying signs of mild consolidation while maintaining a positive bias. After opening slightly lower, Nifty managed to oscillate within a tight 400-point band, moving between 25,048.75 and 25,448.95 before closing the week with modest gains. The India VIX slipped 1.53% over the week to end at 9.97, indicating a continued low-volatility environment. Nifty wrapped up the week with a weekly gain of 213.05 points, or 0.85%.
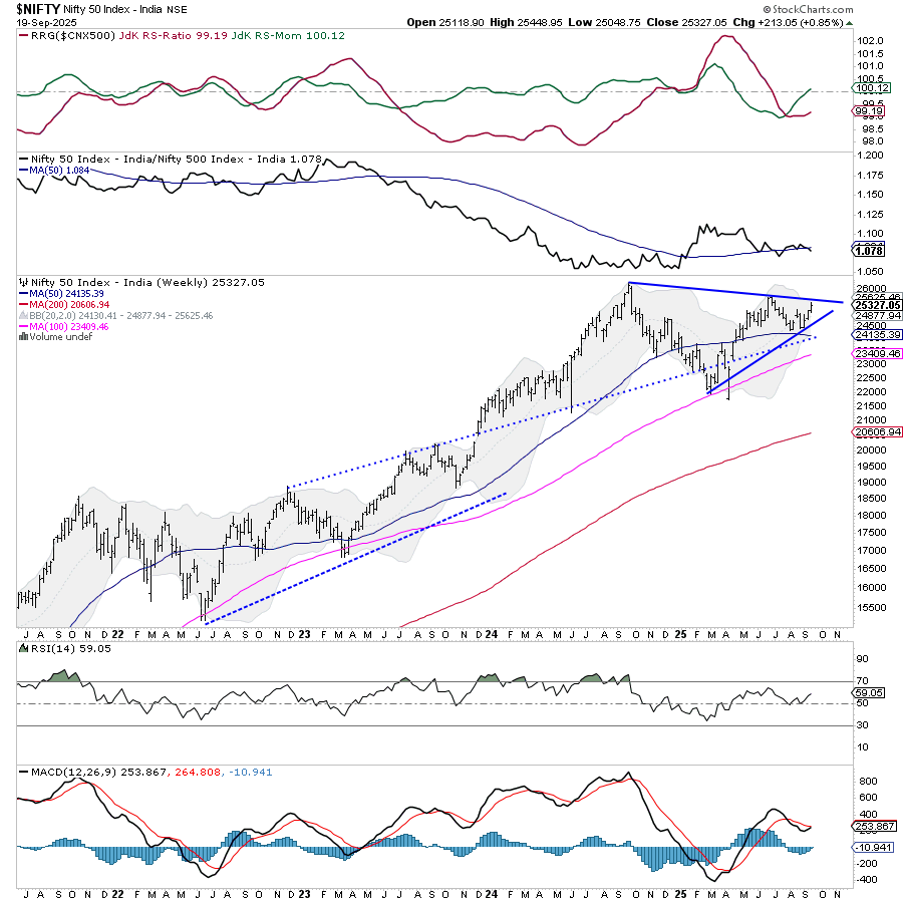
The current structure of the Nifty remains within a broad symmetrical triangle pattern, with the index attempting to move higher within this formation. It is also rising along a short-term ascending trendline support, forming a higher base each week. The ongoing price action reflects a potential breakout buildup; however, the index still faces overhead resistance from the upper boundary of the triangle near the 25,500–25,700 zone. A breakout beyond this could trigger a fresh leg of the uptrend, while failure to do so may continue to keep the index in a range. On the downside, the 24,900–24,800 zone continues to act as strong support, and a breakdown below this level could disrupt the current upward structure.
Given the structure and the underlying signals, the markets may see a stable-to -mildly-positive start to the coming week. However, global triggers, particularly the Fed’s recent 25bps hike and its forward guidance of two more cuts this year, could continue to have a bearing on market sentiment. Domestically, the recent developments around H1B visa regulations could lead to volatile and knee-jerk reactions in IT stocks, which might influence index-level movements. For the coming week, key resistance levels lie at 25,500 and 25,620; supports are at 25,000 and 24,850.
The weekly RSI stands at 59.03 and remains neutral, showing no divergence against price. It continues to track higher, supporting the positive momentum. The weekly MACD is on the verge of a positive crossover, as indicated by the narrowing histogram. The weekly candle is a small-bodied bullish candle, indicating indecision, but with a positive tilt.
From a pattern analysis standpoint, Nifty remains trapped within a broad symmetrical triangle. Price is approaching the apex of this formation, and the breakout or breakdown from this pattern could define the directional move for the coming weeks. Nifty also continues to trade comfortably above all key moving averages — 20, 50, 100, and 200-week — signaling that the primary trend remains upward.
For the coming week, while the broader structure remains bullish, a cautious and measured approach is warranted. IT stocks may remain volatile due to the H1B-related headlines, and any surprise from global or macro developments could induce sudden moves. Traders should avoid aggressive positioning at index levels and focus on protecting profits. A stock-specific approach, particularly in sectors showing relative strength, is advised. Market participants should keep a close watch on 25,650–25,700 for a potential breakout confirmation, while guarding 24,800 as critical support.
Sector Analysis for the Coming Week
In our look at Relative Rotation Graphs®, we compared various sectors against the CNX500 (NIFTY 500 Index), representing over 95% of the free-float market cap of all the listed stocks.
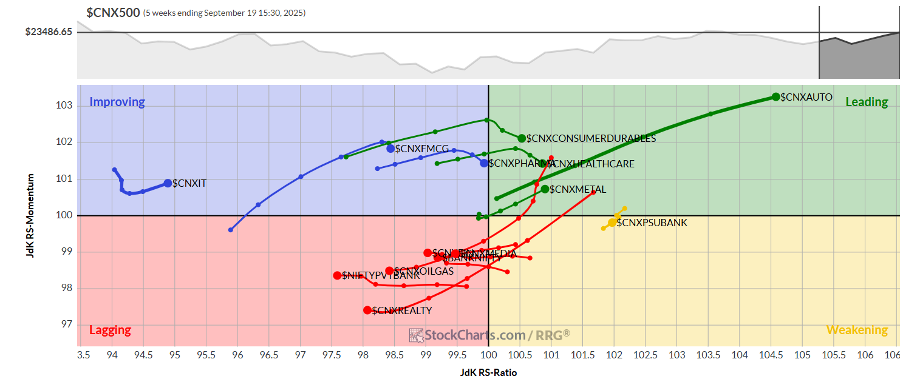
Relative Rotation Graphs (RRG) reflect the scarcity of leadership in the markets. The Nifty Auto, Pharma, and Metal Sectors are the only three sectors inside the leading quadrant. This space may continue to relatively outperform the broader Nifty 500 Index.
The Nifty PSU Bank Index has moved into the weakening quadrant; while its individual performance may continue, its relative performance may start to slow down. The Nifty Infrastructure, Media, and the Midcap 100 Sector Indexes remain inside the weakening quadrant as well.
The Financial Services Sector Index has rolled inside the lagging quadrant. The Commodities, Energy, Consumption, Services Sector, PSE, and the Realty Index also remain inside the weakening quadrant. These groups may underperform the broader markets relatively.
The IT and the FMCG Indices are inside the improving quadrant; however, the IT Index is seen slowing down on its relative momentum against the broader markets.
Important Note: RRG™ charts show the relative strength and momentum of a group of stocks. In the above chart, they show relative performance against NIFTY500 Index (Broader Markets) and should not be used directly as buy or sell signals.
Milan Vaishnav, CMT, MSTA
Consulting Technical Analyst
www.EquityResearch.asia | www.ChartWizard.ae


