Peace on Earth, Stability in Bonds? Watch These 3 Charts for Fixed Income in 2026

Key Takeaways
- Bond volatility has gone quiet, but key yield and credit signals matter more than ever
- Treasury yields, the yen, and credit spreads may shape fixed-income returns in 2026
- Asset allocation, not headlines, will likely drive portfolio outcomes in the year ahead
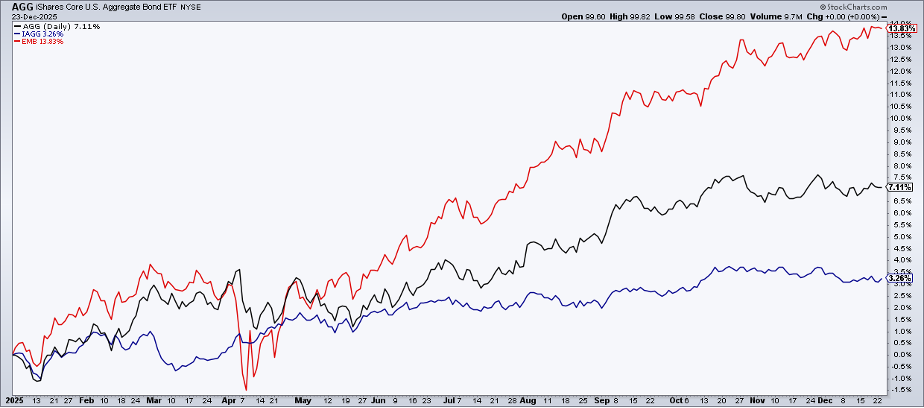
All is calm, all is bright in the Treasury market. The ICE MOVE Index printed a fresh multi-year low ahead of Christmas, just as the iShares Core U.S. Aggregate Bond ETF (AGG) puts the finishing touches on potentially its best year since 2020.
Indeed, diversified investors have been rewarded in 2025, both in the equity space (U.S. and ex-U.S.) and in fixed income. Sprinkle in some precious metals exposure and returns have been generally jolly.
But what does next year have in store for the bond market, specifically?
Policy Questions That Refuse to Go Away
We can pontificate about the Fed: Will Stephen Miran remain a voting member after the January 28 interest rate decision? Will President Trump keep his word regarding nominating the next Fed chair in the first couple of weeks of 2026? Is Jay Powell now a lame duck, having submitted his final cutting vote? Furthermore, will there be a series of eases over the back half of next year with a Trump loyalist at the FOMC’s helm? Are we in a new era in which Fed dissenting votes are commonplace?
Credit Spreads: Too Calm for Comfort?
And what about the corporate credit space? Will both investment-grade and high-yield spreads remain near cycle tights? Given the supply deluge caused by debt-financed AI investment, will bond vigilantes cast their ire at U.S. corporations (and not just Treasuries)? And what if the torrid pace of M&A deals causes a paper jam on Wall Street?
The Global Angle Investors Can’t Ignore
All the while, those same winning diversified investors have enjoyed ample returns in emerging-market bonds. Can that keep up? Speaking of overseas, developed sovereigns could be the biggest fixed-income risk of all. Intermediate- and long-dated yields may not be going parabolic, but the clear stair-step higher has many macro strategists wondering when the Jenga tower will give way.
Japan, Australia, Germany, France, the UK — all of those developed economies’ borrowing rates are steeply higher than they were just 12 months ago.
The Portfolio Question That Trumps Them All
For global investors and cross-asset traders alike, here’s the most important question: How will you allocate in 2026?
There’s nuance, of course. Each market participant has their own time horizon. What’s more, investors may opt for a set-it-and-forget-it approach, while traders may move in and out based on technical indicators and intermarket trends. Still, allocators of all experience levels know that asset allocation determines a majority of a portfolio’s return.
Let’s investigate a few of the most critical charts related to the bond market.
The Yield That Still Sets the Tone
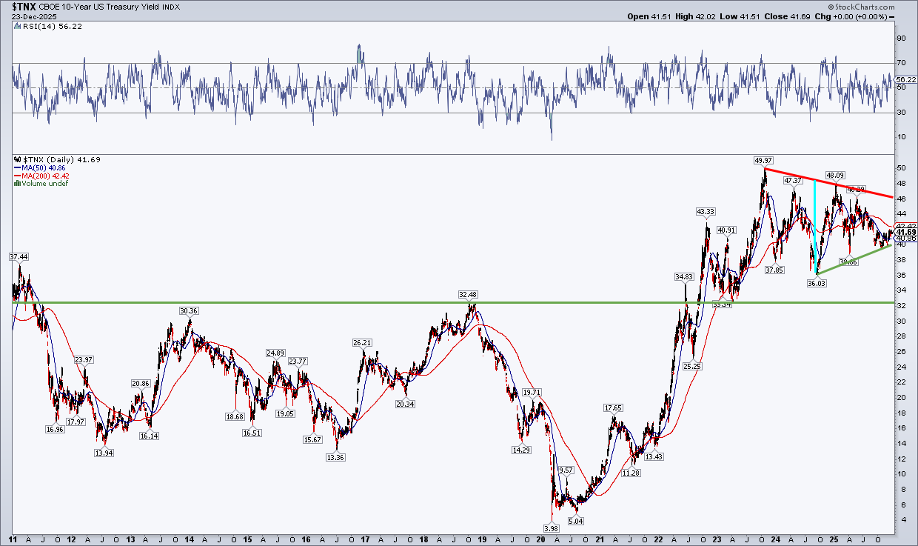
Leading off is the benchmark 10-year Treasury note rate. Amid so much macro noise and a heavy focus on the Fed, TNX has largely consolidated since notching a decade-plus high in October 2023, a whisker shy of 5%. It hasn’t been a perfect triangle or coil pattern, but a broad series of lower highs and higher lows has lulled bond traders to sleep (recall that chart of the MOVE Index near 60).
We know that the mid-4s represent the lower end of the “danger zone” for the S&P 500, and a rally through — call it — 4.6% could trigger an upside breakout. Based on the height of the triangle, a measured-move target toward roughly 5.8% would be in play.
A breakdown, however, would point to a fall toward 2.8%, below the range highs from the 2010s ZIRP era. More immediate support sits in the 3.2% to 3.35% zone. For now, the 10-year yield remains below its flat-to-falling 200-day moving average as the new year nears.
Why the Yen Might Matter More Than You Think
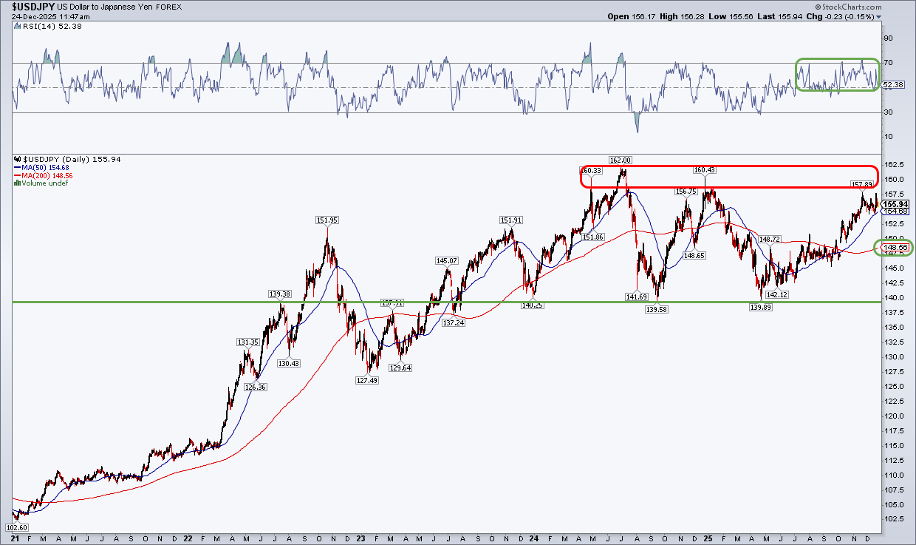
Next up is USDJPY. Not directly a fixed-income view, but I’d argue the yen may determine where global yields go in 2026. A curious trend has emerged in recent months, as the yen has declined in value even as Japanese interest rates have climbed. Typically, we’d expect the opposite. This is more like emerging-market price action.
Notice in the chart below that $USDJPY has clear resistance in the 158 to 162 zone. A breakout could send the yen cratering beyond 180. That outcome is increasingly plausible, given a bullish RSI range and a 200-day moving average that has turned upward. Yen weakness tends to coincide with rising global interest rates.
A Simple Dashboard Worth Bookmarking
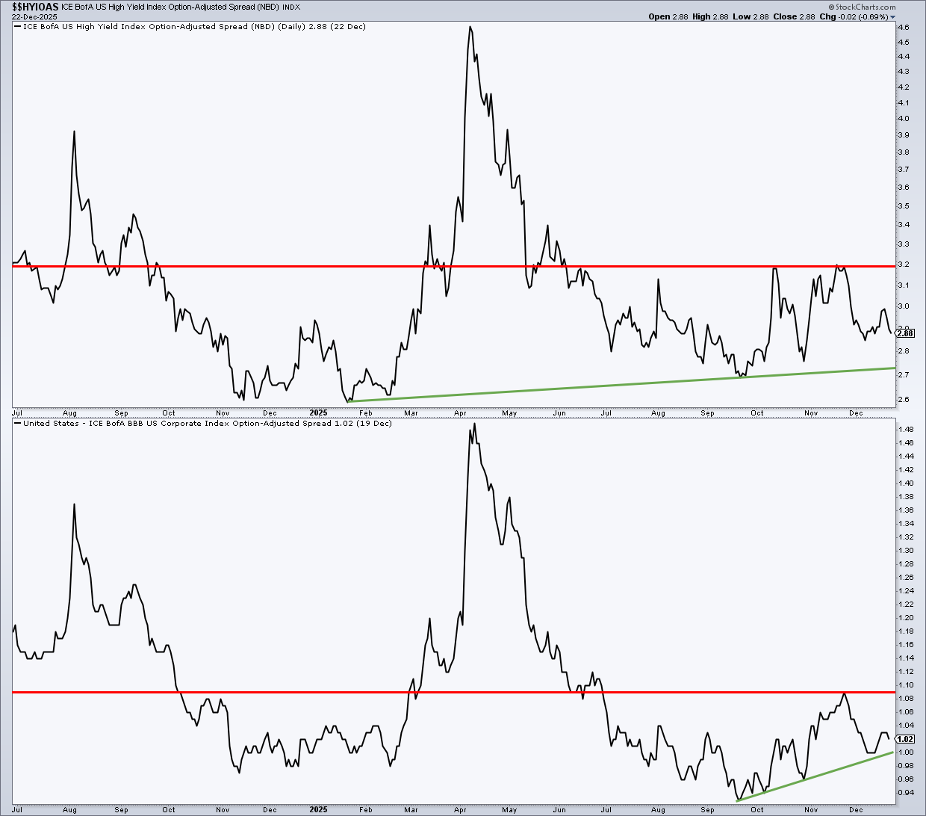
Finally, let me guide you to one of my go-to pages on StockCharts. Under Market Analysis, select Market Summary and, from there, scroll down to “Bonds.” You’ll see the current Treasury rate backdrop, which is useful, but I’m homing in on the “Fixed Income/Credit Spreads” section. On the right, you’ll find the corporate credit spread chart.
Yield premiums for corporates are modest, but they are off the lows — not confirming the S&P 500’s all-time high. High yield’s bogey is 3.2 percentage points, while investment grade’s pivot point is 109 basis points. Bookmark this page and reference it periodically as you adjust your macro exposure in the year ahead.
The Bottom Line
Asset allocation matters more than most investors like to believe. Global bonds are telling many stories right now, some more dramatic than warranted. In reality, U.S. and international aggregate bond index ETFs have delivered respectable returns in 2025. It's uncertain how 2026 plays out, but several key price, yield, and even currency levels are likely to shape returns over the next 12 months. Watch them — and be prepared to act.
Disclaimer: This blog is for educational purposes only and should not be construed as financial advice. The ideas and strategies should never be used without first assessing your own personal and financial situation, or without consulting a financial professional.


