Professional Money Managers Are Reducing Risk — Should You?
Beneath this week's market jitters, a subtle but meaningful shift is taking place.
It was another week where headlines, above all, drove the stock market. We had stories about AI disrupting software jobs, rising geopolitical tensions, and whispers of credit problems in the private credit space. Put all that together, and it’s no surprise investors felt a little uneasy or indecisive.
At some point in the week, it looked like money might rotate back into tech stocks, with many investors hoping NVIDIA’s earnings beat would put those stocks back in favor. Alas, that didn’t happen. The week, and with it the month, ended on a note more cautious than confident.
Let’s look at where the major indexes finished out this February.
- S&P 500 ($SPX): 6878.88 (-0.87%)
- Nasdaq Composite ($COMPQ): 22,668.21 (-3.38%)
- Dow Jones Industrial Average ($INDU): 48,977.92 (+0.17%)
The tech-heavy Nasdaq was the weakest performer for the month. The Dow, which is made up of established, dividend-paying stocks, was the strongest.
What this suggests is that investors may be rotating away from large-cap growth stocks, especially in the technology space, and toward more defensive areas of the market. In addition, we're seeing interest in precious metals, another sign that investors are seeking safety.
This is a shift that investors shouldn’t ignore.
Why This Matters for Investors
Risk management is an important component in investing, yet individual investors don’t pay enough attention to it. Active money managers, on the other hand, understand risk management. Their positioning reveals an interesting point.
The NAIIM Exposure Index, which tracks how actively managed portfolios are allocated to equities, is at 74.93 this week. What’s more important in the chart below is that equity exposure has been steadily declining this year.
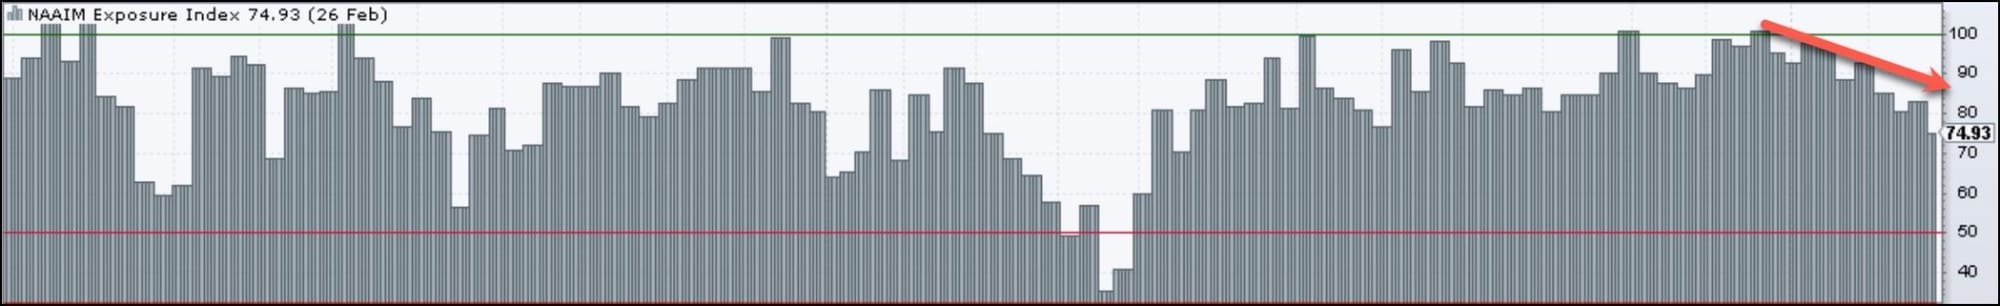
You can track this yourself on StockCharts.
Now look at what individual investors are doing. The AAII Bulls - Bears sentiment indicator shows that investors are 33.2% bullish and 39.8% bearish. This shows that bearishness is beginning to edge out bullishness.
Earlier last year (January and May 2025), investors were much more bearish than bullish. During that stretch, the S&P 500 dipped below its 40-week Simple Moving Average hitting a low in April. That was around the time when tariffs were implemented.
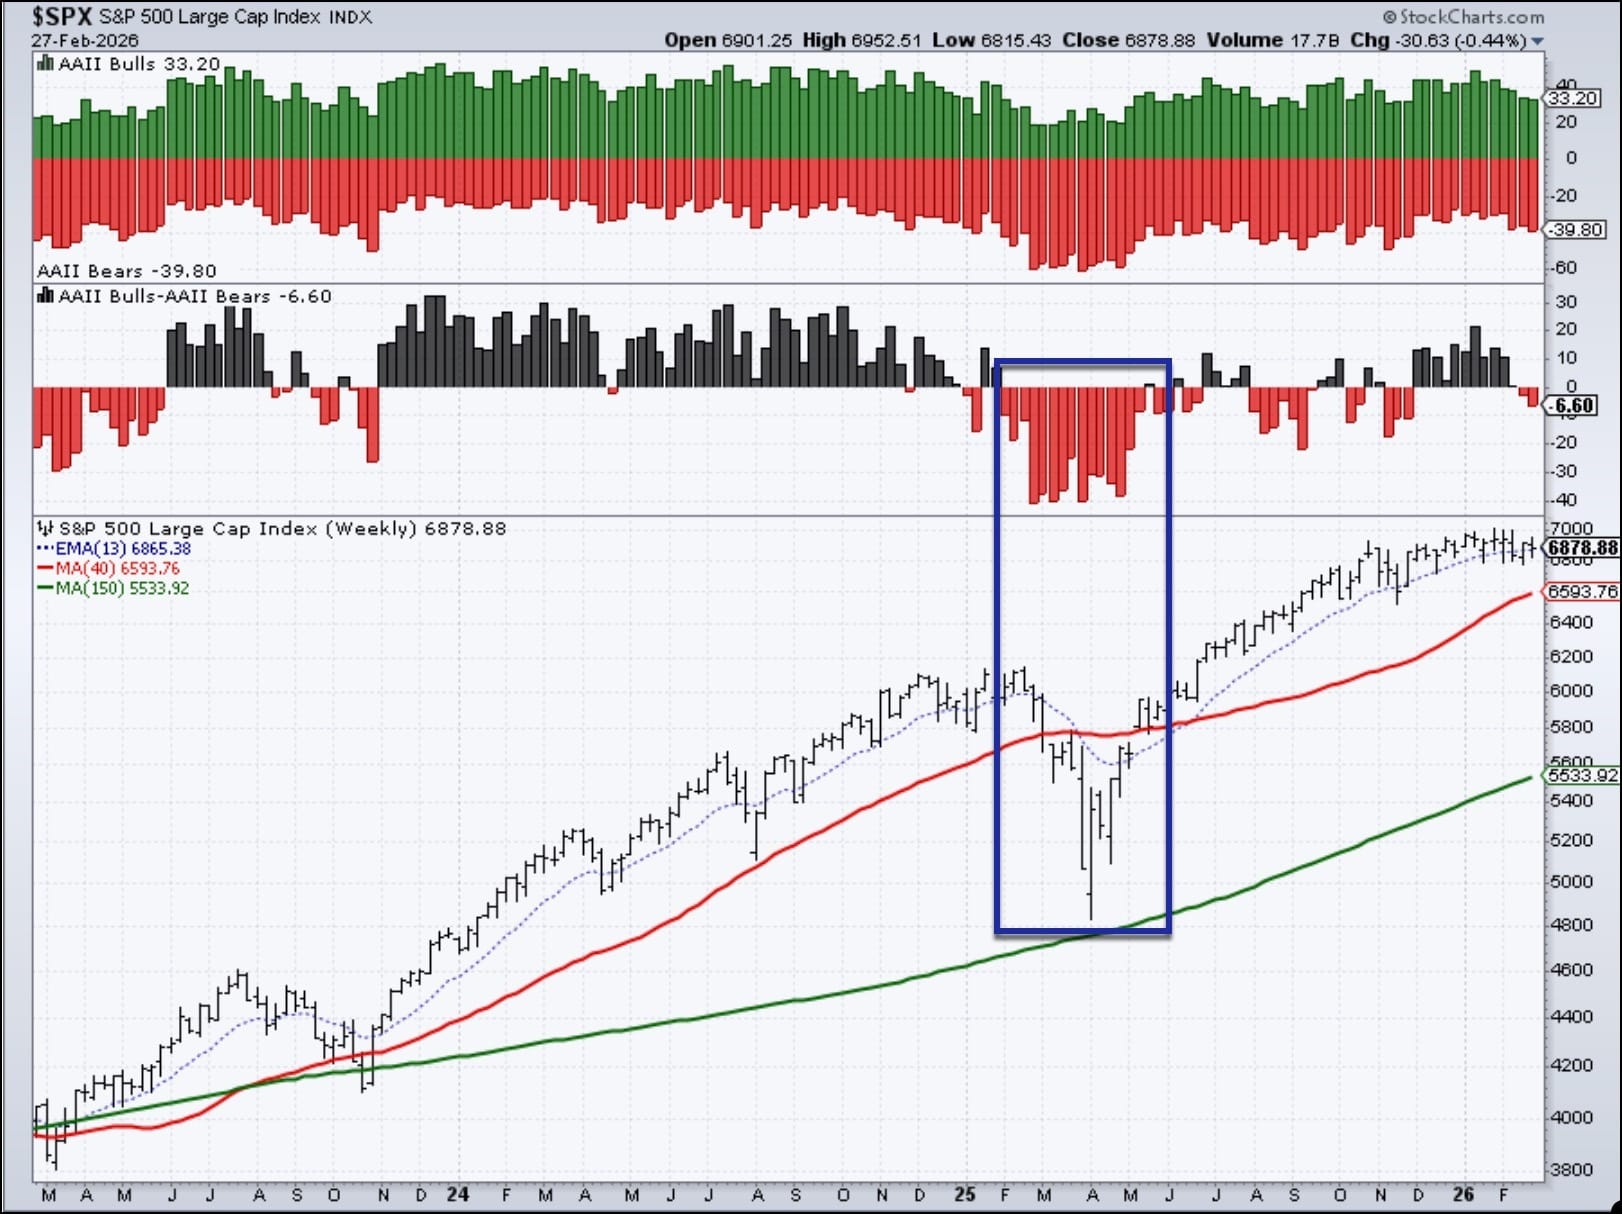
So, looking at sentiment, we’re not seeing a major red flag, but we are seeing early caution signals. As we head into March, stay even more alert to these sentiment indicators, as they could give an early indication.
Have a calm and peaceful weekend!