Q2 Outlook: Intermarket Trends Investors Should Watch

Key Takeaways
- Stocks opened the second quarter with gains, but underlying intermarket signals remain mixed and fragile, and the VIX is still elevated.
- Bonds, commodities, and the U.S. dollar provide key context for where equities may head next.
- Critical technical levels and cross-asset trends could shape the market’s next sustained move, with key macro catalysts on tap.
Stocks are up so far this month, and that’s no April Fool’s joke. The S&P 500 ($SPX) is coming off back-to-back monthly declines, mirroring U.S. large caps’ start to 2025. History isn't repeating itself, but there are rhymes from a year ago. Substitute geopolitical tensions with trade-war jitters, and price action is similar so far YTD.
So what does this mean for your investments as we enter Q2?
Bearish Pattern Lingers Beneath the Surface
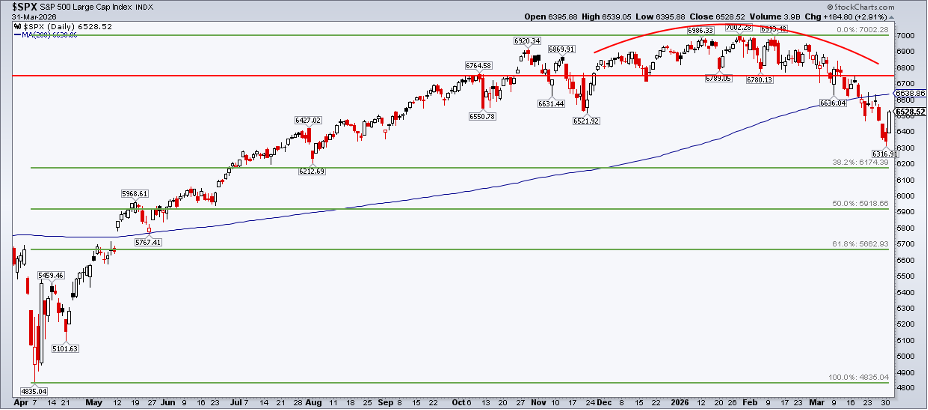
When you dig deeper, intermarket trends may offer clues on where asset classes go from here. First, and just as a refresher, the S&P 500’s bearish rounded-top pattern remains in play. However, at this point, it's more of a historical indicator. The bears have grabbed control of the primary trend, particularly after 6780 was cut through.
Today, the 38.2% Fibonacci retracement of the April 2025 to January 2026 rally at 6174 is still in play. The rising 200-day moving average is back within shouting distance compared to the March 31 close and the continued April Fool’s Day rally. But with a still-stubborn VIX in the mid-20s, conditions can change quickly, so it’s crucial to monitor price action.
Do Treasurys Hold the Key to the Intermarket Puzzle?
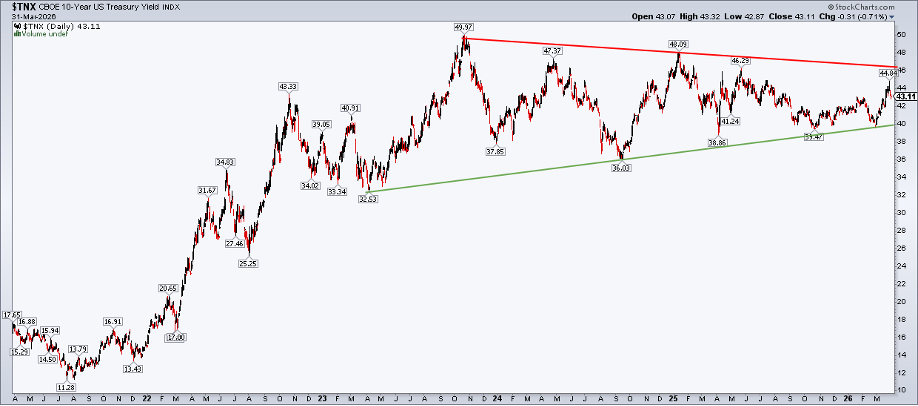
Now that we know the stock standpoint, we'll move to fixed income. Actually, traditional intermarket analysis begins with bonds, namely, the benchmark 10-year Treasury rate. Here, we find that not much has changed. A symmetrical triangle consolidation pattern holds firm, with support now close to the 4% level, while a downtrend resistance line enters the scene just above 4.6%.
Yields climbed dramatically as oil prices scaled $100, but Treasury buyers took the 10-year from 4.484% last week to below 4.3% to kick off April. Not shown are the 50-day and 200-day moving averages, as they crisscross each other near 4.2% (no signal to be gained there).
Commodities Stay Firm as Oil Wobbles Near $100
Ask a person on the street; they’ll have no qualms about sharing their feelings on commodities. Though WTI crude oil slipped below $100 per barrel on the first day of the second quarter, retail gasoline prices inched higher to $4.06, according to AAA.
The 86-cent YoY increase is widely expected to dampen consumer spending and take a toll on sentiment. So far, both are holding up, as measured by the recent University of Michigan Surveys of Consumers report and the latest Johnson Redbook retail sales update.
Zooming in on DBC: A Bullish Pause in the Commodity Complex
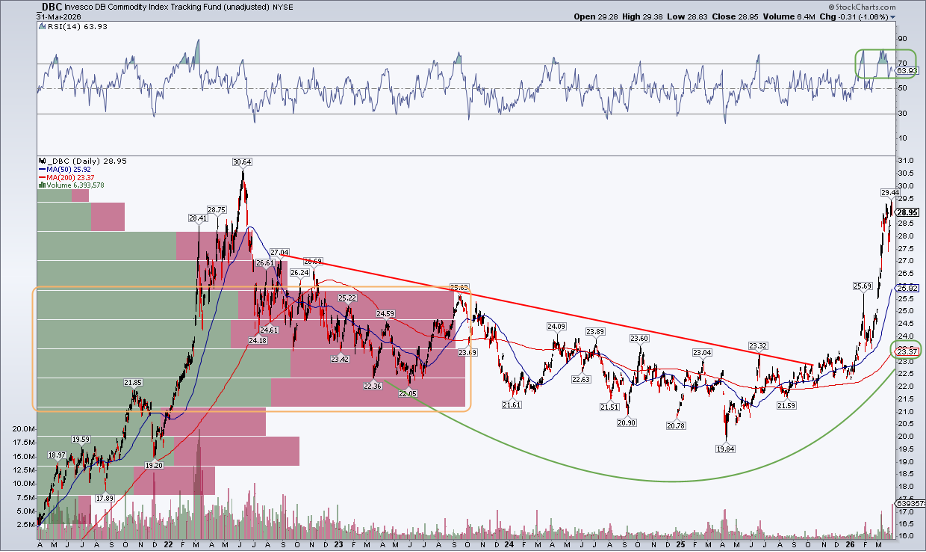
As for the charts, we at StockCharts often look at the big commodities picture through the Invesco DB Commodity Index Tracking Fund (DBC). It’s high and tight, and a thing of beauty. Notice in the chart below that the ETF hovers near its best level since the middle of 2022 (the last time gas prices were above $4/gallon).
Price action has been whippy at times over the past month, but the last few weeks appear as a pause in the trend of higher degree. That thesis is buttressed by the 50-day and 200-day moving averages, which are on the rise, along with a bullish RSI momentum oscillator at the top of the chart (ranging between 50 and 90).
Energy Prices Remain the Macro Wild Card
The “energies” play a leading role in DBC’s performance. So, through a macro lens, the resolution of the war in Iran is the X-factor. As technicians, we care little about the news. Instead, I’m watching $27.50 on DBC, as that was the swing low in late March.
A breach of that level would portend a potential gap fill near $25. Congestion support is seen near $23 on the chart above and, with a high amount of volume by price starting near $26, there should be ample buying pressure if we see a Q2 pullback.
Dollar Flirts with a False Breakout
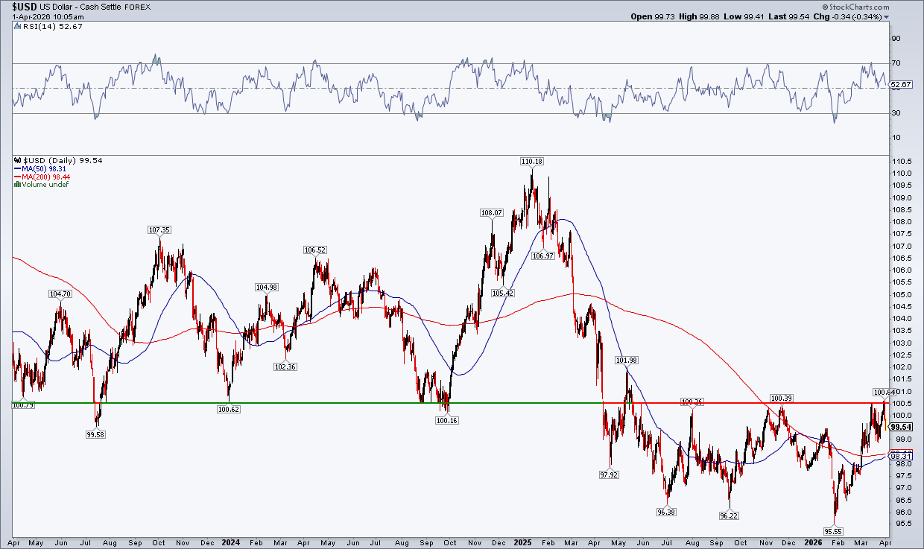
Intermarket analysis is the study of stocks, bonds, commodities, and currencies. Speaking of the dollar, it’s on full-blown false-breakout watch. The 100.50 level on the U.S. Dollar Index ($USD) was briefly breached as the first quarter drew to a close. Ahead of key March employment data, the greenback has declined.
They say from false moves come fast moves in the opposite direction, and while that can happen, I’m not overly bearish here. Why? Consider that the 50-day and 200-day moving averages are upwardly sloped, suggesting that the bulls control the short- and long-term trends. The RSI looks fine, and the dollar is back in its range from the past year. My take? Choppy price action may persist.
Monitoring the Full Intermarket Picture
You can view all of the key intermarket indexes and ratios using the StockCharts Market Summary page. Scroll down to the intermarket section to access Intermarket RRG charts, the CandleGlance view, and full technical looks at asset-class ETFs.
The Bottom Line
Turnaround Tuesday prevailed in a big way on the final day of March. Stocks and bonds rallied, while commodities cooled and the dollar backed away from resistance. Last month, oil was just about the only asset that worked, but that can’t last. Traders must monitor intermarket trends for early clues on what new correlations may emerge heading into what has been a bullish period for equities in recent years.
Disclaimer: This blog is for educational purposes only and should not be construed as financial advice. The ideas and strategies should never be used without first assessing your own personal and financial situation, or without consulting a financial professional.


