Retail Stocks to Watch as Consumer Sentiment Collapses: Walmart, Target, and Home Depot

Key Takeaways
- Last Friday’s UMich survey was among the bleakest on record, but watch what consumers do, not what they say.
- Key Q3 retail earnings reports are on tap ahead of what’s expected to be a record holiday-shopping season.
- Consumer-related stock charts paint a complicated retail picture.
While NVIDIA (NVDA) reports on the 19th, the final 10% of the S&P 500 earnings season typically focuses on the consumer. Perhaps more critical than ever in this cycle, household financial health is in focus.
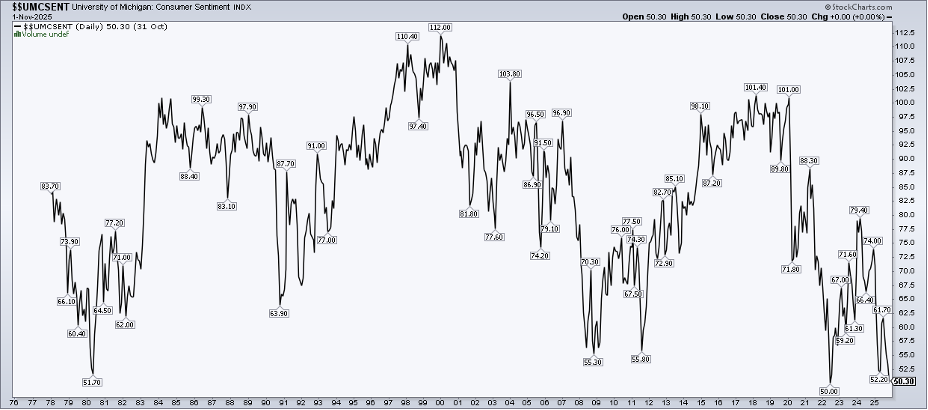
Last Friday’s University of Michigan Consumer Sentiment survey revealed the second-lowest reading on record. The Expectations subindex had its worst print in history, a poll that goes back to the 1970s.
Tariff Dividends and 50-Year Mortgages?
Then, over the weekend, President Trump and Treasury Secretary Scott Bessent floated a couple of ideas that made headlines. A $2,000 per taxpayer “tariff dividend” drew attention, while extending conventional 30-year fixed-rate mortgages out to 50 years raised eyebrows. Political optics aside, it’s clear that the White House is closely watching Main Street vibes.
Holiday Spending Push
And why shouldn’t they? We are hurtling headlong into the holiday shopping season. The National Retail Federation expects total spending in November and December to top $1 trillion for the first time, which would be about a 4% increase from last year’s sum.
As always, watch what people do, not what they say—and the same goes for retail companies and their executive teams.
Retail Earnings Heat Up
Third-quarter reports begin rolling in on Tuesday next week. That's when Home Depot (HD) lays the foundation for a spate of consumer-company updates. Keep in mind that the retail industry broadly operates on a different reporting calendar, with fiscal Q3 ending on or near Halloween. So, these will be very timely consumer clues.
What’s more, given the downright dismal sentiment across the wealth and political spectrum, investors will soon find out if anger translates into softer actual demand. If history is a guide, it won’t.
Restaurant Reversal
Last week, I cast the spotlight on restaurant stocks. While there have been a few winners in the dining-out space, it’s clear that there has been a pullback. Those on the lower end of the wealth spectrum, along with younger cohorts, might be brown-bagging it versus forking over $15 for a lunch salad or burrito. All the while, upper-income parents aren’t batting an eyelash about dropping $30-plus for a family dinner from McDonald’s (MCD).
Reading Retail Tea Leaves
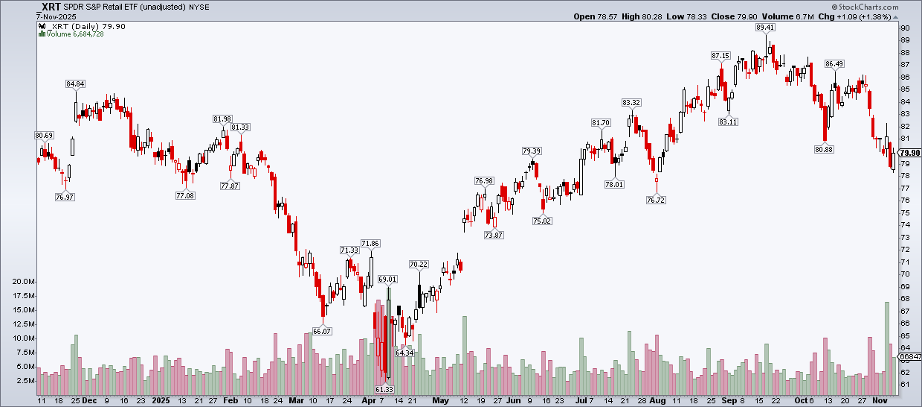
Now let’s see what’s going on with the big retail players. It’s important to point out that the popular SPDR S&P Retail ETF (XRT) is an equal-weight product, so it tilts toward small- and mid-cap Consumer Discretionary stocks. It's helpful to gauge its trends, for sure, but scanning individual larger retail charts sometimes tells the truer consumption story.
Walmart: Quiet Big-Box Strength
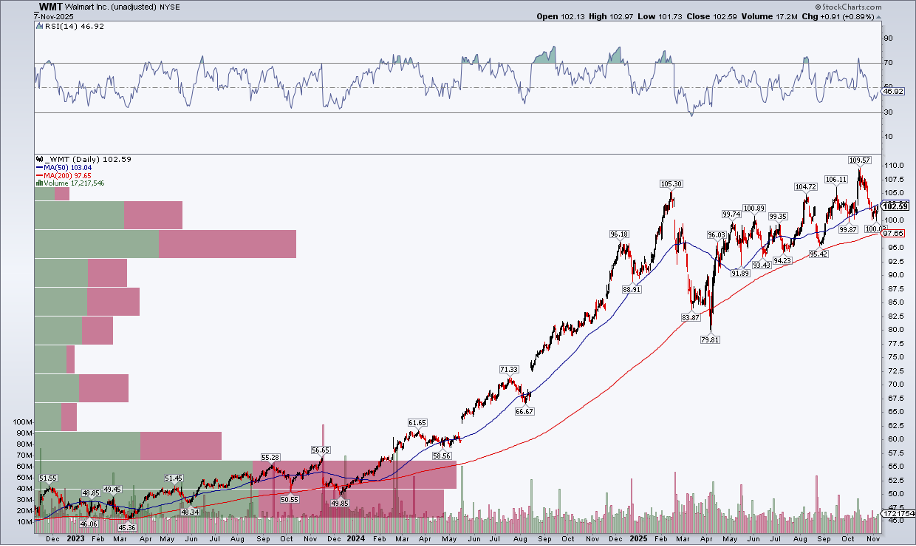
As XRT aims to recover from touching technical-correction territory, Walmart (WMT) has been stair-stepping higher ever since its April snapback.
Notice in the chart below that shares have straddled the short-term 50-day moving average, while the long-term 200-DMA hasn’t been visited since early Q2. I also like that the RSI momentum oscillator at the top of the chart has been in a generally bullish range between 40 and 80 for much of this year. Furthermore, I applied the "volume-by-price” indicator on the left, and it augurs for continued sideways to slightly higher price action — there's quite a bit of congestion (shares traded) from $90 to $105.
If the stock rallies into and after the Q3 report on November 20, a solid area of support should be cemented.
Target: Not on Point
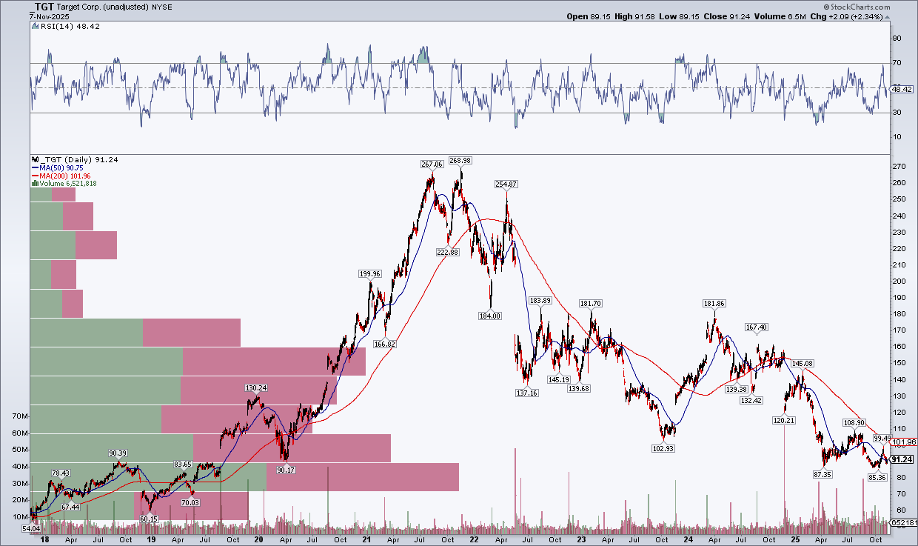
Turning to Target (TGT), this chart is a hot mess, and a bearish one at that. While the S&P 500 progresses through Year 4 of its bull market, shares of the Minnesota-based retailer are near six-year lows. Store associates may be smiling this holiday season, but shareholders are not.
While Target is among the most well-known household names, it has little impact on the indexes. The market cap is now a mere $42 billion. For perspective, Walmart is 20 times its size. Retailer TJX Cos. (TJX) is almost four times larger than Target. So, for macro traders, don’t take too much signal from how the stock reacts after its November 19 earnings.
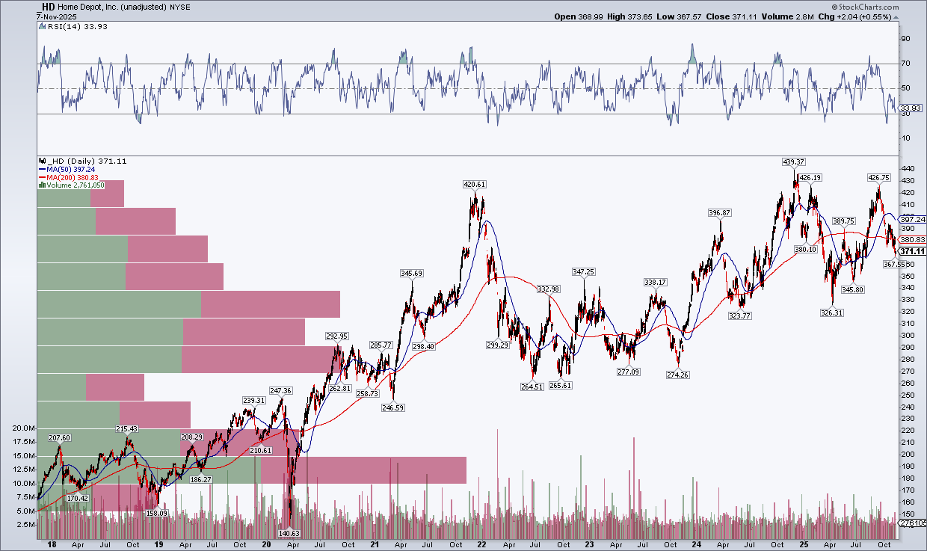
Home Depot: Wandering the Aisles
The last look at retail is the lead-off man: Home Depot (HD). HD’s chart is not as strong as WMT’s, but not as weak as TGT’s. The Home Improvement Retailers industry company within the Consumer Discretionary sector has matched the S&P 500 SPDR ETF (SPY) over the last 10 years, but its alpha peaked in 2021, when consumers were flush with cash and interest rates were near historic lows.
Today, with mortgage rates holding above 6% and caution being the word for all but the top quartile of wage earners, HD has given back 10% from its September high. Long-term resistance is in play between $420 and $440, and its 200-DMA is flat to trending lower. That’s not the ideal setup ahead of Q3 numbers.
The Bottom Line
The consumer is not a monolith, nor is the retail sector. The XRT ETF has stumbled after a mid-year ascent, and trepidation is evident not only in survey data but also in stock charts. Tariffs, potential stimulus checks, mortgage revamps, a new tax bill, and changes to the ACA marketplace—among other macro worries—paint an uncertain backdrop as holiday spending takes flight. Price trends in the major consumer stocks will likely be the first tell as to how it all shakes out.
Disclaimer: This blog is for educational purposes only and should not be construed as financial advice. The ideas and strategies should never be used without first assessing your own personal and financial situation, or without consulting a financial professional.


