The Santa Setup: What December Intermarket Price Action Might Look Like

Key Takeaways
- Stocks dipped to begin the year’s final month, and historical patterns point to strength leading into Christmas
- A dollar breakdown and yield jump could be the start of something bigger
- Consumer resilience and AI divergence are in the spotlight
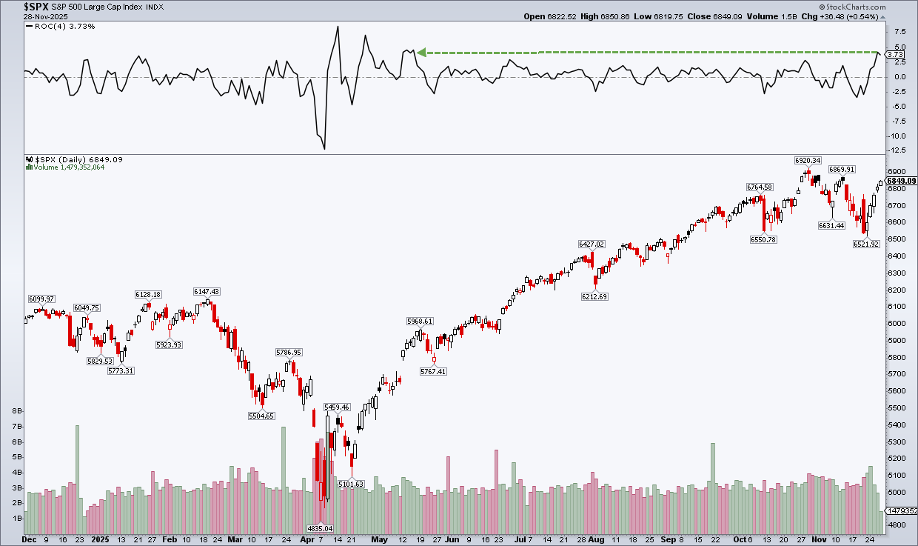
Stocks begin December on their back foot, but losses on the first of the month are not dramatic. Perhaps it’s a bit of a holiday-week hangover, considering that the S&P 500 notched its best four-day rally since May over the low-volume, data-light stretch to close out November.
Equities fought their way back from significant losses, capped by a dreadful reaction to NVIDIA (NVDA) earnings on the 19th of last month. New York Fed President John Williams effectively came to the rescue the following Friday, reassuring traders that a December rate cut was still a real possibility.
S&P 500: +3.7% Over Thanksgiving Week, Best Rally Since May
A Frosty Start to December Trading
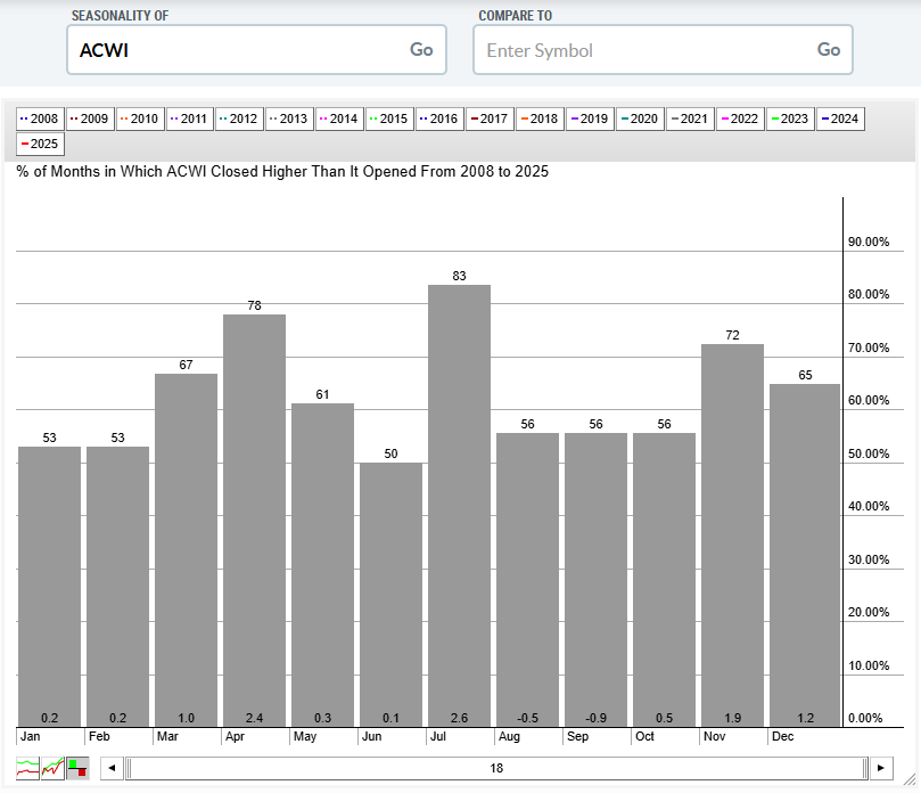
December has historically been a bullish month for global stocks, with the iShares MSCI ACWI ETF (ACWI) rising an average of 1.2% since 2008. Up about two-thirds of the time, gains are often back-half loaded, though.
The first two weeks of the year’s final month are notoriously riddled with volatility and choppy price action. And while the vaunted Santa Claus Rally period doesn't begin until December 24 this year, holiday cheer often reaches Wall Street by December 15.
ACWI ETF: Bullish Year-End Trends
As we put the finishing touches on what has been a banner year for diversified investors, let’s check in on the key macro charts and intermarket relationships that may offer hints at what lies in store over 2025’s final month.
Checking the Intermarket List (Twice): Dollar Trends to Watch
Jumping out on my radar continues to be the US Dollar Index (USD). There have been important developments just in the last few trading sessions. Notice in the chart below that the greennback has sported red after approaching noted resistance near the 100.50 mark. The dollar has fallen below an uptrend support line dating back to mid-September.
Dollar Backs Away from Resistance
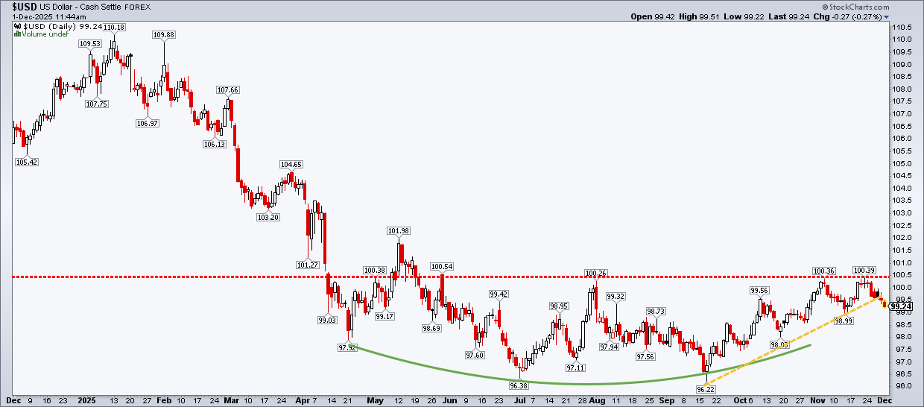
But a softer buck is not a sign to go all-in on risk assets. We don’t have to go back far to find when a lower dollar corresponded to higher Treasury yields and, hence, weaker stocks. A clear winner if we see the USD test the July and September double-bottom just above 96 would likely be precious metals.
Indeed, gold scaled the $4245 per troy ounce November peak to notch a fresh rebound high on Monday. Silver, meanwhile, is a precise double year-to-date, now above $58 per ounce.
Treasury Yields by the Fireside: Will the Fed Deliver an Early Gift?
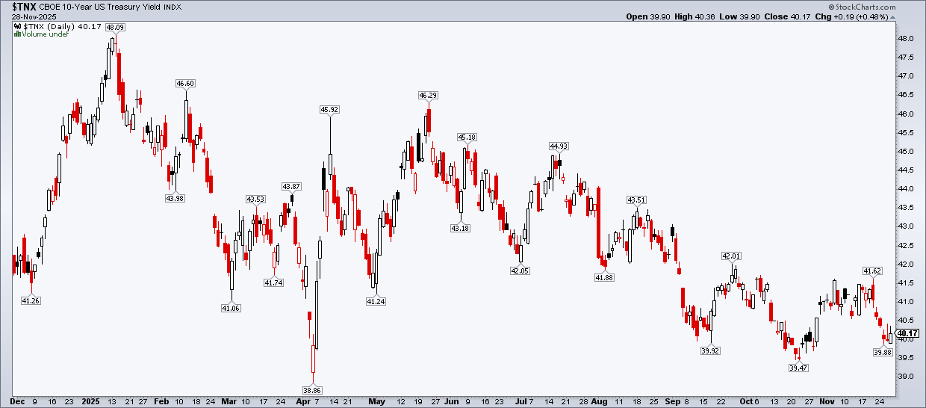
In fixed income, Treasury yields bear watching. The data spigot is (slowly) being turned to the left, and we’ll get a few key (and timely) labor market data points this week. A December Fed rate cut is not a foregone conclusion, but it’s now very close to it.
So, strong jobs numbers could lift interest rates. We’ll get PCE inflation data later this week, then CPI, Retail Sales, and the official nonfarm payrolls print mid-month. A special present (or lump of coal) should arrive by Christmas — the announcement of the next potential Fed chair.
Tariffs, Courts, and the Ghost of Volatility Future
The ultimate bond-market volatility catalyst might not come until early 2026, when the Supreme Court rules on President Trump’s tariffs. If the High Court strikes them down, that would probably pressure yields higher.
For stocks, a one-time refund is obviously great news, but debt-burdened firms could face longer-term pressure from the rate impact. Moreover, we can’t discount the impact of international yields — Japan's 10-year rate notched its loftiest level since 2008 to kick off December.
US 10-Year Yield Steady, Hovers Just Above 4%
Santa’s Macro Workshop: AI and the Consumer
December is also a natural time to refocus on the macro. The Q3 earnings season is largely over (though several high-profile names report this week), and Wall Street strategists are giving color to their 2026 forecasts. A linchpin to many of those bulky PDFs is AI and the consumer.
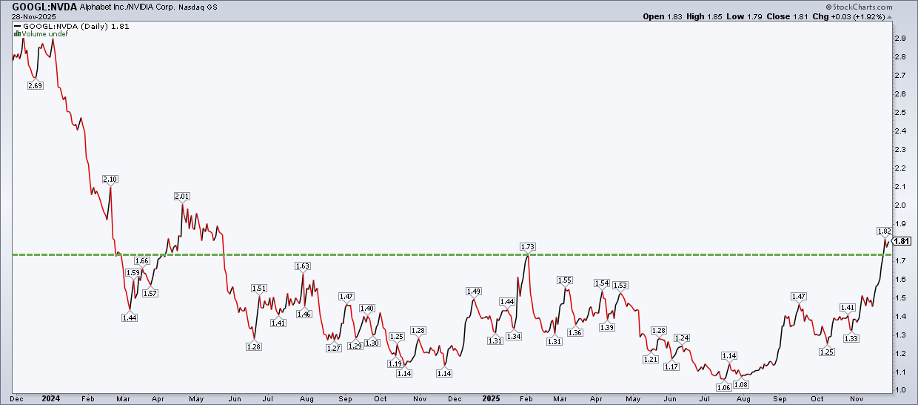
For the former, it’s clear that the megatrend is no longer a monolith. There are winners and recent losers. Oracle (ORCL) price action resembles that of Cisco (CSCO) in the late ’90s and 2000, while Alphabet (GOOGL) could surpass NVDA for the crown of the most valuable company if November’s trend persists through year-end. I’d encourage traders to take advantage of StockCharts’ relative strength tools, including simply pitting one stock against another, as seen in the chart of GOOGL:NVDA below.
GOOGL vs. NVDA: Highest Since May 2024
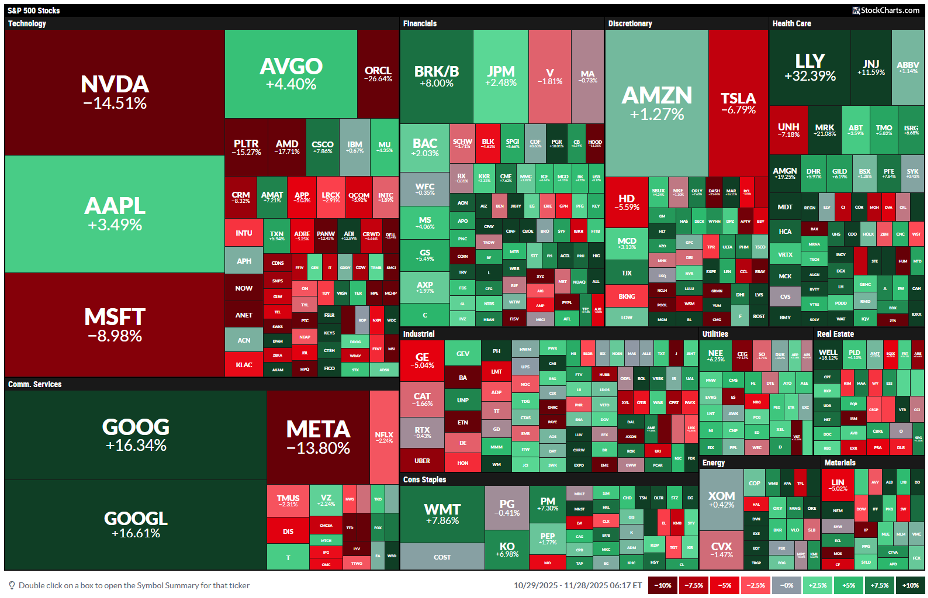
1-Month S&P 500 Performance Heat Map: GOOGL +17%, NVDA –15%
Retailers Ring the Seasonal Bells
For the latter, household spending is strong by most accounts. Retailers appear to have scored massive sales over the five-day holiday period ending Sunday. I’ll be on the lookout for Cyber Monday totals.
Whether folks are shopping cheerfully, rage-spending, or if it’s merely the upper dash of the K-shaped economy keeping things afloat, it may not matter. For now, the broad consumer is surprisingly resilient... and that almost always keeps GDP growth humming along.
VIX: The Grinch or the Nutcracker?
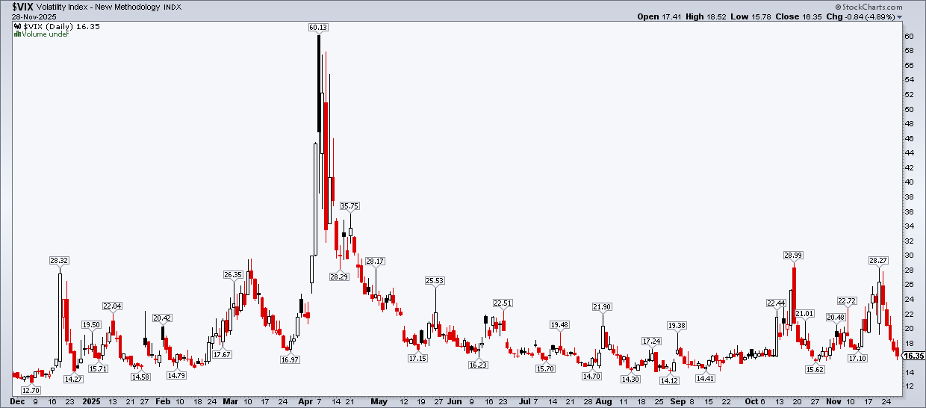
Finally, the Cboe Volatility Index (VIX) bears some window shopping. It fell under 17 on Black Friday after briefly scaling 28 before Williams’ dovish remarks the previous Friday.
Mechanically, the VIX only measures implied volatility going out 30 calendar days, so it’s natural to see it cool off this time of year. Come mid-month, however, if it were to rise back into the mid-20s, that would be a bearish cue for the upcoming year.
VIX Plunged in Late November, Watch for Higher Trends Later in December
The Bottom Line
Stocks hit the skids to begin December, but just a minor buy-the-dip burst would send equities back into the black. As pundits opine on upcoming labor market data, robust recent retail reads, and the high chance of a Fed rate cut, paying attention to price action is probably the most revealing tack. Be on guard for potential up-and-down trends through mid-month before Christmas vibes take root later in December.
Disclaimer: This blog is for educational purposes only and should not be construed as financial advice. The ideas and strategies should never be used without first assessing your own personal and financial situation, or without consulting a financial professional.


