Financials and Industrials Are Key to the Rally as Tech Takes a Breather

Key Takeaways
- There’s rotation under the market’s surface, just as bearish calendar trends take root.
- Three S&P 500 support spots in particular are worth monitoring.
- Financials and Industrials have lost relative steam, and it’s time for them to step up.
On Tuesday, the Nasdaq 100 Index ($NDX) suffered its worst day since the July jobs report hit the tape on August 1. The dip came amid significant rotation under the market’s surface, as the NYSE Advance-Decline Issues Index was 346 to the good side. Eight of the 11 S&P 500 sector ETFs were up, while only the Communication Services and Information Technology sector funds were lower among the S&P SmallCap 600 Index.
Making Sense of the Market
There’s clearly internal moving and shaking going on ahead of Fed Chair Powell’s Friday speech at the Jackson Hole monetary policy summit. It’s also sort of an awkward time of the year, now that the reporting period is about done. Yes, retailer earnings reports are coming in fast, but we have a good grip on the Q2 corporate profit picture. NVIDIA Corp. (NVDA) issues numbers next Wednesday night, but, with the AI hyperscalers’ second-quarter capex numbers in hand, there shouldn’t be many surprises when Jensen Huang’s company reports.
At times like this, traders should lean on technical clues offered by the market. One controversial indicator is the RSI oscillator, which gauges a security's momentum by comparing recent closing prices to the trend of historical settles. Admittedly, bears will commonly tout charts comparable to the one I showcase below: a price trend with higher highs and higher lows, but an RSI oscillator printing a lower high. Quite often, though, the bulls get back on their feet, taking price to a new high, thus negating the possible divergence.
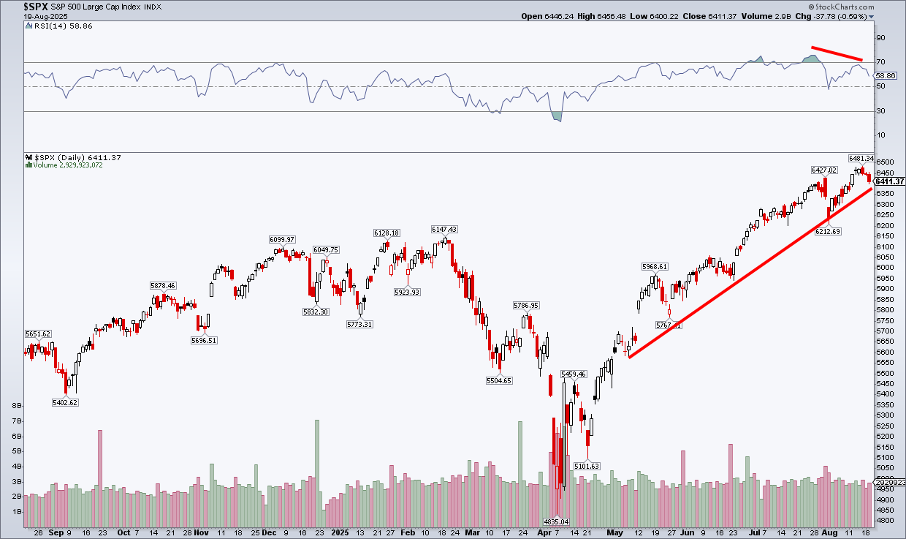
In technical analysis, it’s believed that momentum turns before price. Much like throwing a ball in the air, momentum slows before price begins falling. For the S&P 500, the risk is that the bearish divergence is a harbinger of lower prices, which would align with notoriously weak seasonal trends now through early October. Recall that stocks fell over the tail end of Q3 in 2022 and 2023, and, even last year, there was an end-of-summer swoon that offered a buy-the-dip opportunity shortly after Labor Day.
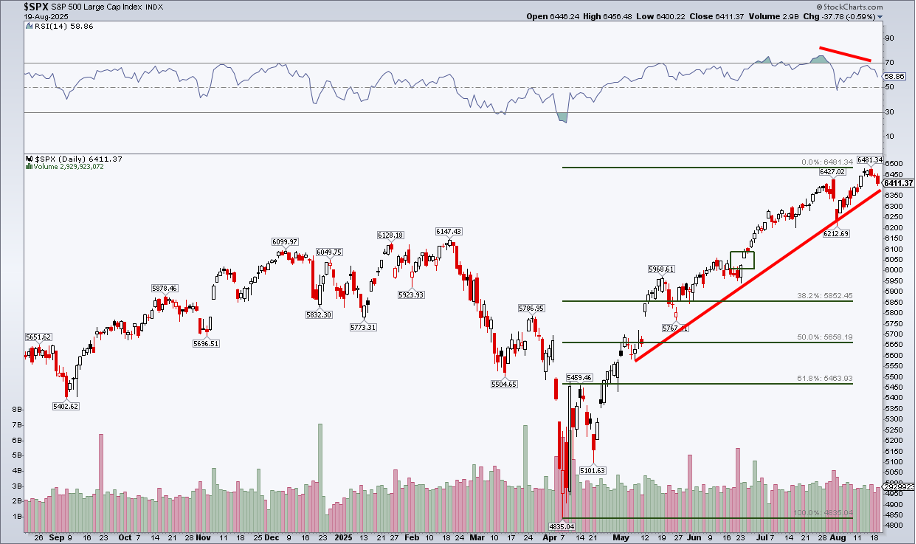
If we do see a pullback, where might be the spot to step back in? There are a few price points to keep an eye on.
First, the August 1 SPX low comes into play at 6212. A breakdown under that level would likely mark the end of the post-Liberation Day rally (as it would be a technical lower low). Next, a gap lingers at 6025, from June 24. Third, if this week’s 6481 peak marks a near-term high, then the 38.2% Fibonacci retracement of the April 7 bottom to the August 15 peak lands at 5852.
Interestingly, a textbook 10% correction implies a decline to 5833, which is very close to the “Fibo” target.
A Seasonal and Historical Perspective
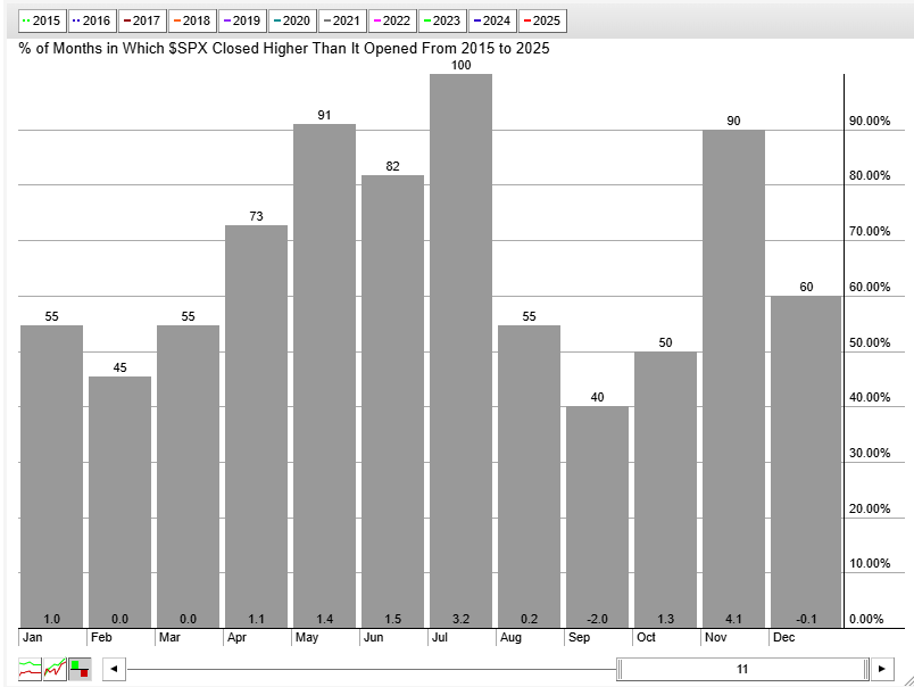
Seasonally, September has been the worst stretch of the year in past cycles. Since 2006, the final month of the third quarter has been positive just 53% of the time, with an average return of -0.7%. And September blues have gotten worse lately — the last 10 of them sport a 2% average loss, up just four times.
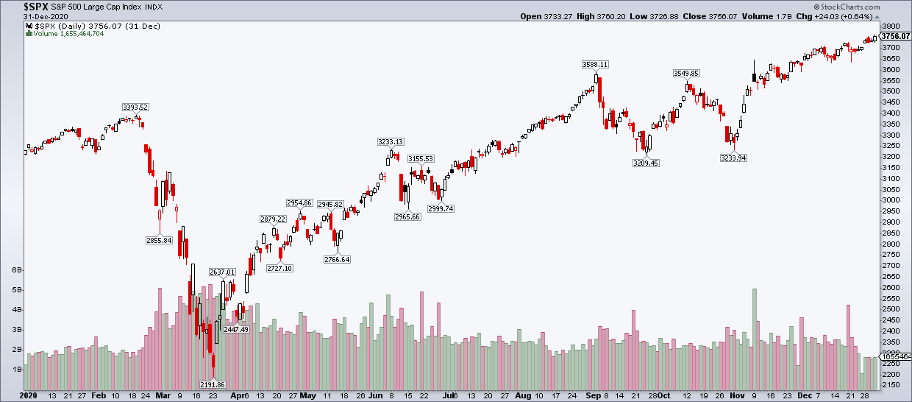
But of all the years, which has felt most comparable to 2025? You might say 2020.
Taking a trip back in time half a decade, we’d uncover that back then, there was an early-year sudden macro shock, followed by a just-as-fast recovery and rally to new all-time highs. Equities began paring gains around Labor Day and, specifically, big-cap tech stocks’ momentum took a turn lower.
3588 was the September 2, 2020 SPX high. A low was notched just three weeks later, but also 10% lower. Up-and-down price action ensued before stocks took off into the end of the COVID year.
Seasonality and historical analogues are the “fun and games” of technical analysis. The best tack is to follow what current trends signal. Yes, the potential RSI momentum divergence is a risk, but the bulls still appear in control of the primary trend. Along with S&P 500 higher highs and higher lows, the long-term 200-day moving average remains positively sloped, with the 50-dma above that, and price above both.
Perhaps a more likely scenario is the broadening-out theme. US small- and mid-cap stocks have caught a tailwind from increased Fed rate cut chances, all while international equities continue pacing for one of their best years this century.
Can there be an elegant passing of the bullish baton from the Microsofts, the Metas, and the NVIDIAs of this market to other, more cyclical niches? That’s the real question.
Monitoring Relative Strength
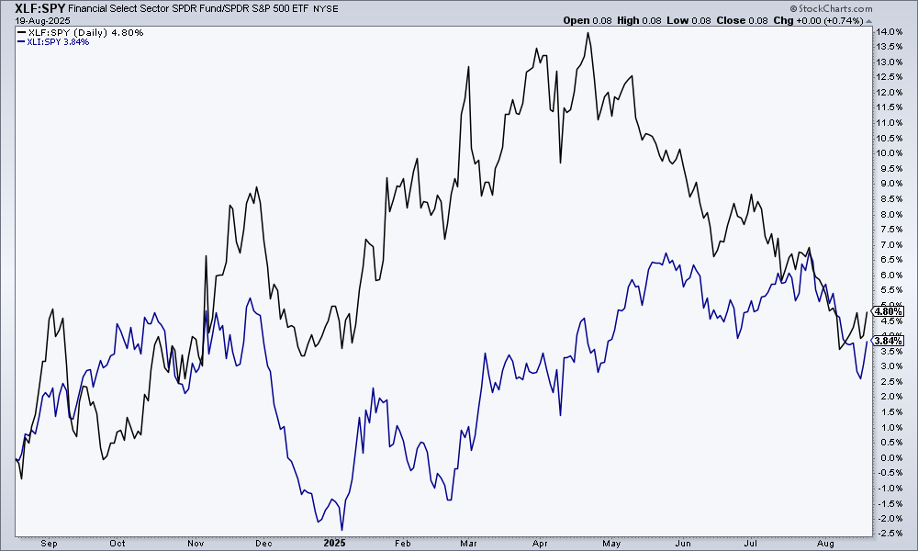
Here’s what I want to see (in order for the rally to continue): Financials (XLF) and Industrials (XLI) need to get back in the game. Those cyclical-value sectors boasted solid relative strength over much of the first half of the year, but their alpha has waned lately. The former group petered out versus the S&P 500 in April, just as the tech and AI trades took off. The latter sector’s relative chart shows a potential double-top pattern (highs in May and July).
The Bottom Line
NVDA broke below its 20-day moving average for the first time since April this past Tuesday. It came amid significant selling in the Qs (but nothing catastrophic), leaving the S&P 500 vulnerable to a seasonal correction. 2020 could be a helpful analogue. With all that in mind, though, the bulls can continue holding the reins if the risk-on areas like Financials and Industrials reassert themselves.


