S&P 500's Next Move: Tumbling Toward a Technical Correction or a Bounce?
Key Takeaways
- Technical breakdowns accelerated as volatility jumped, but President Trump’s latest comments sparked a massive rally.
- Interest rates had spiked to multi-year highs, triggering sharp declines in gold and risk assets.
- Intermarket stress signals late-stage risk-off dynamics, and snapback rallies can be intense.
It was another bruising session to start the final full week of the first quarter before President Trump de-escalated the war in Iran. The S&P 500 (SPX) had fallen hard coming into the week, but other asset classes felt real pain. Gold collapsed to below $4100 per ounce, while global bond yields soared to levels not seen since 2011 or even 2009. It's classic headline-driven correction behavior, with bears targeting havens and beating down what had already been under pressure.
Traders now eye where a bottom could enter the picture. Let's begin with first principles and reassess the S&P 500 as it tracks for its worst monthly performance going back to September 2022, though we’ll see how much the current bounce has legs.
The Breakdown Gains Traction
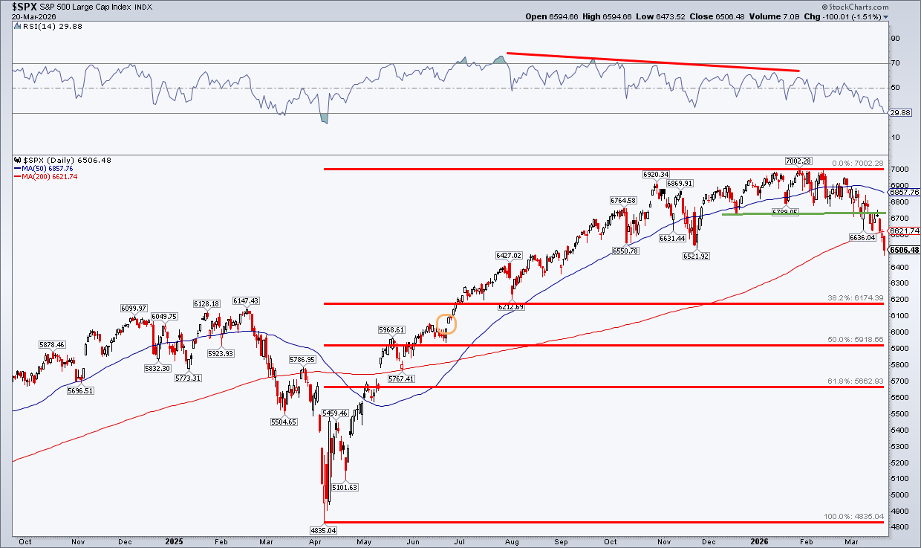
On the 18-month SharpChart, we find that the bearish rounded top pattern that played out from last December through the current month has given way to the bears. A neckline just above 6700 augurs for a measured move downside price target to 6400, and that near-correction level is very close to view as of early this week. I’ll have 6700 on my radar for a possible resistance spot should the SPX rally further (former support becomes new resistance—the polarity principle).
Indeed, violent rallies can come on short notice, particularly when the VIX is in the 20s or 30s. The implied daily S&P 500 swing is close to 1.5%, with a data-light and earnings-light week ahead. All eyes continue to be on President Trump’s social media account.
Mapping the Downside
I see some confluence of support in the low 6000s. Notice in the chart below that the 38.2% Fibonacci retracement of the April 2025 to January 2026 rally is near the aforementioned measured move objective of 6174. Notable, too, is the pre-Liberation Day high of 6147. Finally, a gap lingers at 6025, ironically from immediately after a strong rally following Operation Midnight Hammer. But first, the S&P 500 must reach 6302 to tag technical correction territory.
Refer to the 2011 Playbook?
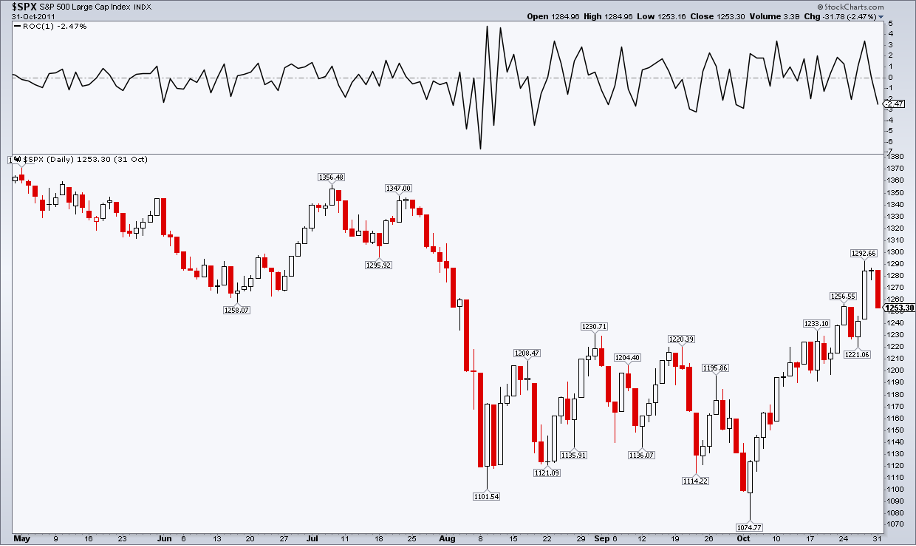
Rarely do markets fit neatly with chart patterns; traders must be open to an array of possibilities. The current pullback has echoes of the summer 2011 European debt crisis—a 19% S&P 500 near-bear market that unfolded from a market top on April 30 to a low on October 4. In August that year, the S&P 500 swung from –6% to +5% to –4% to +4% over a four-day period. Yes, volatility is nothing new!
It was a multi-month global retreat, and international stocks were hammered, along with U.S. small caps. Unlike some recent dips that were bought up quickly, investors back then were worn out by relief rallies that the bears ultimately devoured.
Sliding Down the Slope of Hope
CNBC’s Michael Santoli noted that while it’s true that markets like to climb walls of worry on the way up, they also slide down slopes of hope during corrections and bear markets. That’s what it feels like today.
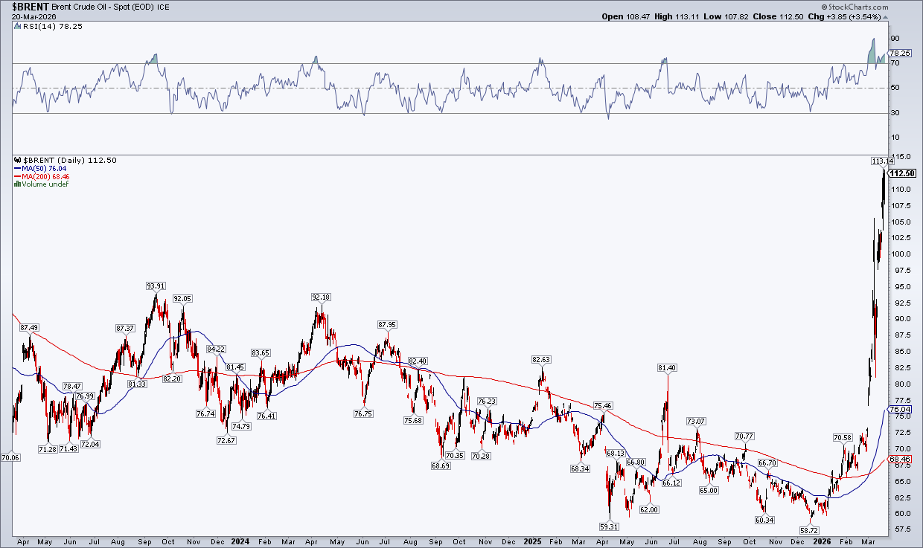
One such hope is that oil at least stabilizes near $100 on WTI and $115 on Brent. So far, so good after this morning’s action. The spike highs from two weeks ago in U.S. benchmark crude have held (though U.S. gas prices are still poised to hit $4 this week), while Brent bulls contend with the mid-$110s. As so often happens amid risk-off environments, fear spreads to other asset classes.
Bonds Send a Shockwave
Zooming out and scanning elsewhere, global sovereign bonds are under heavy financial fire as the war drags into its fourth week. The U.K. 10-year gilt yield surged above 5% on Monday before retreating, its highest level since July 2008 (immediately before the worst of the GFC and concurrent with the climax of that cycle’s energy crisis).
Bank of England and European Central Bank rate hikes are in the cards, according to bond traders. That hawkish reversal has sent shockwaves across the investable universe. The latest victim? Gold.
Gold’s Sudden Selloff
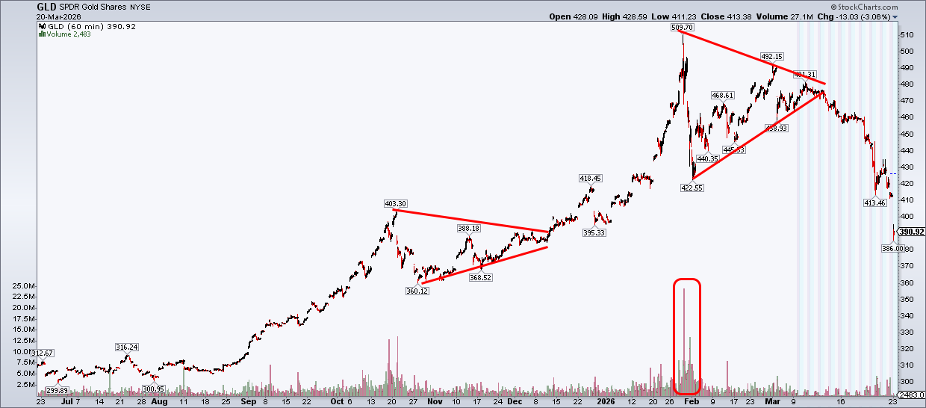
The yellow metal plunged into technical bear-market territory this week, acting as a risk-on asset. The SPDR Gold Shares ETF (GLD) was perched at $460 as recently as March 18. By March 23, the gold fund was 16% lower, a classic intermarket action in which sharply rising interest rates cause precious metal holders to sell en masse.
Technically, just as a symmetrical triangle marked a high, perhaps the coil pattern from last October through early December provides some cushion. Plotted below, the apex of that consolidation is just below $400 on GLD. Of course, the further we are removed from the January record high, the more that massive volume event looms as a blow-off top confirmation.
Bottom Line
Intermarket action has heated up as the war in Iran continues, but the POTUS took a significant step to cool it down. Traders now eye the 6300-correction level on the S&P 500 (and 6700 on the upside), while it has been an outright bloodbath in global bond markets. Gold has taken a beating, crypto remains unable to sustain rallies, and even defensive sectors have come under attack. Indeed, it’s not all about oil anymore.
The good news? This sort of far-reaching intermarket behavior is more indicative of the later innings of a classic risk-off ballgame than the early going.
Disclaimer: This blog is for educational purposes only and should not be construed as financial advice. The ideas and strategies should never be used without first assessing your own personal and financial situation, or without consulting a financial professional.