SPY Hits Key Moment as Bearish Breadth Signal Triggers; Yield Spreads Channel March 2025
Key Takeaways
- SPY uptrend hits moment of truth.
- More SPX/NDX stocks in downtrends than uptrends.
- Yields spreads show stress with sharp widening.
SPY is at a moment of truth as breadth deteriorates and stress increases in the credit markets. SPY, QQQ, and IWM remain in long-term uptrends, but are nearing their 200-day SMAs for a major test. Today's report focuses on SPY and its 5/200 cross.
Under the surface, breadth continues to deteriorate as a bearish signal triggered for the percentage of stocks above their 200-day SMAs. Elsewhere, the BBB spread widened significantly in March, showing stress in the credit markets.
SPY Uptrend Hits Moment of Truth
The SPDR S&P 500 (SPY) is nearing its moment of truth as the 5-day SMA (blue line) closes in on the 200-day SMA (pink line). As of Thursday's close, the 5-day was just 0.70% above the 200-day SMA. A bearish cross would signal a downtrend for the most important benchmark for US stocks.
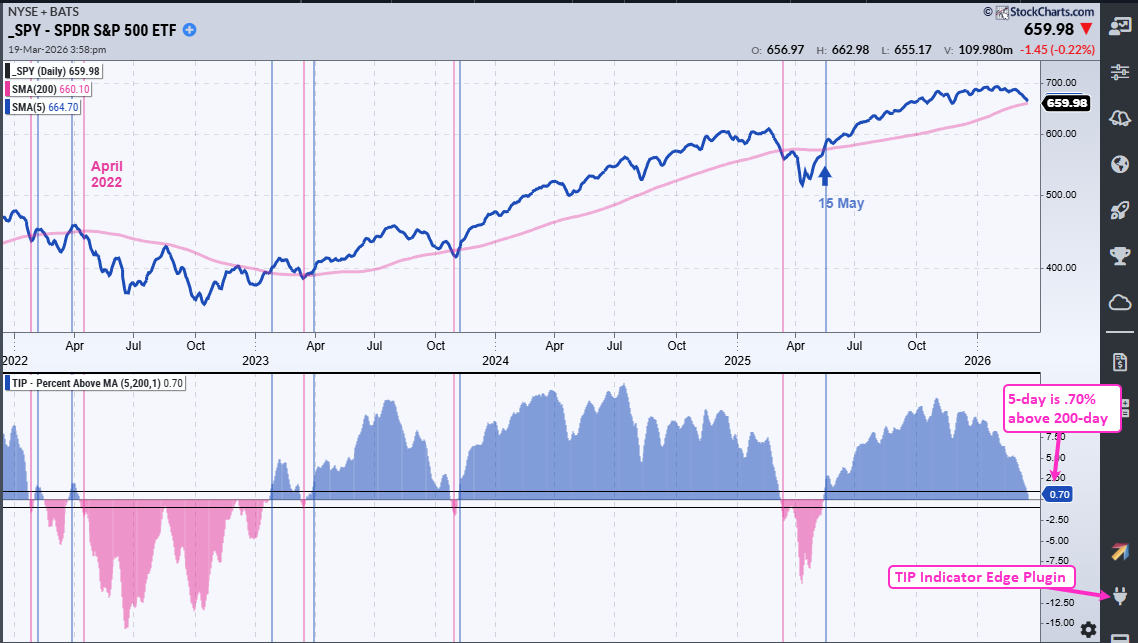
The indicator window shows Percent Above MA (5,200,1), which measures the percentage difference between the 5- and 200-day SMAs. Signal thresholds are set at +1% and -1%, meaning the 5-day must cross the 200-day by more than 1% for a signal. This signal filter can reduce, but not eliminate, whipsaws (bad signals). Whipsaws are the price of entry; traders must tolerate the whipsaws to catch the big uptrends and avoid the big drawdowns.
From 2005 onward, there are 19 completed trades and one open trade. This strategy generated a Compound Annual Return of 7.13% (without dividends) and a Maximum Drawdown of 19.23%. There were 13 winners and 7 losers for a Win Rate of 65%. The current trade is still open (since May 15th) and SPY is up 11.87% since this signal.
As the most important benchmark for U.S. stocks, traders should pay heed to the long-term trend because trading is all about probabilities. Positive outcomes are more likely when SPY is in a long-term uptrend. Negative outcomes are more likely when SPY is in a long-term downtrend.
More SPX/NDX Stocks in Downtrends than Uptrends
The next chart shows SPY with its 200-day SMA, SPX %Above 200-day SMA ($SPXA200R) and NDX %Above 200-day SMA ($NDXA200R). Both indicators are below 50% and at their lowest levels since May. Stocks below their 200-day SMAs are in long-term downtrends and weighing on the market.
This combo triggers bullish when one is above 50% and the other confirms with a cross above 50%. NDX %Above 200-day crossed above 50% on May 8th, and held above 50%. SPX %Above 200-day confirmed with a cross above 50% on May 12th. See blue arrow lines.
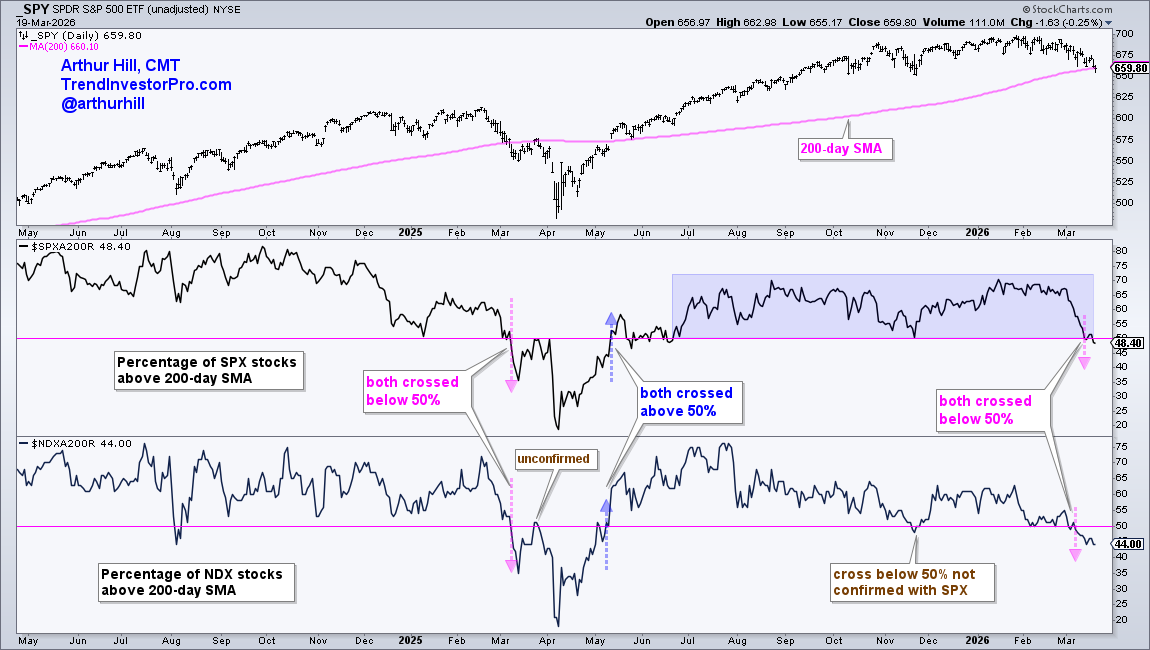
NDX %Above 200-day SMA crossed below 50% on March 6th and remained below 50%. This cross provided the setup. A bear signal triggered on March 12th when SPX %Above 200-day SMA confirmed with a cross below 50%. This bearish signal remains valid until both cross back above 50%.
Recent Reports and Videos on TrendInvestorPro
- Trend Trio150 Signals for Dow 30 Stocks and SPDRs
- DB Agriculture ETF Leads as Copper Sends a Message
- A Defense Stock with a Bullish Setup
- Tech ETFs Hold Up, but have yet to Reverse Downswings
Click here to take a trial and gain immediate access.
Yields Spreads Show Stress with Sharp Widening
The BBB yield spread widened significantly in March and hit its highest level since May. This shows stress in the credit markets, which is negative for stocks. Notice that the BBB spread started widening in late February 2025, foreshadowing the stock market plunge into early April. This BBB spread started widening in February and surged in March as the S&P 500 fell below its 200-day SMA. It's like déjà vu all over again (h/t Yogi Berra).
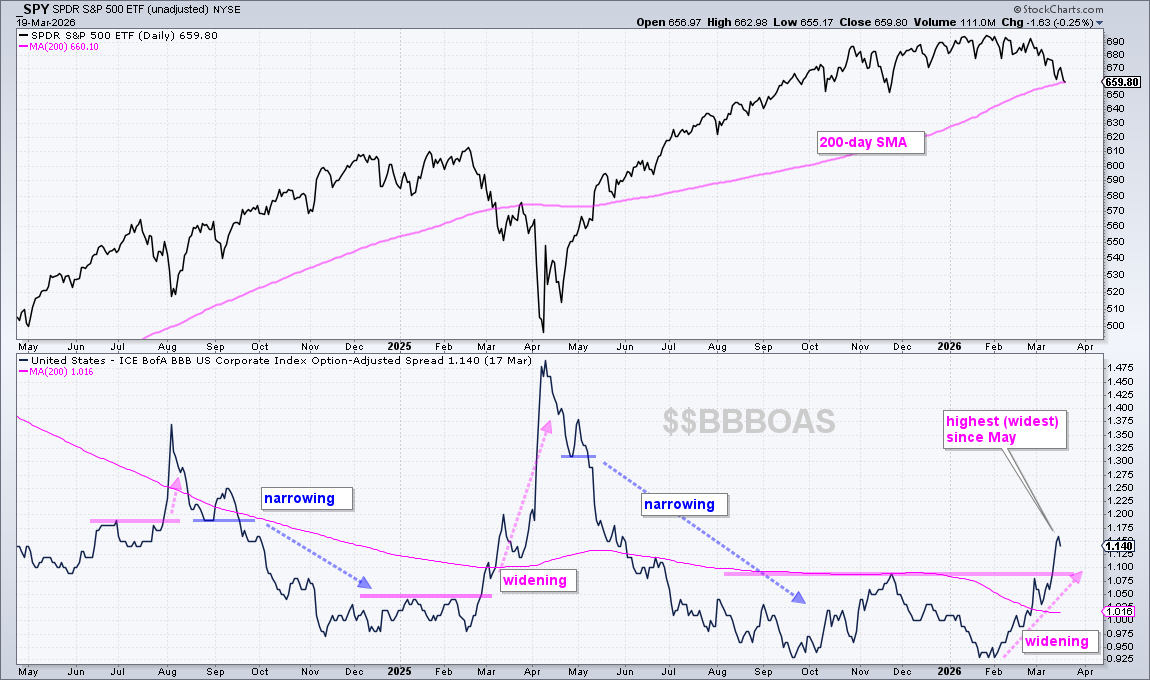
The BBB spread is the difference between the BBB corporate bond yield and a comparable Treasury bond yield. BBB bonds are the risk asset and Treasuries are the safe-haven, relatively speaking. The spread is the difference between their yields. A wide and/or widening spread means traders are demanding higher returns (risk premium) because risk is rising. A narrow and/or narrowing spread means traders are content with a lower risk premium because they have confidence in the borrower's ability to meet their obligations. Narrowing equals confidence, while widening equals stress.
See TrendInvestorPro for more reports and videos.