SPY and QQQ Break; High-Low Line Flattens; Lessons from the Oil and Rate Shock in 2022
Key Takeaways
- SPY and QQQ take the lead, just like they did in May.
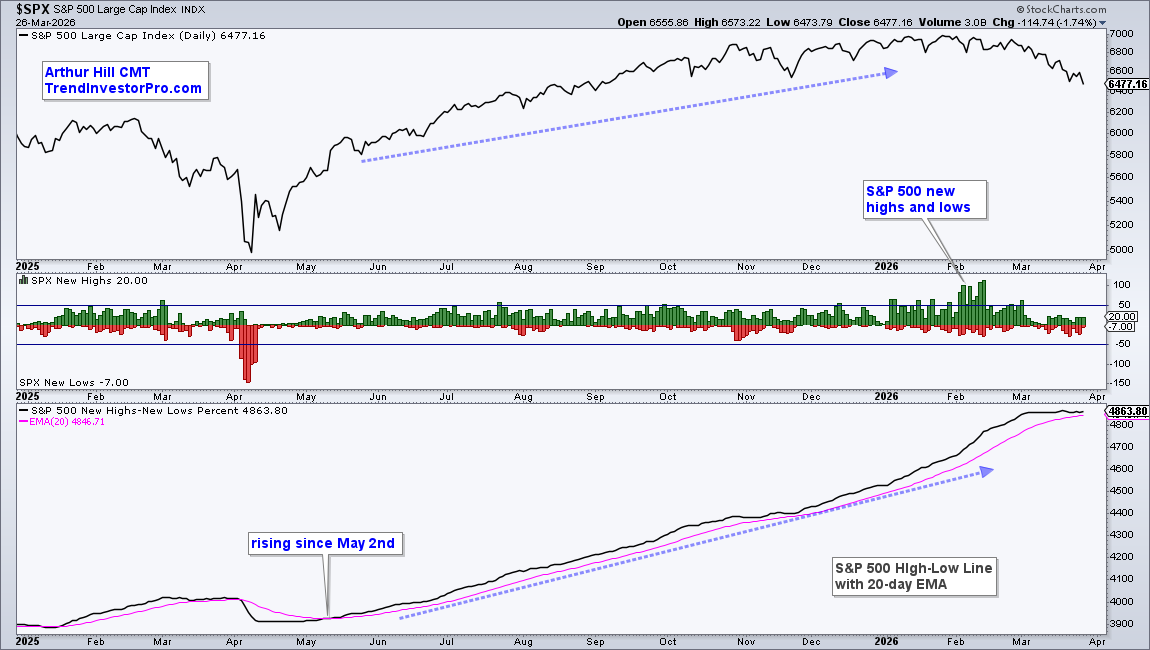
- The SPX High-Low line is flattening out.
- See how the current oil and rate shock compares with that of 2022.
The macro environment continues to deteriorate as oil prices remain elevated, interest rates are rising, and SPDR S&P 500 ETF (SPY) breaks its 200-day SMA. Today's report compares the oil and interest rate shocks in 2022 with the current environment. Elevated oil prices and surging Treasury yields brought on the 2022 bear market. This suggests that stocks are vulnerable as long as oil remains elevated and interest rates rise. The broader market is holding up better than SPY and Invesco QQQ Trust (QQQ). However, small-caps are close to breaking and the High-Low Line flattened out in March.
SPY and QQQ Take the Lead
The average S&P 500 stock and small-caps are holding up better than large-caps. The S&P 500 EW ETF (RSP) and Russell 2000 ETF (IWM) remain above their rising 200-day SMAs (blue circles), but just barely. In contrast, the SPY and QQQ broke their 200-day SMAs this month (pink circles).
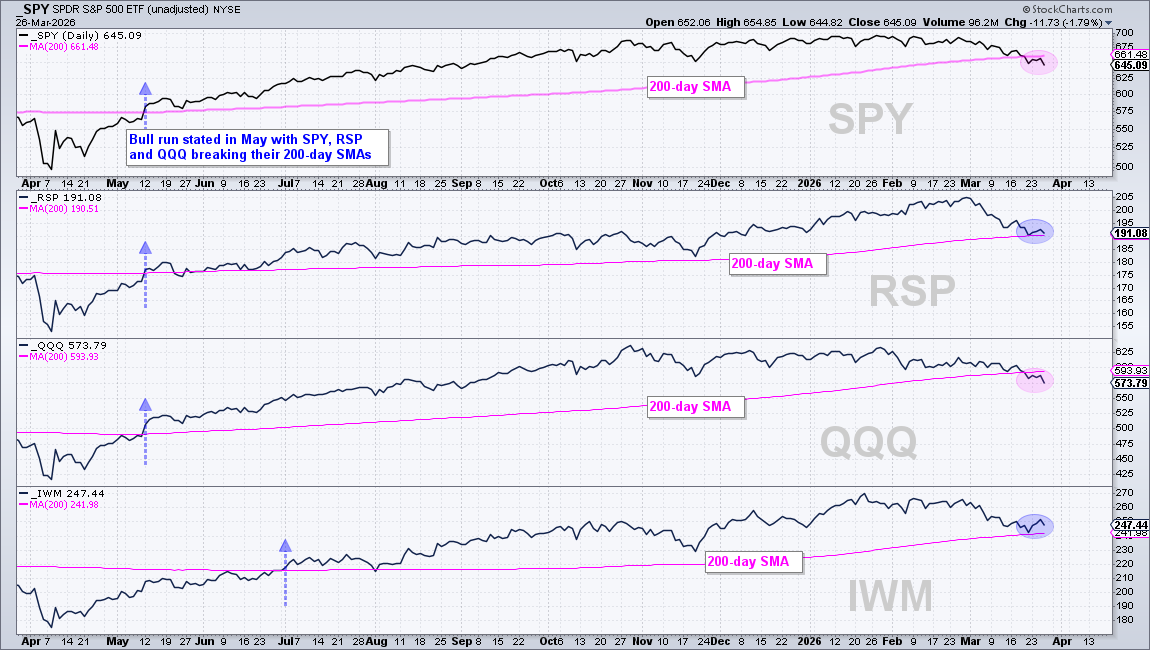
What matters most? In my book, the breaks in SPY and QQQ outweigh relative strength in RSP and IWM. It's difficult to get excited about stocks when the former are below their 200-day SMAs. RSP is trading right at its 200-day and another push lower would break this key moving average. Notice that the bull market started when SPY, RSP, and QQQ broke above their 200-day SMAs in May. The exact opposite is happening right now.
SPX High-Low Line Flattens Out
Relative strength in RSP is reflected in the S&P 500 High-Low Line, which has yet to turn down and break its 20-day SMA. The chart below shows the S&P 500 in the top window, S&P 500 New Highs and Lows in the middle, and the High-Low Line, which is a cumulative measure of net new highs (new highs less new lows). This line rises as long as new highs outpace new lows, which has been the case since early May. The High-Low Line flattened in March, but has yet to turn down. A downturn and cross below the 20-day EMA would show new lows expanding, which would be negative for the broader market.
Comparing Current Oil Shock with 2022
Once again, the markets are dealing with a price shock as oil surged over 50% in three months (65 days). The chart below shows Light Crude Spot ($WTIC) with ROC(65) in the indicator window. The last oil shock occurred in February 2022 as oil surged over 50% in 65 days and exceeded $100.
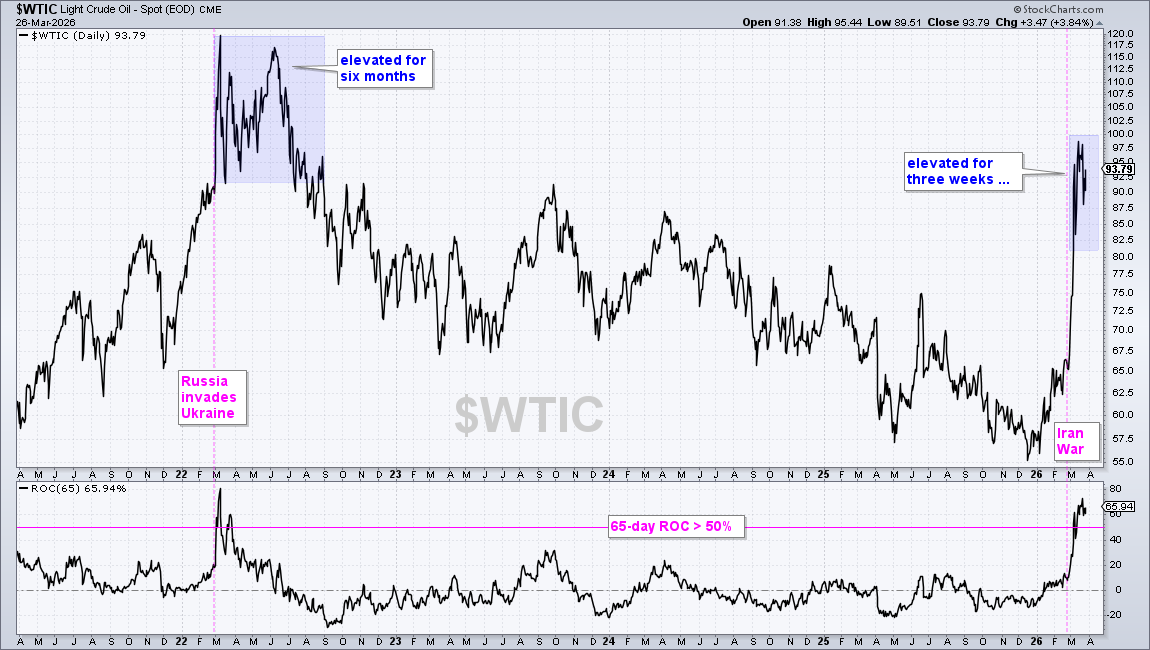
As the blue shading shows, oil remain elevated for some six months and moved lower in the fourth quarter of 2022. The current shock sent oil above $90 and prices remain elevated (for three weeks and counting). The longer oil remains elevated, the more bearish the outlook for stocks and bonds.
Recent Reports and Videos on TrendInvestorPro
- Trend Trio150 Signals for Dow 30 Stocks and SPDRs
- Agriculture, Wheat, Corn and Sugar ETFs Break Out
- Breadth Deteriorates, Spreads Widen and Rate Rise
- Downtrend Signals in XLK and XLC - A Breakout in the Space ETF
Click here to take a trial and gain immediate access.
2022 Bear Market Coincided with Oil Shock
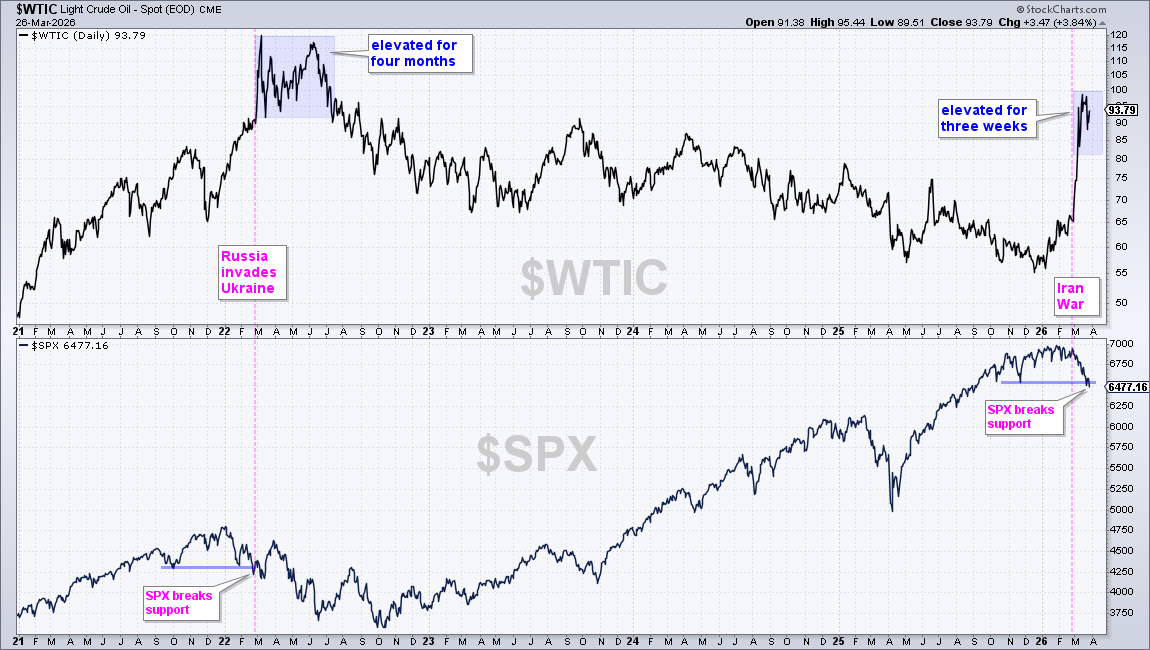
Even though there are many macro factors influencing stocks, I would put oil and interest rates in my top 10. Slow increases in oil prices and interest rates are usually not an issue. Sharp and sudden shocks, however, create issues for stocks (high energy costs, inflationary pressures, rising interest rates, etc.). The chart below shows Light Crude Spot with the S&P 500. The 2022 oil shock led to a support break in February and a downtrend into October. 2026 is looking similar as the S&P 500 reacted to the oil shock with a break below the November low.
Surge in Yields Contributed to 2022 Bear Market
The next chart shows the S&P 500, 10-yr US Treasury Yield ($UST10Y), and Light Crude. In 2022, the 10-yr yield surged from 1.34% to 2.49% on the heels of high oil prices (pink shading). The combination of rising oil prices and rising interest rates brought on the 2022 bear market as the S&P 500 fell from 4800 to 3600.
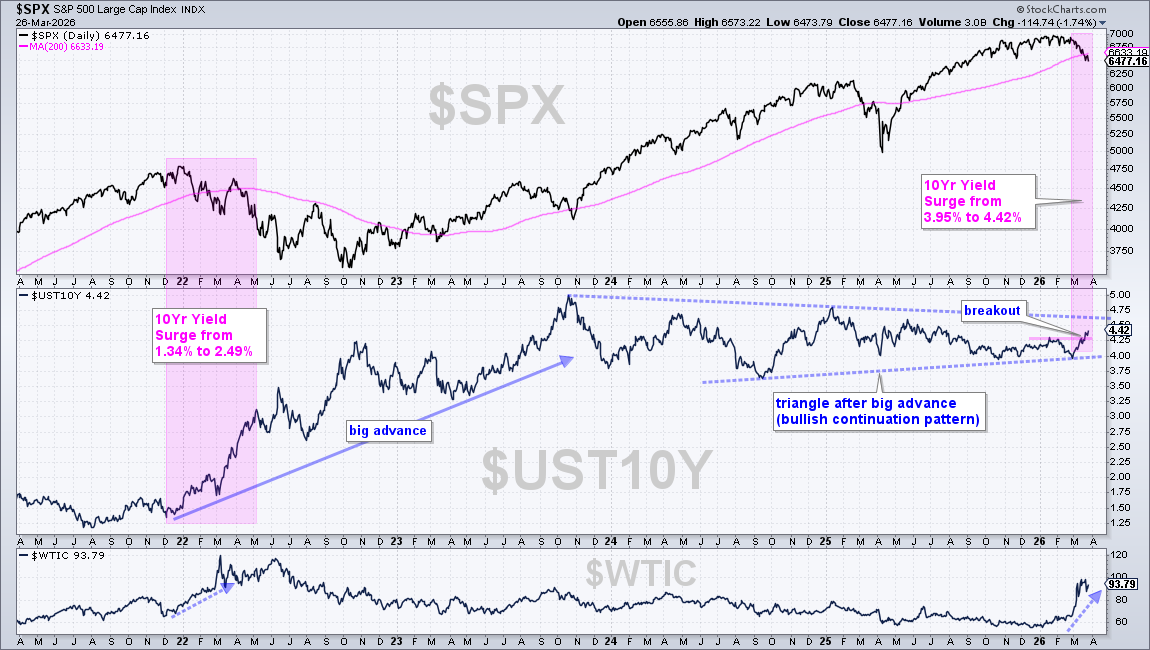
Fast forward four years later and we can see the 10-yr yield breaking resistance from its January highs and surging above 4.4%. Overall, a large triangle formed after a big advance (December 2021 to October 2023). A triangle breakout would signal a continuation higher and target a move above 5%.
The stock market cup is half empty right now, but our breadth models have yet to trigger bear market signals. Several indicators, however, are close. We will be following these signals and more at TrendInvestorPro.


