Stock Market Is Sending Mixed Signals; Here’s What to Watch

Key Takeaways
- The major indexes are leaning to the downside and showing mixed signals.
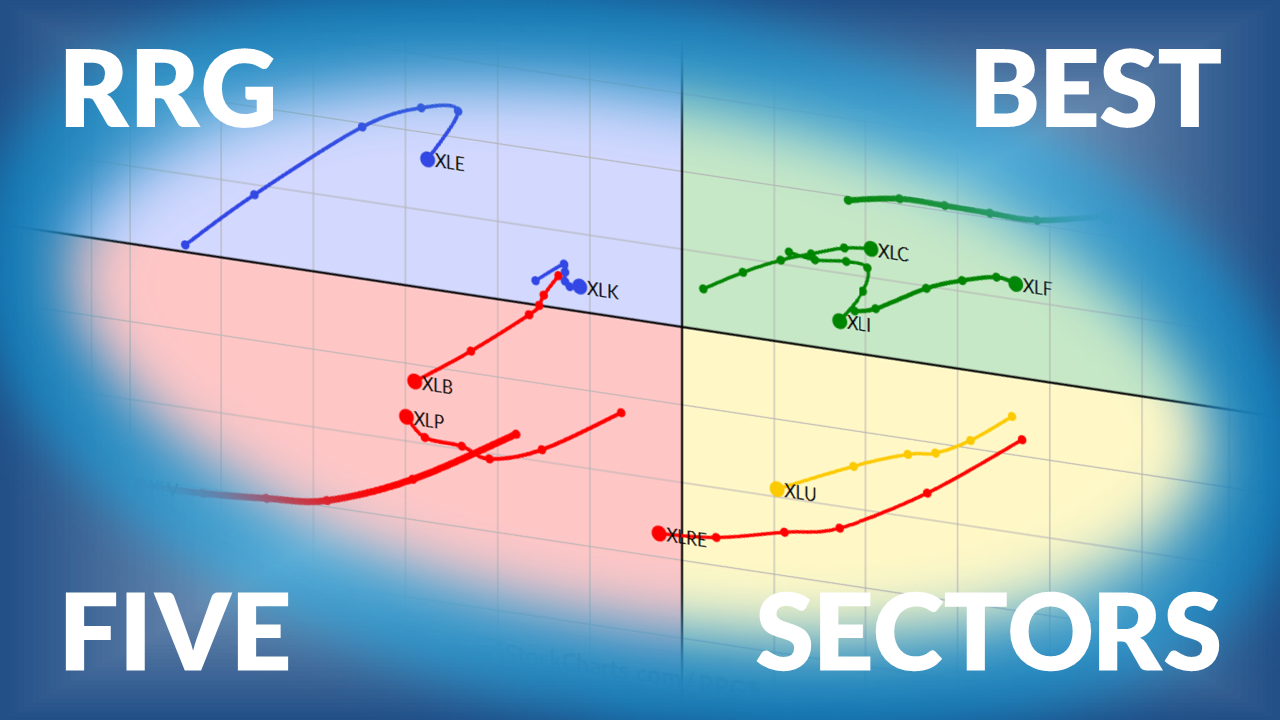
- Semiconductors are showing signs of potential leadership and are worth watching when the market turns higher.
- Monitor leading stocks and momentum indicators like ROC for early signs of an upside move.
If this market has you scratching your head, don’t fret. Chances are, many investors are feeling the same way.
The International Energy Agency recently announced it would release oil reserves. Normally, this might push oil prices lower. Instead, oil prices rose. At the same time, stocks, bond and precious metals all declined, and the U.S. dollar strengthened.
The market isn’t behaving the way you’d expect it to during geopolitical tensions. When this happens, charts often provide the clearest clues.
Equities Leaning to the Downside
Despite recent headlines, there hasn’t been much of a structural change in the equity market. The S&P 500 ($SPX) continues to trade within the range it’s been in since October. The Nasdaq Composite ($COMPQ) still shows a pattern of lower highs and lower lows (see chart below).
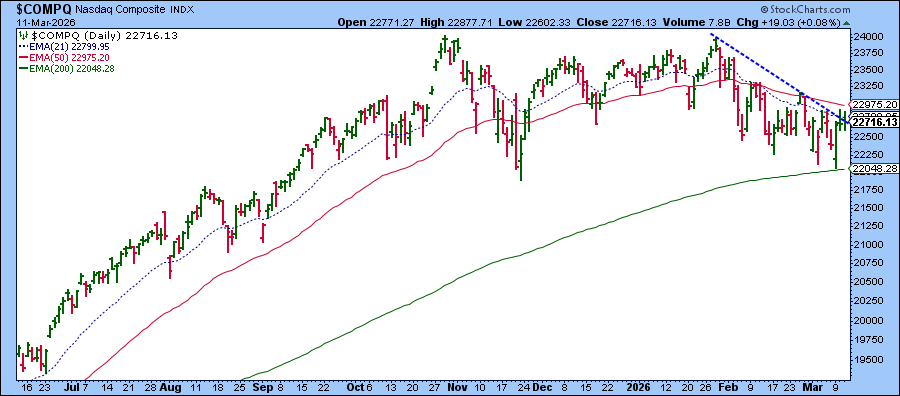
The index recently bounced off its 200-day Exponential Moving Average (EMA), which is a little encouraging. Given the choppy nature of recent price action, I’m using the EMAs on this chart to better capture overall price direction.
The 21-day EMA remains below the 50-day EMA, and the Nasdaq has tried twice to break above the downward-sloping trendline. Both attempts ended with the index closing below or at the trendline.
The Dow Jones Industrial Average ($INDU) is also showing a similar pattern. Overall, the market still leans slightly to the downside, even though buyers step in on up days, which is why we occasionally see sharp upside moves. Even during this uncertain period, though, some industry groups are showing strength.
Semiconductors Showing Leadership
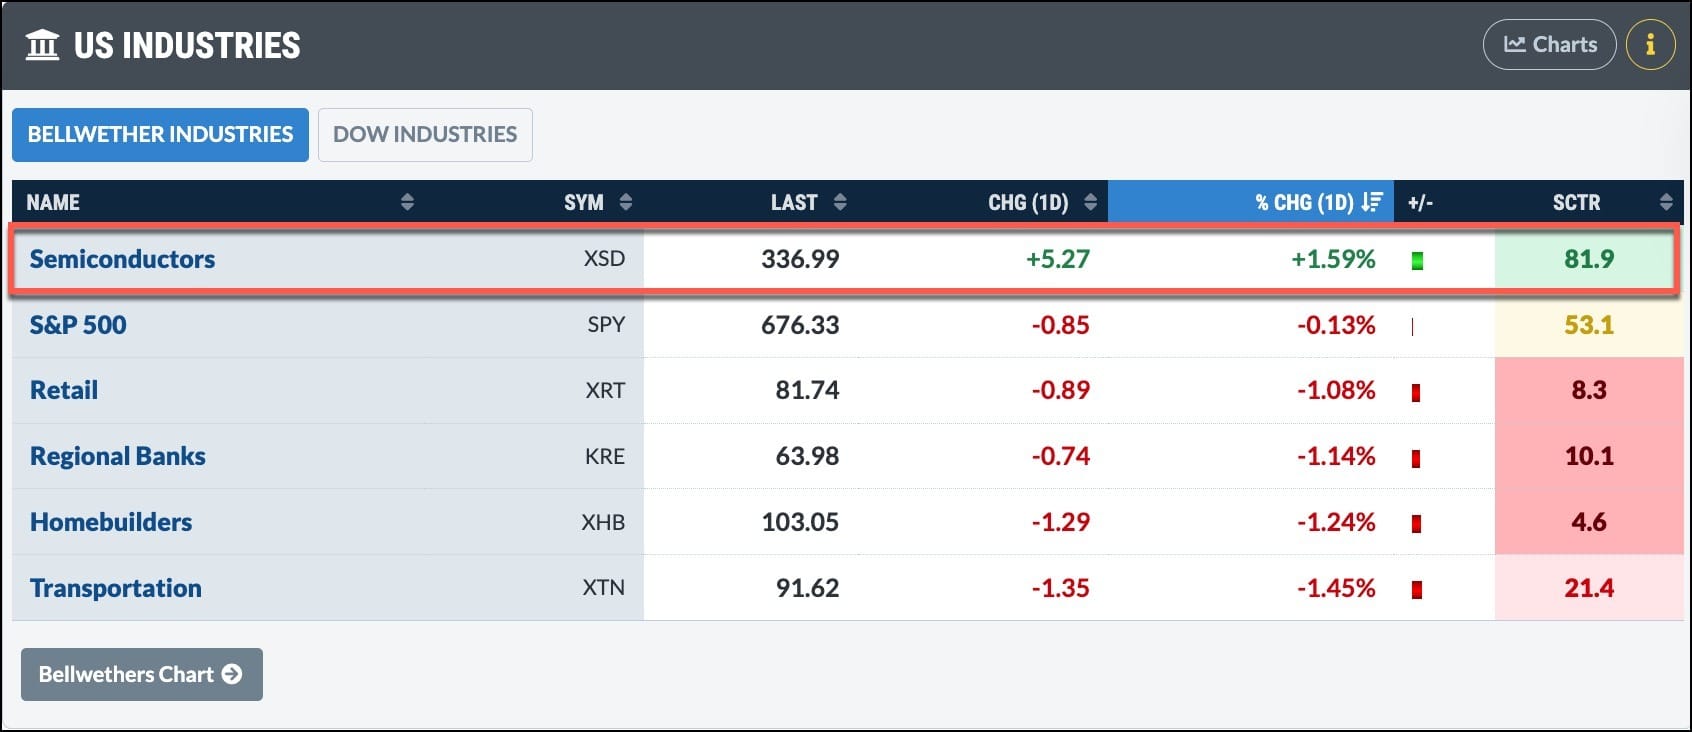
Technology stocks are particularly interesting and worth watching. The StockCharts Market Summary page highlights which industries are gaining strength. In the image below, semiconductors occupy the top spot in the US Industries panel.
Let’s take a closer look at this group.
The SPDR Semiconductor ETF (XSD) has a StockCharts Technical Rank (SCTR) score of over 80. This suggests strong relative performance compared to the other bellwether industry groups.
XSD bounced off its 200-day EMA with a strong move. Despite the strong move, its 21-day EMA is touching the 50-day EMA and the ETF is still forming lower highs and lower lows. Before thinking about a potential trend reversal, XSD would need to break that pattern.
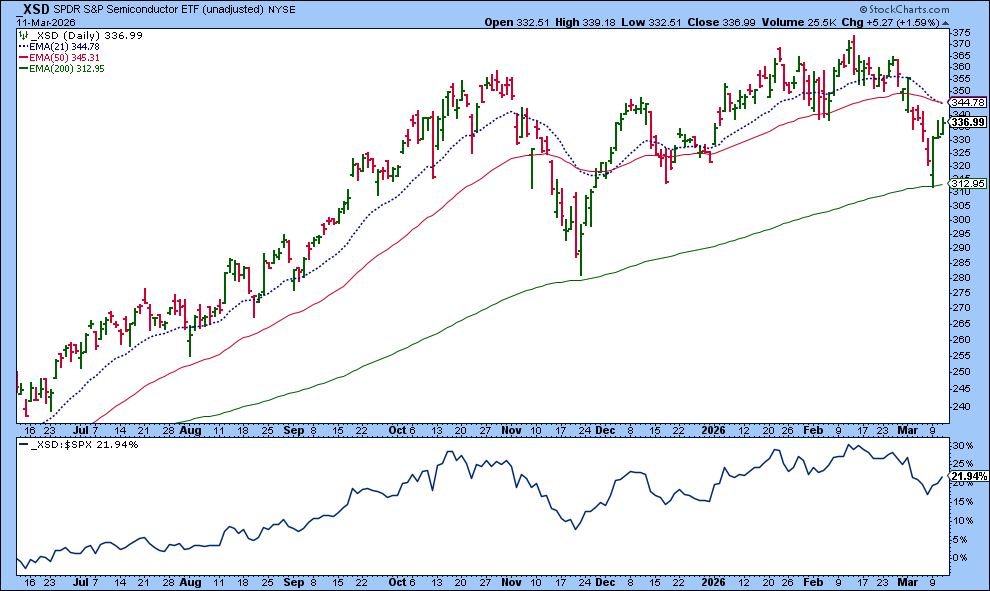
It’s encouraging to see that XSD is outperforming the S&P 500. If, and when, the broader market turns higher, leadership from semiconductors could drive the move.
Looking at Momentum: Micron (MU)
One useful indicator for evaluating momentum in a stock or ETF is the Rate of Change (ROC) indicator.
If you pull up the Symbol Summary for XSD (you can do this from the drawer below the chart), scroll down to the Profile panel, and click on the ETF page, you’ll find that Micron Technology (MU) is the largest holding. MU has had a strong run, though it’s now moving through a consolidation phase.
Looking at the chart below, MU has been in a steady uptrend since April 2025. Notice how the ROC indicator dipped below zero when MU pulled back to its 50-day Simple Moving Average (SMA). There were two notable surges, one in mid-September 2025 and the other in early January 2026.
After the mid-September surge, MU’s stock price continued trending higher. Even though ROC gradually declined after that, it was still above zero, indicating the uptrend was still in play. You can see a similar scenario in January 2026. While MU’s price continued rising, ROC was declining. When the stock price pulled back to the 21-day EMA, ROC dipped slightly below zero.
Since then, the indicator has been hovering near the zero line, moving slightly above or below it. When MU’s stock price pulled back to the 50-day SMA, the ROC dipped a little lower. It’s now back to around zero.
Bottom Line
With geopolitical tensions in the Middle East still creating uncertainty, this may not be the time to chase new positions, even if dip-buying looks tempting.
Instead, keep an eye on leading industry groups, such as semiconductors. When tensions ease, and stocks like MU begin to break decisively higher, together with ROC turning above zero, it could be an early signal that the broader market is ready to move higher again. Until then, focus on capital protection.
Disclaimer: This blog is for educational purposes only and should not be construed as financial advice. The ideas and strategies should never be used without first assessing your own personal and financial situation, or without consulting a financial professional.