A Market Without a Playbook, But Structural Conclusions Still Hold

Having spent years studying the markets, including many of those years under William O’Neil, I often find myself returning to the same playbook: look to history to frame a game plan for today’s environment. That said, the current market environment doesn’t map cleanly to any single period, as there isn’t one.
The macro backdrop clearly echoes the 1973–1974 period, with an oil shock feeding directly into inflation while colliding with already fragile confidence in policymakers.
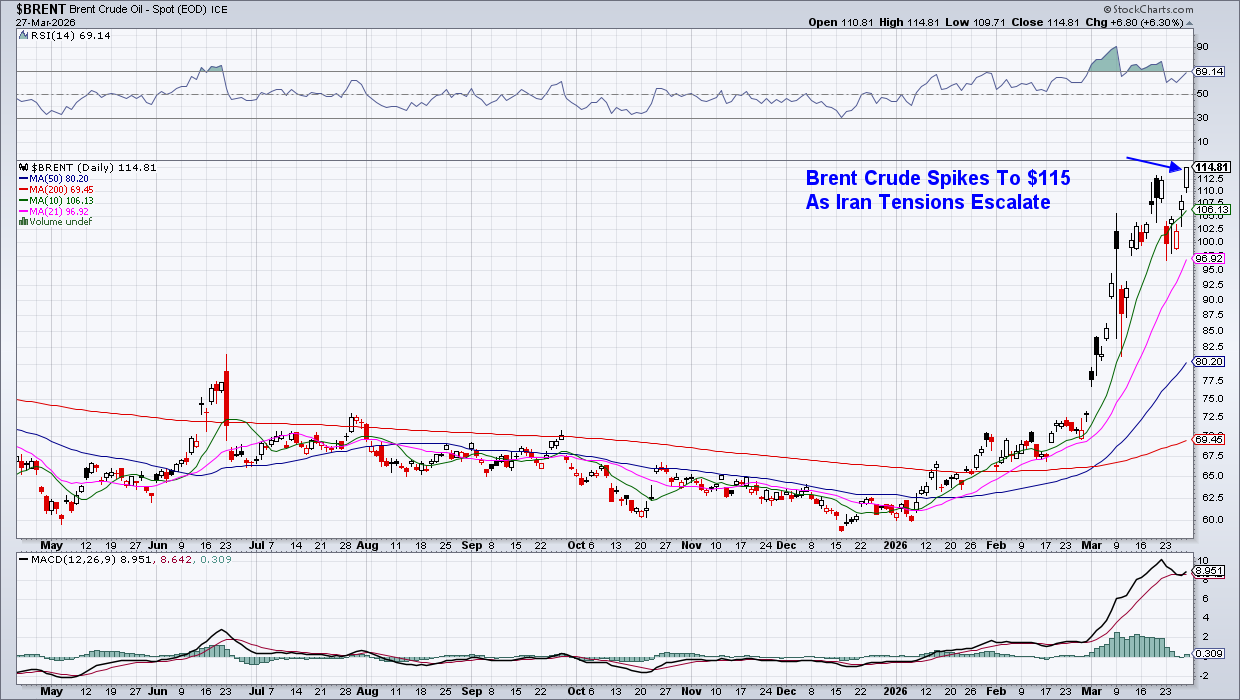
But, unlike the 1970s, today’s market isn’t built to absorb higher energy prices. We are now structurally exposed to the increased cost of oil. Reliance on fossil fuels results in the rapid transfer of energy costs into inflationary pressures. Thus the behavior of today's market feels much closer to the 2022 Ukraine war, where Price action is being driven less by fundamentals but more by headline-shifting news, with social media and algorithmic trading amplifying that news.
Then there’s what’s happening beneath the surface. Until today, gold has failed to consistently act as a safe haven. Other unstable cross-asset relationships, such as a sharp drop in Consumer Staples, are more reminiscent of the 2008 period than a traditional geopolitical selloff.
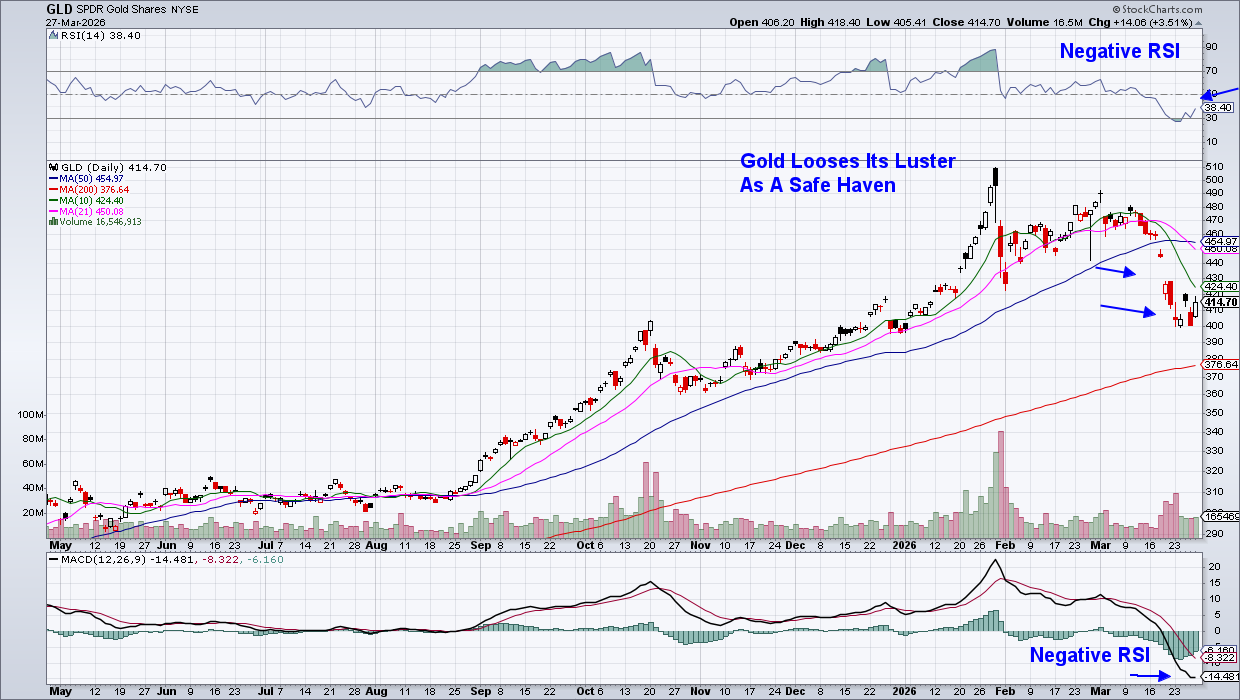
In addition, the recent drop in gold prices points to the potential for hidden stresses as institutions sell this asset to cover losses elsewhere.
What makes the current period different and more fragile is that the forces mentioned above are hitting all at once. We’re in a period that’s marked by the speed of information, dominance of passive flows, and a concentration in long-duration, AI-driven equities. In other words, this isn’t one historical regime but, rather, it’s several stacked on top of each other. We have the 1970s-style inflation shock, Gulf War-style headline volatility, and early signs of the 2008-style correlation stress. All of this is layered onto a 2026 market dominated by expensive, long-duration technology.
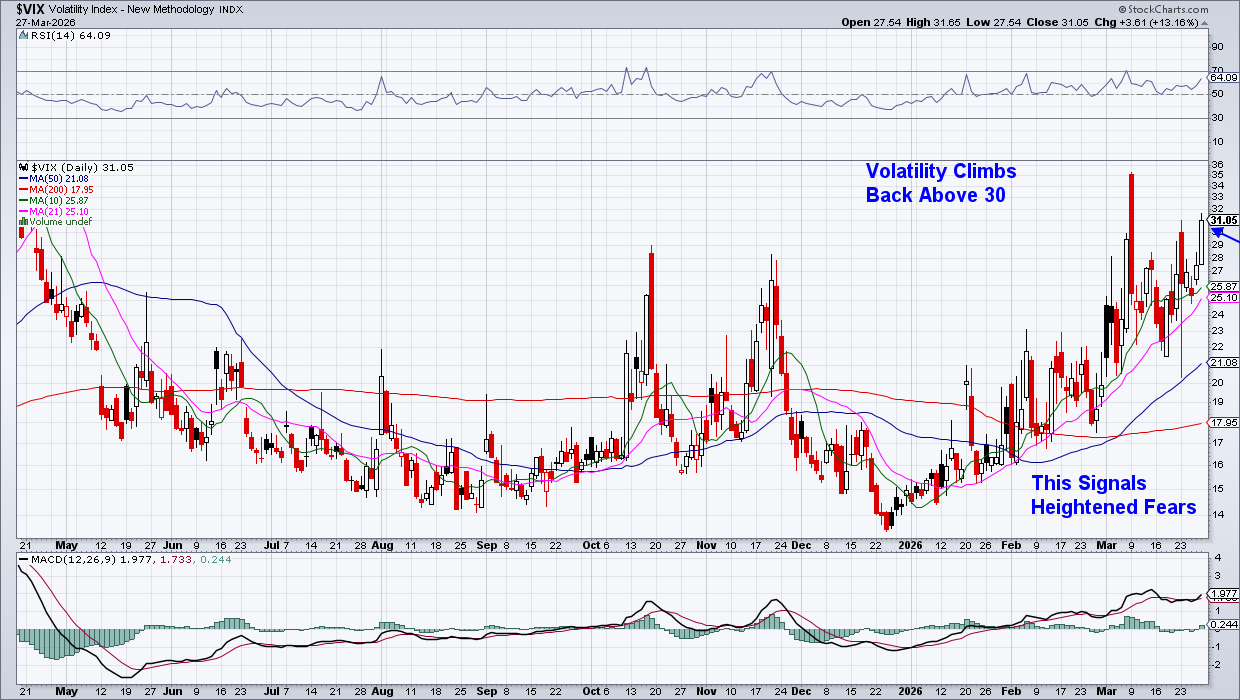
This combination is why the markets feel so unstable. It’s also why there’s no playbook. With valuations still elevated, earnings expectations still optimistic, and the index heavily exposed to interest rates and energy costs, the duration of the conflict remains the single most important variable. A swift resolution likely produces a sharp recovery, while a prolonged disruption would begin to be similar to 1973.
If the conflict resolves quickly, markets can stabilize just as fast. A two- to six-week duration is ideal for the market to recover quickly. During this window, the markets typically drop 5–10% in the initial shock phase and then stabilize once the worst case scenario is ruled out. This stabilization begins the recovery period, which takes place before the end of the conflict.
At this time, we are four weeks into the Iran war, and the Nasdaq and Dow are down over 10% and in a correction. The S&P 500 is not far behind.
If you’d like to uncover what takes place if the conflict is extended, use this link here to receive a no-cost trial of my twice-weekly MEM Edge Report. You’ll also be updated on current market conditions and select stocks that are trading higher despite market pressures.
Warmly,
Mary Ellen McGonagle
MEM Investment Research


