StockCharts Insider: A Practical Guide to the Ichimoku Kijun-sen Pullback
Before We Dive In…
Ichimoku often gets dismissed for a number of reasons. Maybe it looks too complicated. Maybe it’s too slow. Not surprisingly, a lot of traders will fail with it when they go against its design and try to speed it up, "forcing" signals that aren’t there, or using it on intraday charts. One of the most reliable Ichimoku strategies is also one of the simplest: the Kijun-sen pullback. To use it effectively, patience and a bit of nuance are required.
The Big Idea: Waiting for Trade Equilibrium
The Kijun-sen represents the price midpoint over the last 26 periods. Think of it as the agreed-upon fair value over the last month (which, of course, changes over time). Here’s what it looks like:
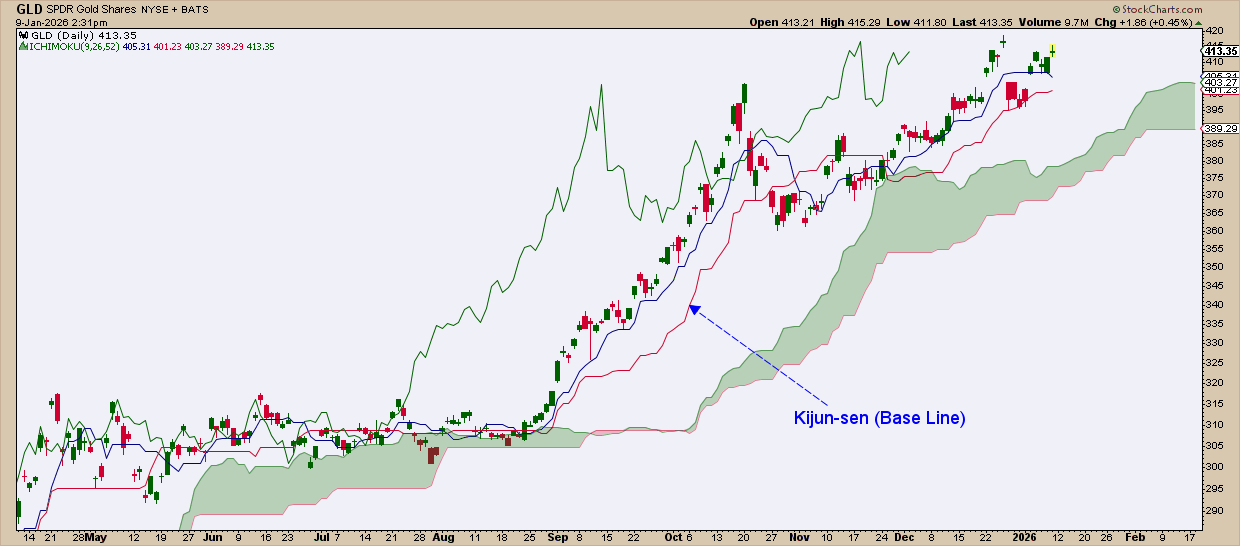
The Kijun-sen can be seen as something of an equilibrium point. When price is in a strong trend, it tends to move away from the Kijun-sen. But when it pulls back, its tendency is to bounce somewhere near the Kijun-sen and resume its trend.
The Kijun-sen pullback strategy is about exploiting that rhythm. Here’s how to trade it.
Three Steps to Trading the Kijun-sen Pullback
Step 1: Confirm the Trend Regime (Non-Negotiable)
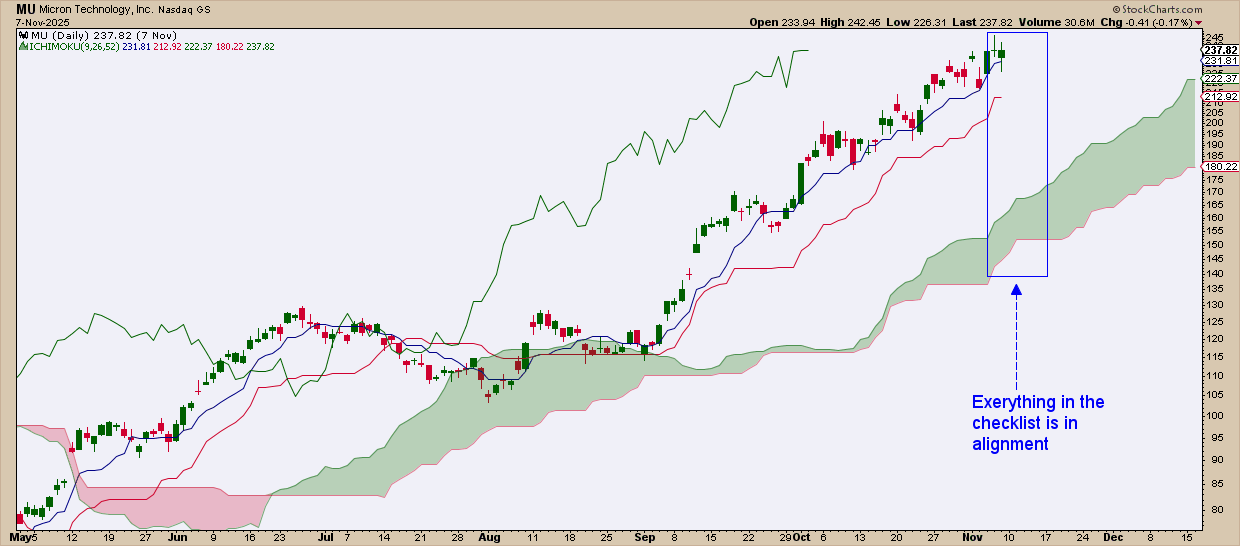
Before you even consider a trade entry, make sure the broader Ichimoku structure is aligned. Here’s a bullish regime checklist:
- Price is above the cloud.
- The cloud is rising and preferably thick.
- The future cloud is bullish.
- The Kijun-sen is sloping upward.
- The Chikou-span is above past price.
If the cloud is sideways, flat, or even thin, you might consider skipping the trade.
Step 2: Wait for the Pullback (This Is the Hard Part)
Once everything in your checklist aligns, the next step is to wait for a pullback toward the Kijun-sen. Here’s what you want to see:
- A controlled retracement.
- No decisive close below the cloud.
- The Kijun acting as a dynamic support range.
What you don’t want to see:
- A sharp, vertical selloff.
- A flat Kijun-sen, signaling consolidation.
- The Chikou Span tangled in past price.
The example below is tricky, but the signal eventually emerged toward the end of the pullback-turned-consolidation.
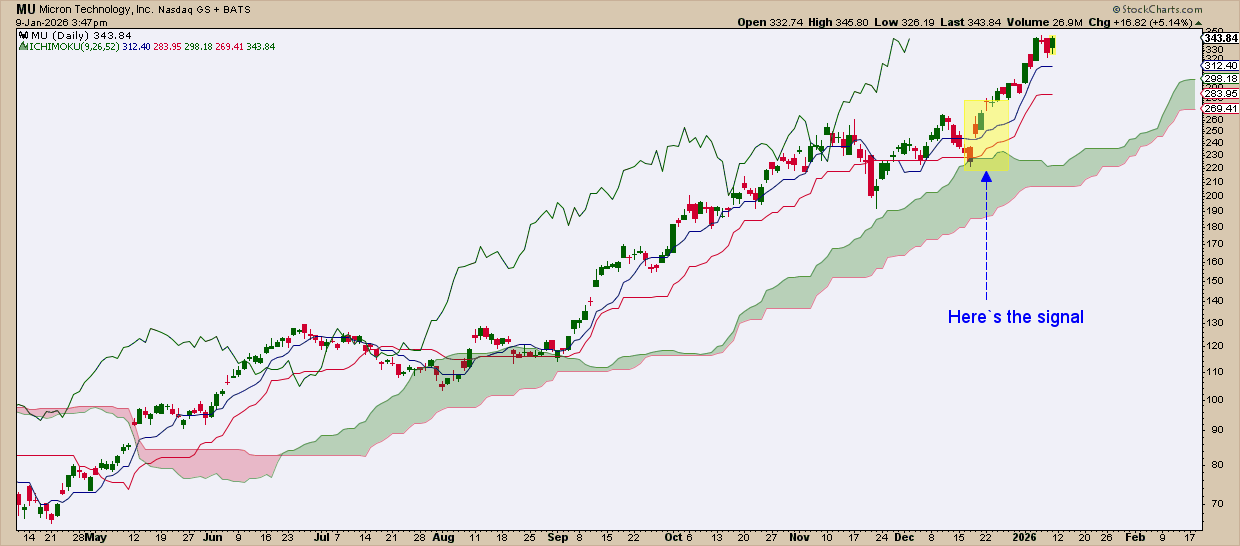
The cloud was bullish and thick when MU pulled back in late November. But it wasn’t until late December that the Chikou Span emerged above past price and the Kijun-sen lifted up from a long flatline period. Price also tested the cloud but was strongly rejected in favor of the bulls. The yellow-shaded area highlights when all bullish signals were aligned.
Step 3: Entry — Don’t Buy the Touch, Buy the Rejection
This is exactly what happened in our example above. It’s also where most traders get it wrong.
You don’t pull the trigger when price touches the Kijun. You take action when price moves back above equilibrium.
A few common entry triggers:
- A bullish candle closing back above the Kijun.
- A strong rejection off the Kijun, followed by a continuation (which is what is shown in the chart above).
- Momentum resuming after a brief Kijun-sen pierce (also seen above).
In short, don’t predict. Wait for the reaction.
Stops: Where Risk Is Defined
Here’s where you have to be nuanced in your thinking and interpret price action in a way that makes the most sense. This strategy works because the structure is clear.
But what if it fails? When and where do you get out? You can place a stop below the Kijun-sen if price pulls back again, but there are probably better areas for stop placement. Look to the most recent swing low as well as the cloud for stop placements.
It’s true that if price can’t hold equilibrium, the premise of the trade is weak. But to invalidate the trade, other factors must be considered. And it’s going to vary from one trade to the next.
Here’s what I would have done in the MU example. My stop placement is in the yellow-shaded area.
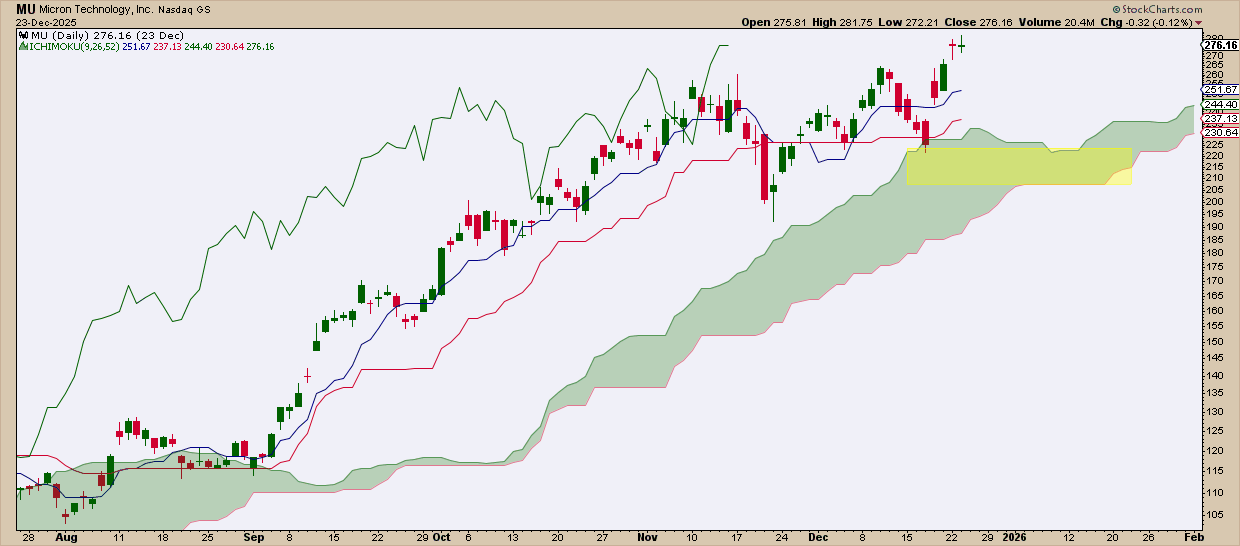
Why there? The swing low marked a good place for stop placement. Also, the cloud wasn’t too far below, and one of its perks is that it gives you a wider range of potential support. Thus, combining the cloud with the swing low seemed to make sense to me (not the Kijun-sen). You may think differently, but that’s my opinion.
Insider Tip: Stop Losses and Trend Exits are Not Always the Same Thing
One of the biggest mistakes Ichimoku users make is exiting too early. You want to let the trend breathe. Sometimes, however, you will get stopped out for various reasons, even while the trend is still rising.
Sounds confusing? Here’s an exit framework to help you.
Early warnings (not exits):
- Tenkan-sen crosses below Kijun-sen.
- Price closes slightly below Kijun but recovers.
- Chikou begins approaching past price.
Remember: these are warnings, not exit triggers.
Primary exit:
- A clean close below the cloud, confirmed by Chikou.
Trend exits are not the same as stop-losses. Depending on your entry, you may be stopped out earlier, especially if you chased price, if the move is already extended above the cloud, or if the market is simply pulling back.
A cloud break with Chikou confirmation, by contrast, suggests something bigger: a possible regime change rather than a short-term pause.
And That’s a Wrap
The Kijun-sen pullback is a slow, quiet strategy that rewards patience and thoughtful interpretation. When the trend is strong, the Kijun often provides a second and sometimes third opportunity to participate without chasing price. Trade the regime, respect equilibrium, and apply common sense when using this approach.