StockCharts Insider: Bullish Percent Index - A P&F Approach to Measuring Market Strength
Before We Dive In…
Last time, I showed how an index can keep climbing even as fewer stocks do the work; rallies that look strong but may already be weakening underneath. The Bullish Percent Index (BPI) measures how many stocks in an index are flashing Point & Figure buy signals. It gives you a unique angle on whether participation is expanding or quietly fading. Let’s look at how it works and how you can use it to tell whether a trend is fueled up or running on fumes.
What Makes BPI Different From Other Breadth Indicators
There are many different ways to slice and dice breadth, like measuring advances versus declines, tracking stocks that are above/below certain moving averages, tracking extreme highs and lows, and more.
What BPI does is track actual buy vs. sell signals.
More specifically, it shows you the percentage of stocks on P&F buy signals. And this is what differentiates BPI from the rest.
How BPI Works
We’re going to cut most of the P&F mechanics in this explanation. P&F strips away time and noise, plotting price moves in fixed boxes (using X’s and O’s) to highlight only meaningful shifts. If you want to delve deeper into this, check out our Chartschool page on Point & Figure.
Here’s what you need to know:
- Each stock measured in the BPI is either on a P&F buy or sell signal.
- BPI = the percentage of stocks on buy signals.
- Reversals require a 3-box move, which is likely to be a meaningful measurement.
Pretty simple so far. Now, let’s get to the heart of it.
The Six BPI Market Regimes
In a way, the BPI is like a market health monitor. By gauging a market’s condition ranging from bearish to bullish, it can help you spot critical opportunities and better time your decisions.
The following six regimes tell you what’s going on under the hood. And, by doing this, each one answers three questions: what’s happening internally, what might I consider doing next, and what are some common pitfalls to avoid.
The General Rule: BPI > 50% favors the bulls while BPI < 50% favors the bears
Now, let’s take a more nuanced interpretation.
1- Bull Alert — Possible Bottom Forming
Rule: BPI is below 30% and then forms a new column of X's (rises).
What’s happening internally? Participation deterioration may be nearing exhaustion, as fewer stocks continue breaking down.
What might I consider doing? Watch for signs of leadership emergence. If you’re going to buy, scale in carefully rather than going all-in.
Common pitfalls to avoid: Don’t assume the bottom is already in. Alerts signal possibility, NOT confirmation.
2- Bear Alert — Potential Top Forming
Rule: BPI is above 70% and then forms a new column of O's that decline below 70%.
What’s happening internally? The index may still look strong, but participation is dwindling. Internal cracks in the price action may begin to show.
What might I consider doing? If you’re long, tighten stops, take partial profits, and prepare for volatility. If you’re looking to go short, wait for a break below support and other confirmation factors before pulling the trigger.
Common pitfalls to avoid: The biggest “misread” is to ignore weakening participation just because prices are still rising. Prices may still rise further but, without breadth, the rally may become fragile.
3 - Bull Confirmed — The Market In Power Mode
Rule: BPI is on a P&F buy signal and in a column of X's (rising).
What’s happening internally? More stocks are flipping to P&F buy signals. Participation is expanding. Strength is broad, not just a handful of mega-caps dragging the index higher.
What might I consider doing? This condition favors long positions. Consider buying pullbacks and strong breakouts. This is where the old Wall Street adage “let winners run” comes into play.
Common pitfalls to avoid: Don’t sell too early because things look or feel overbought. Strong markets have a tendency to stay strong much longer than expected.
4 - Bear Confirmed — Broad Weakness Takes Over
Rule: BPI is on a P&F sell signal and in a column of O's (falling).
What’s happening internally? Stocks are declining across the board. P&F sell signals dominate. The downtrend expands.
What might I consider doing? Here’s when you might want to play defense. Tighten risk, reduce your exposure, or look for short opportunities.
Common pitfalls to avoid: Avoid picking bottoms too early. Weak markets can stay weak for much longer than expected.
5 - Bull Correction — Pullback in a Strong Market
Rule: BPI is on a P&F buy signal, but currently falling (column of O's).
What’s happening internally? Participation is cooling off, but the broader uptrend remains intact. Think “market breather,” not collapse.
What might I consider doing? Here’s where you look for buy-the-dip opportunities in strong names.
Common pitfalls to avoid: Some investors panic out of positions during normal pullbacks; not a smart thing to do.
6 - Bear Correction — Bounce in a Weak Market
Rule: BPI is on a P&F sell signal, but currently rising (column of X's).
What’s happening internally? In this scenario, some stocks are recovering, but the broader trend remains weak. It’s a relief rally, not a recovery.
What might I consider doing? Remain cautious; these “rallies” often offer better exit or short-entry points.
Common pitfalls to avoid: Don’t mistake this bounce for a new bull market.
Let’s look at an example of the Tech sector BPI alongside Technology Select Sector SPDR Fund (XLK).
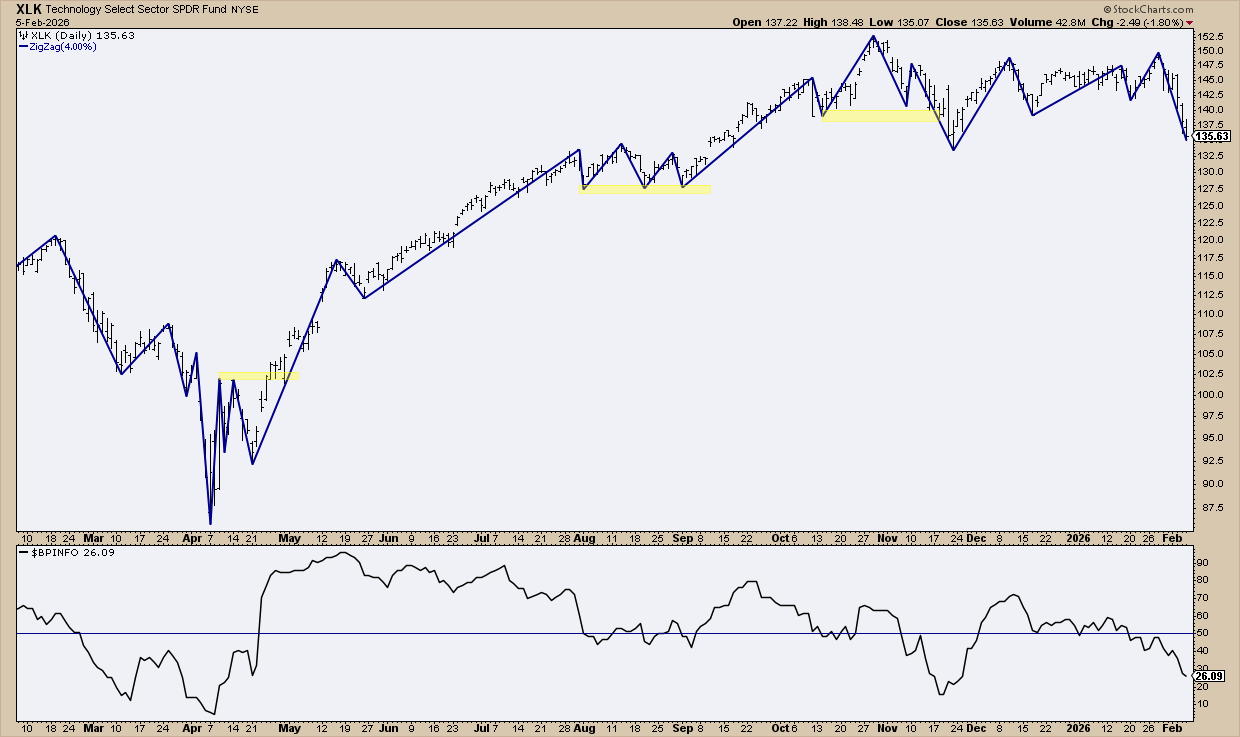
In March and April 2025, BPI flashed a bull alert as the sector capitulated on April 7, marking a bottom. When price later broke above a twice-tested swing high, participation surged as BPI pushed back above 50%, putting bulls in control. The rapid advance soon drove BPI above 70%—sometimes a warning sign, but here it confirmed strong participation behind the move. Over the following months, participation slowly faded, creating a divergence as price drifted sideways and BPI eventually slipped back below 50%.
Notice the yellow-shaded areas. Market structure still matters. Watch support and resistance to see whether buyers or sellers are truly in control. BPI can warn you when participation shifts, but price action must still confirm the move.
And that brings us to a few common mistakes traders make when using BPI.
Other Common BPI Mistakes to Avoid
Don’t immediately sell just because the BPI reads “overbought.” By the same token, don’t buy just because a BPI reading is “oversold.” Here’s when using other indicators and looking at market structure become critical.
Also, don’t ignore the regime state (the six that we just covered). Context is everything. And seeing things from a broader perspective can help you make smarter decisions.
A Few Insider Tips
If you haven’t already seen this, check it out. This is the Bullish Percent Indexes page in the Market Summary. You can check major indexes as well as sector indexes. I’ll refer to this in the following tips.
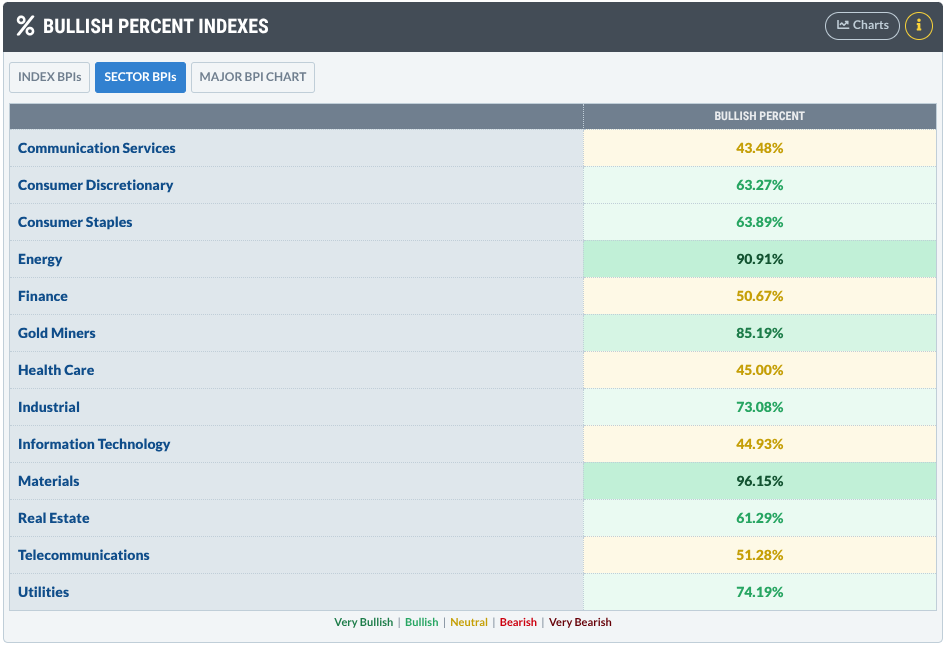
Insider Tip #1: Let BPI Help Set Your Bias. Before scanning for trades, check BPI first to get a picture of P&F participation levels. Above 50%, be prepared to lean bullish. Below 50%, anticipate playing defense. Then check the actual chart to see if that’s truly the case and if there are any opportunities to jump in.
Insider Tip #2: Spot Sector Rotation Early. As shown above, you can watch sector BPIs side by side. When one sector’s BPI rises while another falls, money may be rotating before price headlines notice. It’s a good way to get an early heads-up if rotation is taking place.
Insider Tip #3: Compare Index BPIs for Hidden Divergences. If the S&P 500 BPI is rising but Nasdaq or NYSE BPI is falling, leadership may be narrowing, and that’s a warning that the rally could be losing support.
Last thing: If you want to see a complete and updated list of all BPI symbols, check it out here.
And That’s a Wrap
There are quite a few breadth indicators that measure participation. The Bullish Percent Index is the only one derived from P&F signals, and that’s what makes it stand apart from the others. Use it alongside other indicators and participation measures to spot internal shifts in an index before they become obvious in price and trend.