StockCharts Insider: ChartSchool Hacks (How to Level Up Fast)
Before We Dive In…
If you haven’t spent much time exploring ChartSchool, we’re about to level up your capacity to learn and apply. First off, ChartSchool is massive. It’s one of the biggest technical analysis libraries out there, which is both a blessing and a curse. But no worries—this guide trims the fat. You’ll learn how to slice through ChartSchool without getting overwhelmed. We’ll cover what matters most, in the right order, and in a way that sticks.
ChartSchool: A Massive Universe of Actionable Knowledge
Hands down—ChartSchool is one of the best reference libraries on technical analysis. It’s so immense, you’re likely to stumble across something new every time you visit.
If you’re an experienced chartist, that’s exciting. If you’re brand new? It can feel like drinking from a firehose on full blast.
That’s okay. This piece is your shortcut. We’ll zero in on how to study indicators in ChartSchool without getting overwhelmed—fast, efficient, and comprehensive. I’ve tested the strategy, and here’s your map.
Think Toolbox, Not Textbook
You shouldn’t try to memorize everything in sequence. But you need enough structure to cover some basics. If you’re new to this vast universe of technical analysis, you’re likely to have gaps in your knowledge, which is natural. I’m going to suggest a basic path forward so that you can give it a try.
Insider Tip #1: Break It Up Into Chunks
You’re welcome to read the page from start to finish. Though comprehensive, it isn’t the most efficient way to learn how to use an indicator. Try this instead.
1 - Start with the “What”
What does the indicator do? For example, Accumulation/Distribution measures the flow of money going into a security; Bollinger BandWidth reflects the increase and decrease of volatility based on the upper and lower Bollinger Bands. This gives you the purpose of the indicator right away.
2 - Know the “Type”
Is it a trend, momentum, volume, volatility, or breadth indicator? Understanding the type places it in the bigger family tree so that you don’t treat everything as individual and isolated.
3 - Jump to “Interpretation”
How do you use it? This is where theory meets practice; where knowledge translates into action. But to make it work, you can’t just stare at the example charts. You actually have to do it yourself. And this brings us to the next section.
4 - Test It on Your Own Chart
Fire up a chart and try it with different stocks or ETFs. Experimenting with it matters a lot. This is where you learn hands-on.
5 - Circle Back to “Calculations”
You don’t need to understand the wiring to flip a light switch. Indicators work the same way. But sometimes knowing the math pays off. You’ll understand the logic better, and if you ever need to tweak the settings, you’ll know exactly what you’re changing.
Now that you know how to tackle the beast, let’s cover a few basics.
Insider Tip #2: Master These Three Things First
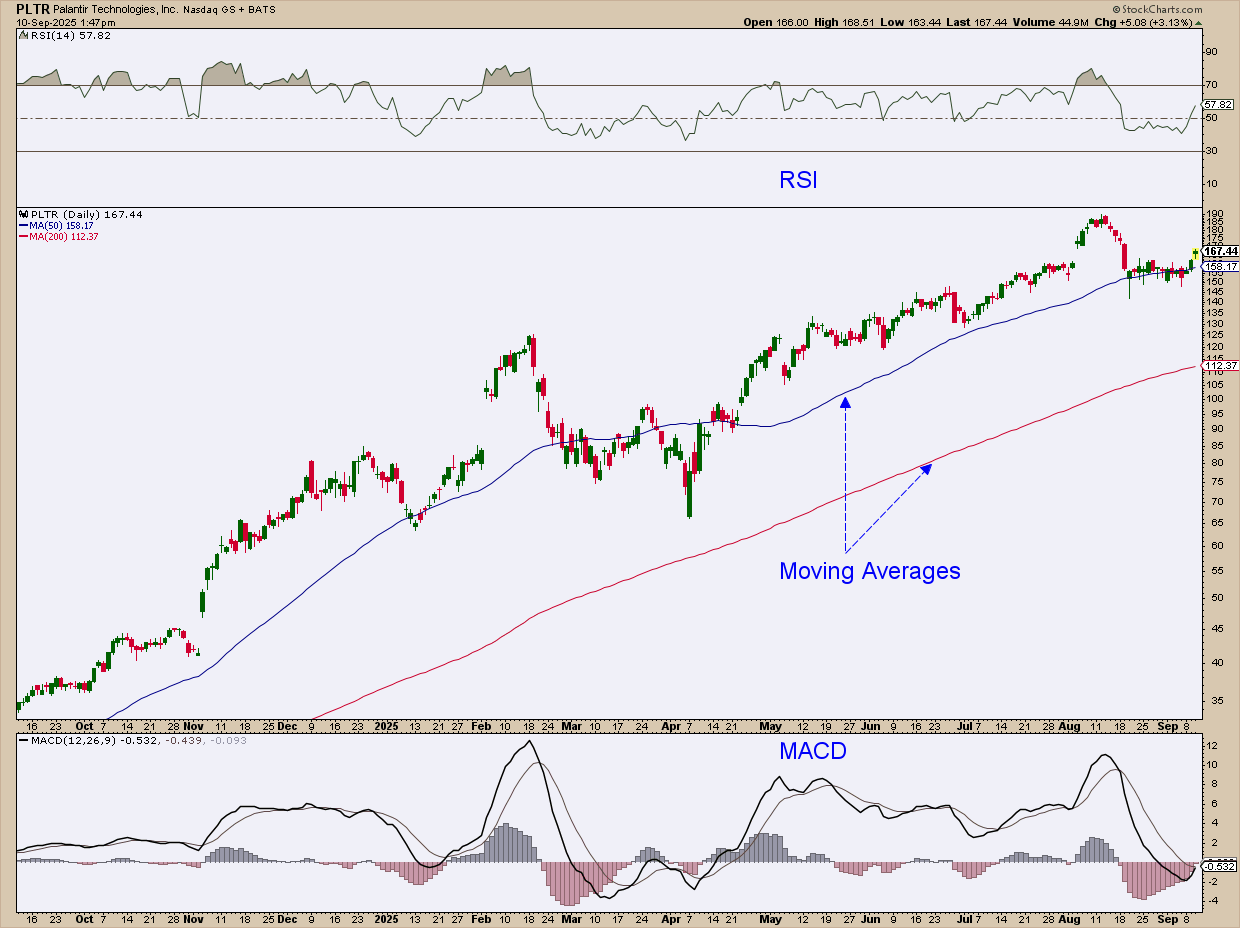
When you open up any charting platform, regardless of who the provider is, they typically feature three things: candlestick charts, moving averages, and a few basic momentum indicators.
It’s like your starter pack. You need to know these things before branching out.
1 - Candlestick Charts
You don’t need to memorize every single candlestick pattern (yet). What matters is that candlestick charts give you the clearest snapshot of price action—open, close, high, low—all in one bar. The body width makes levels easy to spot. If you’re not using them already, start now.
2 - Moving Averages
Never mind the dozens of variations. Start with the basics: simple moving averages and exponential moving averages. Not only are they go-to tools for spotting and gauging trends, they’re also the foundation for many other indicators. Learn these first. ChartSchool’s page is dense, but now you know how to cut through it.
3 - Basic Momentum (or Trend/Momentum) Indicators
I’m thinking specifically of the Relative Strength Index (RSI) and the Moving Average Convergence/Divergence (a.k.a. the MACD, which is both a trend and momentum indicator). These are your entry points. There’s a reason why they’re on the default setting of most chart platforms: they’re one of the most direct ways to see if a market is pushing higher, rolling over, or drifting downward.
Insider Tip #3: Apply the 80/20 Rule
Something to know: not all ChartSchool pages are created equal. They’re meant for different parts of your journey. While there is a series that addresses starting points, like John Murphy's 10 Laws of Technical Trading, there are other starting points as well.
Here’s what I suggest. About 20% of the indicators available to you can explain 80% of the price action in the market. Try working with these before wandering off into the forest:
- Trend: MAs, MACD, Average Directional Index (ADX)
- Momentum: RSI, Stochastic Oscillator
- Breadth: Advance-Decline Line (AD Line), McClellan Oscillator
- Volume: On Balance Volume (OBV), Chaikin Money Flow (CMF)
There are plenty of others, of course. There are also plenty of more advanced indicators within these categories. But the ones mentioned above cover a substantial part of each analytical angle.
Over time, you’ll start noticing variations and repetitions across indicators. This leads us into the next section…
Insider Tip #4: Look for Cross-Page Connections
Here’s where it helps to take notes in a notebook. Once you get deeper into the concepts, you’ll notice that many of them “talk to” each other.
For instance:
- RSI and CMF both flag divergences in their own way.
- OBV, a volume indicator, and the AD Line, a breadth indicator, both measure participation and pressure, but from different angles.
When you start seeing the overlap, you’ll realize that you’re not dealing with hundreds of entirely separate concepts, but just a handful of “families” who share similar ideas.
Insider Tip #5: Don’t “Study,” Do!
These aren’t theoretical concepts to shelve in your head. They’re actionable concepts meant for use. So get your hands dirty and experiment with them. Most of your time should be spent on your charts, trying and tweaking the settings until you’ve grown familiar with them all.
Here’s another tip: set sprints, not marathons. Try one new indicator a week. Try it on different markets and timeframes. Take notes as to what works and why.
And That’s a Wrap
So, you just went from “firehose” to “filter.” Now you can break down ChartSchool pages like a pro.
Bottom line: You’re no longer a passive reader. You’re charting with direction and a game plan. ChartSchool may be the toolbox, but your charts are the classroom. You’ve leveled up. Now go put it to work.


