StockCharts Insider: Crack the Code of Near-High Breakouts
Before We Dive In…
You’re about to see why traders obsess over 52-week highs, and why not all highs are created equal. I’ll break down what really happens when a stock hits (or hovers just below) that milestone. Even better, I’ll show you how to scan for them, and give you a few Insider Tips to supercharge that scan.
What’s All the Hype About?
Wall Street always seems to make a big deal out of a stock breaking above its 52-week high. Well, it can be a big deal, but it’s important to know why. And it’s also important to anticipate when such a milestone goes south.
3 Big Reasons 52-Week Highs Pack Heat
So, let’s talk about this. When a stock successfully breaks above its yearly high and follows through, three things happen:
1 – Break the ceiling: New highs shatter psychological barriers and often fuel momentum.
2 – Spotlight effect: Big money (aka, institutional buyers), media, and retail traders pile in, juicing liquidity.
3 – Trend stamp: Confirmation that buyers are in charge and the uptrend is alive.
So now, you get the picture. That’s why new 52-week highs are a big deal. So now you’re probably wondering what typically happens after a stock hits a new 52-week high.
What Typically Happens After a New High
1 - Momentum usually wins: Growth names pop fast, giants grind higher.
When a stock smashes a new 52-week high, it typically continues to rise further. In a bullish market or a strong sector rally, trend-followers and momentum investors tend to pile in, pushing prices higher.
Another thing to note is that smaller growth names often pop the most, while mature giants tend to climb at a slower pace. Different players, different gears.
2 - Now, the catch - not every high sticks: Sometimes that new high turns into resistance, especially when trading volume is thin or profit-takers cash out early. That’s when false breakouts creep in.
3 - Overextended? High flyers often need a breather above their long-term averages: If a stock’s already stretched way above its fundamentals or long-term averages, such “high altitude” often comes with a dip, even as a temporary “breather.”
Still, the momentum edge makes new highs worth watching. The real trick is spotting stocks on the verge — the ones hovering just below their peaks. So, how might you go about doing that?
Scanning for Stocks on the Verge of a New 52-Week High
The good news is that there’s a scan designed for this purpose. Developed by StockCharts’ Grayzon Roze, you can find a scan in the Stockcharts Sample Scan Library called Within 10% Of New 52-Week High (S&P 1500).
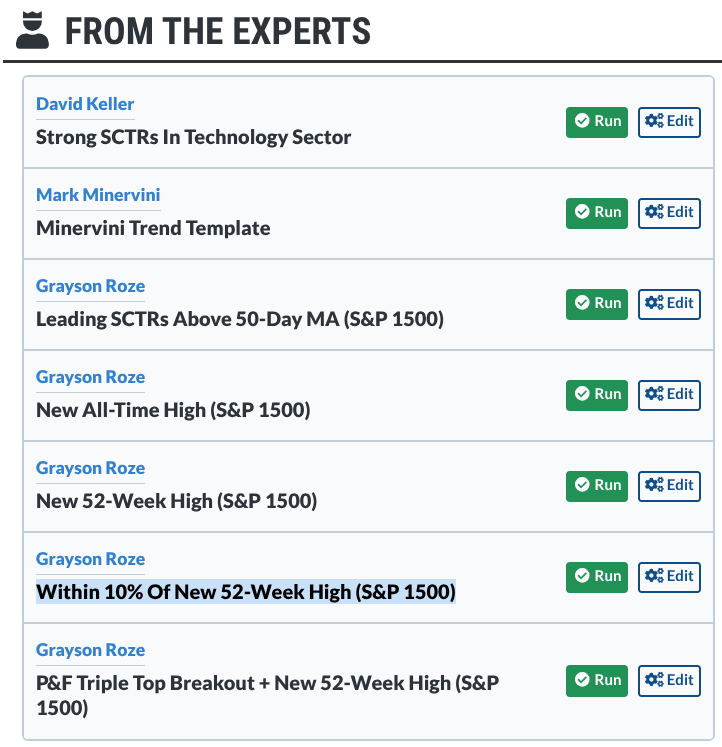
The bonus here is that it covers 1,500 stocks (S&P 1500), not just the 500 you always hear about, giving you a broader universe to catch potential breakouts before they hit.
Let’s take a closer look. To run the scan, I clicked Edit and then, in the next window, clicked Run; this gives me the most current, real-time list (rather than the previous end-of-day list). At the time of writing, I found a total of 621 matches (out of 1,500 stocks). To sort these results, I categorized them by Volume, to get the most liquid stocks, and paid close attention to the StockCharts Technical Rank (SCTR) scores to zoom in on technical strength.
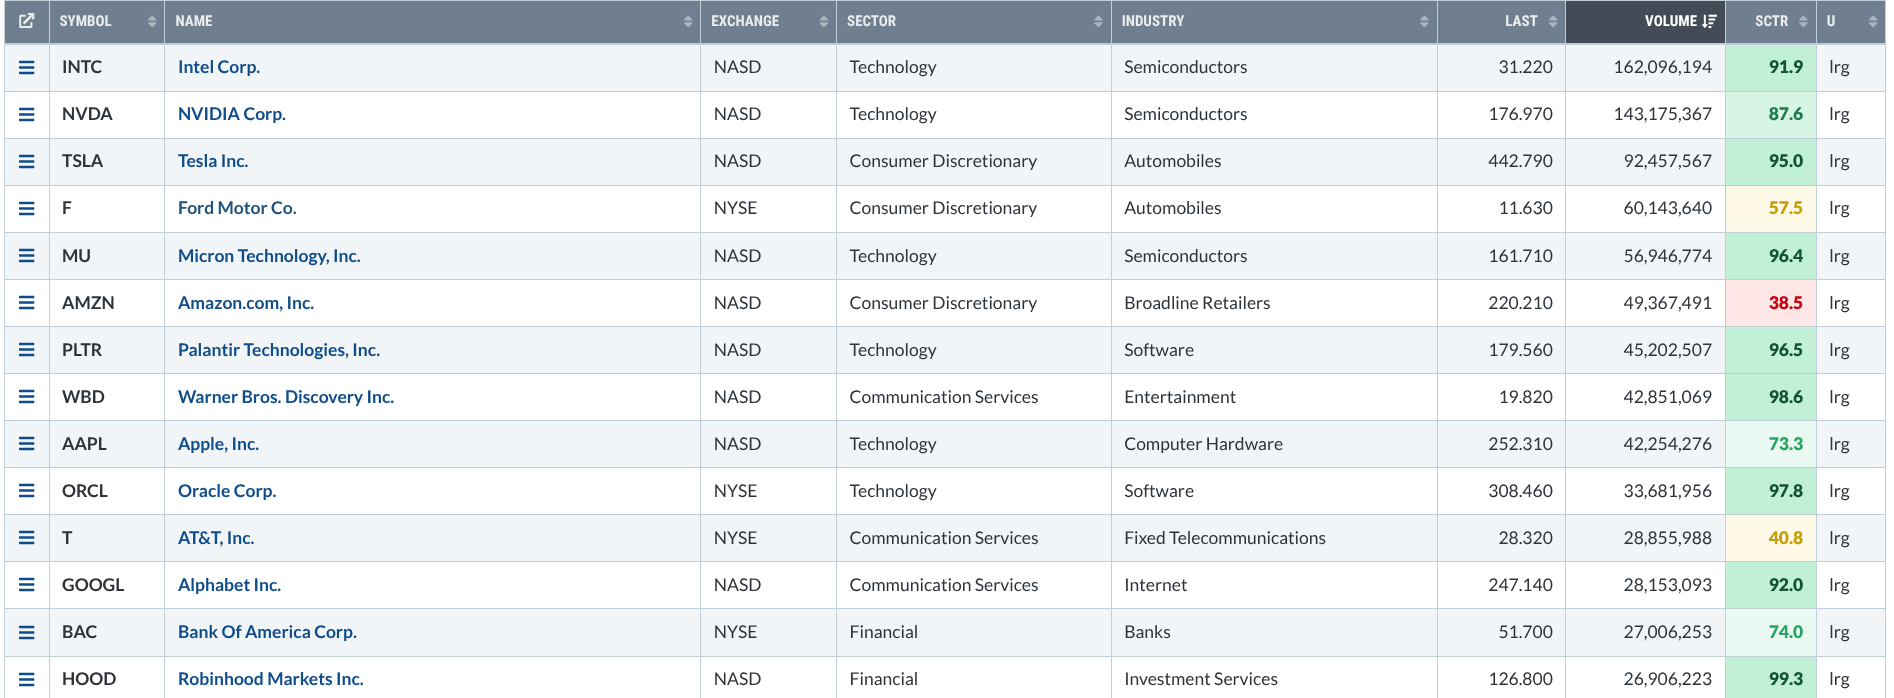
From the scan’s top five, let’s pit two very different names side by side.
- NVIDIA Corp. (NVDA)—2nd on the list, still flexing its momentum muscle.
- Ford Motor Co. (F)—4th on the list, showing a completely different kind of setup.
If you start clicking on the names to pull up the charts, you’ll notice that the price action profiles will often be very different. And that’s the point: 52-week high scans don’t just surface “winners,” they highlight contrasting price action scenarios worth dissecting.
Insider Tips to Supercharge Your Scan Results
Before we compare these charts, here are a few Insider Tips to make this even more effective.
- Insider Tip #1: Plot Price Channels set to 52 weeks and keep the Price Labels on. Now, you can instantly see the highs and how they’ve evolved over time (no squinting or guesswork required).
- Insider Tip #2: Add Chaikin Money Flow (CMF) or another volume-based indicator. It gives you a quick read on buying vs. selling pressure. Rise in buying pressure = accumulation fuel. But remember, pressure can flip fast.
- Insider Tip #3: Overbought readings in the Relative Strength Index (RSI) can signal strength, particularly in an uptrend, and pullbacks can signal buying opportunities when the RSI dips but stays above 50 (but you can be slightly flexible with that rule depending on the context).
Same Scan, Totally Different Stories
Let’s start off with the Ford chart.
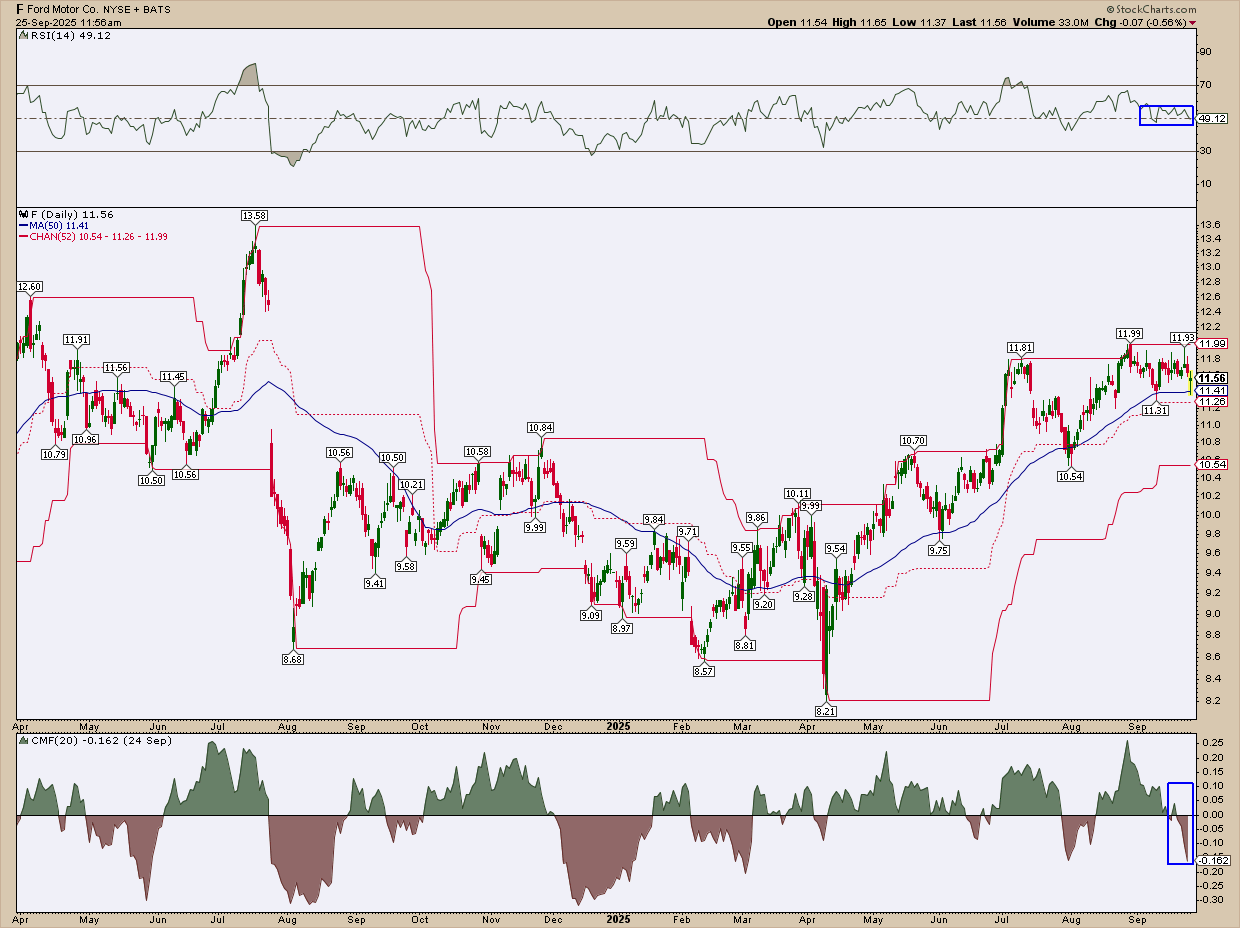
Ford (F): A Breakout Candidate in the Making?
- The chart of F stretches back 18 months, so some highs on the left are beyond the 52-week mark.
- F just tagged a fresh 52-week high but pulled back, now hovering near a potential breakout.
- Since April, price has leaned on the 50-day simple moving average (SMA) as support (classic buy-the-dip behavior in an uptrend).
- RSI: Pulled back from overbought, which can hint at renewed strength if F clears the high.
- CMF: Flashing heavy selling pressure—worth keeping an eye on.
- If it does break, $13.58 (2-year high) is likely to serve as a strong resistance level.
Main takeaway: Scan did its job here, surfacing a legit breakout setup. Next stop: NVDA.
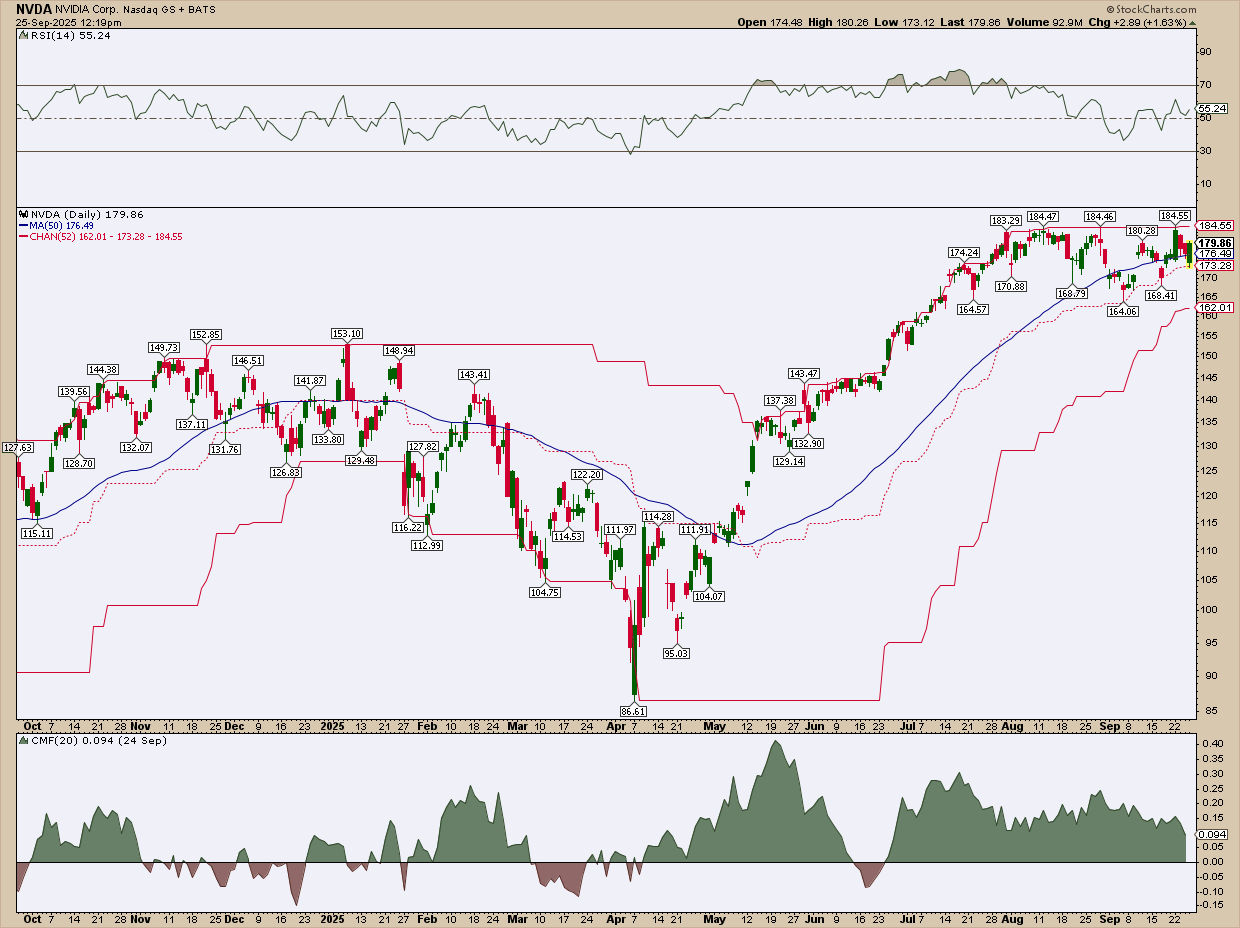
NVIDIA (NVDA): At the Top of the Mountain
- Current highs aren’t just 52-week highs—they’re all-time highs.
- Price is consolidating near the top.
- RSI: Pulled back after ~3 months in overbought territory—could this dip be strength in disguise?
- CMF: Still positive, signaling bulls remain in control.
- Bullish dilemma: Wait for a breakout above the high? Or buy now with a stop at the bottom of the Price Channel?
Main takeaway: I’m not pushing a setup. The scan highlights a range of price action contexts—and with 621 names on the list, you’ve got plenty of opportunities to explore.
And That’s a Wrap
52-week highs can generate buzz, but they’re more than that. They provide signals. Some breakouts skyrocket higher while others fizzle. The edge comes from spotting potential movers before the crowd. With the “near-high” scan in your arsenal, you’ve got a ready-made watchlist.
Your job? Cut through the noise and zero in on the setups that fit your playbook.


