StockCharts Insider: The Cloud Hack Many Traders Overlook (But Shouldn’t)
Before We Dive In…
Here’s today’s play: you’ll run the Entered Ichimoku Cloud scan to spot buy-the-dip candidates, use the SCTR to find the strongest stocks, and then you’ll flip to the charts to see which candidates may be worth pursuing. Plus, you’ll learn how to avoid falling knives and coin-flip trades. Sound good? Let’s get started.
Here’s the Catch: Dips Aren’t Always Deals
We’ve all heard the now-cliché mantra of successful trading: buy low and sell high. By that logic, the lower you buy, and the higher you sell, the better the outcome, right? But you've got to pull it off the right way. Otherwise, you’ll get caught in a shower of falling knives.
This leads us to today’s “insider” tip: How to find strong dip setups using an indicator most traders ignore—the Ichimoku Cloud. Bonus: We’ll pair it with a scan to speed things up and cast the net wide for the search.
Meet the Cloud
In case you’re not that familiar with the Ichimoku Cloud, here’s a little context. Goichi Hosoda, a Japanese journalist—not a trader, not a quant (neither was Charles Dow a century earlier)—spent decades testing this thing before dropping it in a book in 1969.
Anyway, he wrote under the pseudonym Ichimoku Sanjin, which roughly translates to “what a man in the mountain sees in one glance.” And that’s the point of the indicator—to see everything with a bird’s-eye view, at a glance.
The Ichimoku Cloud can look like colorful spaghetti at first. But here’s the twist: you don’t need the whole plate—just the Cloud (capital C from now on).
An Effective Cloud Hack (That Many Ignore)
You’re going to learn how to use this effective Cloud combo, pairing the indicator with a scan to find strong stocks in decline. Here’s the game plan:
- Step 1 - Run the Entered Ichimoku Cloud scan from the Sample Scan Library.
- Step 2 - Read the Cloud to identify dips on down days.
- Step 3 - Layer in extra tools to dodge falling knives and lock in on strength.
Step 1 - Run the Scan
The scan is at the top of the list for the Ichimoku Patterns scan.
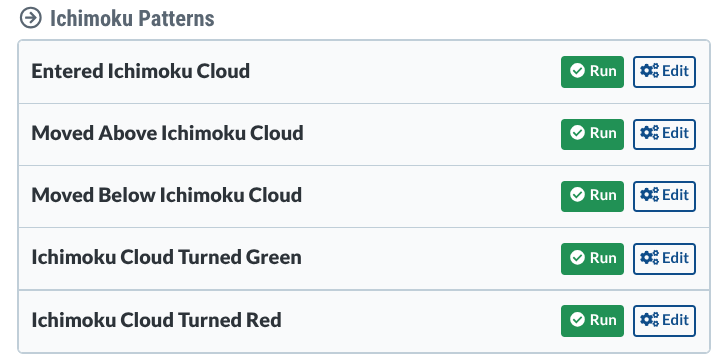
If you click the Run button, the information retrieved is based on end-of-day data, which works fine for this scan. Here’s what I got.
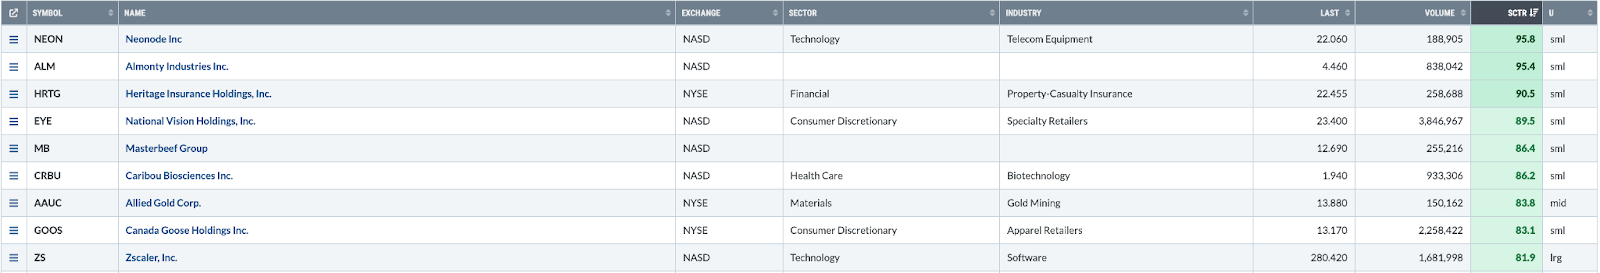
Step 2 - Sort the List
If you organize your results by volume, you’ll get the largest stocks first. I decided to organize it by StockCharts Technical Rank (SCTR) so that I can have stocks listed by technical strength first, before selecting by volume.
I spotted Zscaler, Inc. (ZS), a cybersecurity company. Say I pick ZS as a candidate. Now I have to see if it’s pulling back and if the price action is favorable enough to consider a potential buy.
Step 3 - Chart it
Let’s switch over to a daily chart.
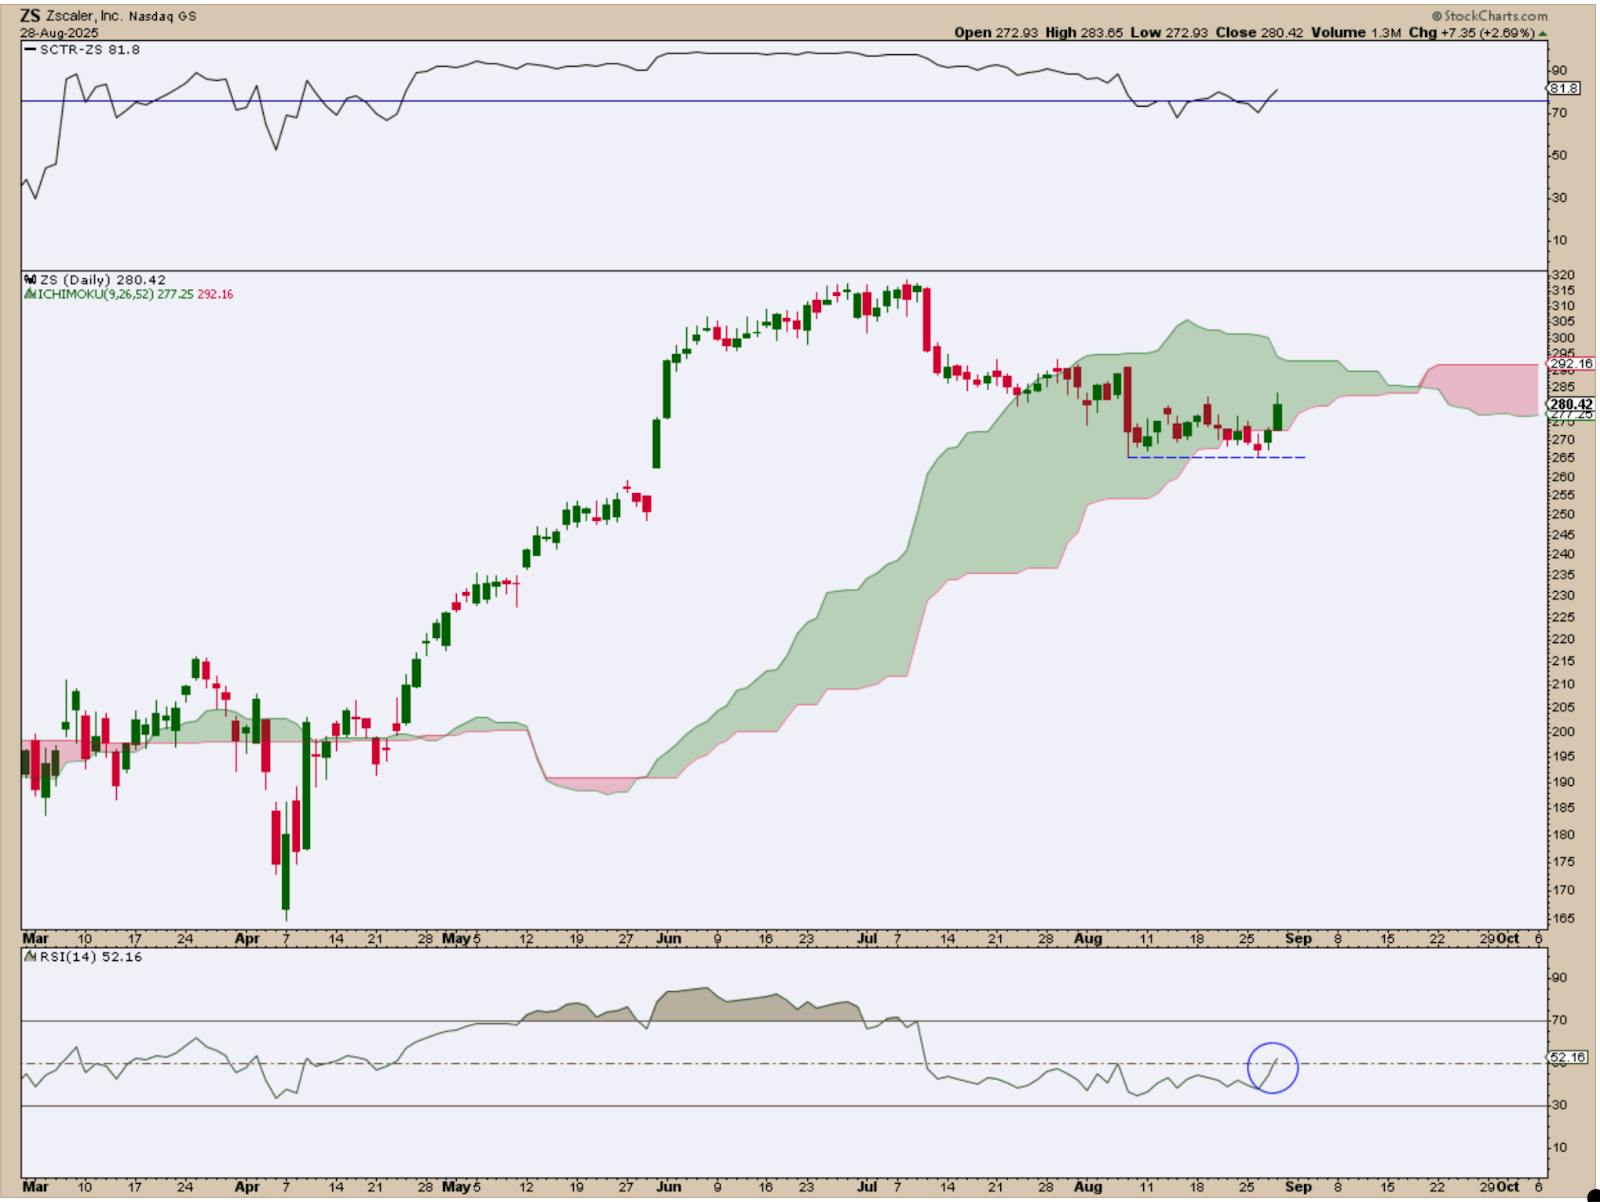
Just as I had hoped, ZS entered the Cloud on a pullback, found support (see the blue dotted line), and is now attempting its next leg of the rally. The Relative Strength Index (RSI) recently passed above the 50-line, indicating there’s plenty of room still to run, should ZS continue its climb. The SCTR line, shown above the chart, is above the 76-line, which is my preferred way of gauging the upper end of technical strength.
So, if I were interested in ZS, I’d probably consider this to be a favorable condition to buy, from a technical standpoint.
But the main goal here is to show you the process using the Entered Ichimoku Cloud scan to find buyable dips. And I think this does a decent job of demonstrating the process.
The Cloud’s Ups and Downs
The Ichimoku Cloud is sort of like a market compass. But it’s NOT a GPS. It can’t predict the economic weather, but, like a radar, it does a decent-enough job spotting storms and clear skies. With that said, here are a few pros and cons to consider:
PROS
- Vista point: You can see trends along with a broad layout of support and resistance at a glance.
- 26-period forecast: The Cloud projects 26 periods ahead to map future zones, presenting a handy support/resistance forecast.
- Trend-friendly: It works really well when markets are trending.
- Easy visuals: Thick = strong trend, thin = fragile trend; green = bullish, red = bearish.
CONS
- It can lag: A good portion of the signals are based on past data, which can make it lag.
- Shifting winds: Cloud projections can shift as new data comes in, so treat them as guides, not guarantees.
- Chop trap: Choppy markets? Watch out. You’ll get whipsawed.
- It helps to have backup: Works best when paired with volume or momentum indicators; in short, though designed as a standalone indicator, it can be enhanced.
What I personally value the most about the Cloud is its varying range of support and resistance. Not only is it more realistic than narrowing support/resistance to a single price level, it also gives me plenty of wiggle room to adjust entries and exits.
Give the scan and the Cloud a try. Play around with it and see if it resonates with your pullback strategy.
Bonus “Insider Tips”
- Earnings Calendar Cross-Check
Ichimoku conditions can be sensitive to earnings surprises, among other economic news. A stock sitting in the Cloud right before an earnings release is a coin flip at best, especially when that Cloud is thin. Don’t roll the dice. You can check earnings dates and other fundamental data using StockCharts’ Symbol Summary, like I did here.
- Shadow Signals with ADL
Plot the Accumulation/Distribution Line (ADL) behind price as a volume “shadow.” If ADL rises while price lags, that’s stealth accumulation—a bullish tell that buyers are still loading up on shares. If ADL sinks while price holds up, that’s distribution—a bearish warning that sellers may be unloading into strength.
And That’s a Wrap
The Ichimoku Cloud may have an exotic-sounding name, but it isn’t a mystical fog. It cuts through the complexities of the price action to provide a wide perspective on what happened, what’s happening now, and what might happen in the near future. For our purposes, we want to see how it can help spot pullbacks worth buying (or storms worth dodging). Paired with the Entered Ichimoku Cloud scan, you can do this much faster and more efficiently. Does it give you an edge? It can, but only if you put it to work.


