StockCharts Insider: The Five Questions That Bring the 10 Laws Together
Before We Dive In…
After John Murphy’s 10 Laws, a nagging question remains: where do you actually begin once you’ve loaded your chart? Maybe you weren’t expecting it, but the answer isn’t an indicator or setup. Instead, it begins with a sequence of questions.
You see, Murphy’s Laws work because they focus on structure before timing; context before action. In this final article, we’ll combine all ten Laws into a clear decision system that asks the right questions in the right order.
1 - Is There a Trend at All?
Before you look for a setup, plot an indicator, or choose a strategy, you have to answer one structural question: Is the market trending, or is it rangebound? The importance of this distinction can’t be overstated: it determines everything that follows.
Relevant Laws:
- Law 1: Map the Trends
- Law 2: Spot the Trend and Go With It
- Law 9: Trend or Not a Trend (ADX)
Laws 1 and 2 establish directional bias across timeframes. Law 9 (ADX) determines whether direction even matters right now.
What do you think?
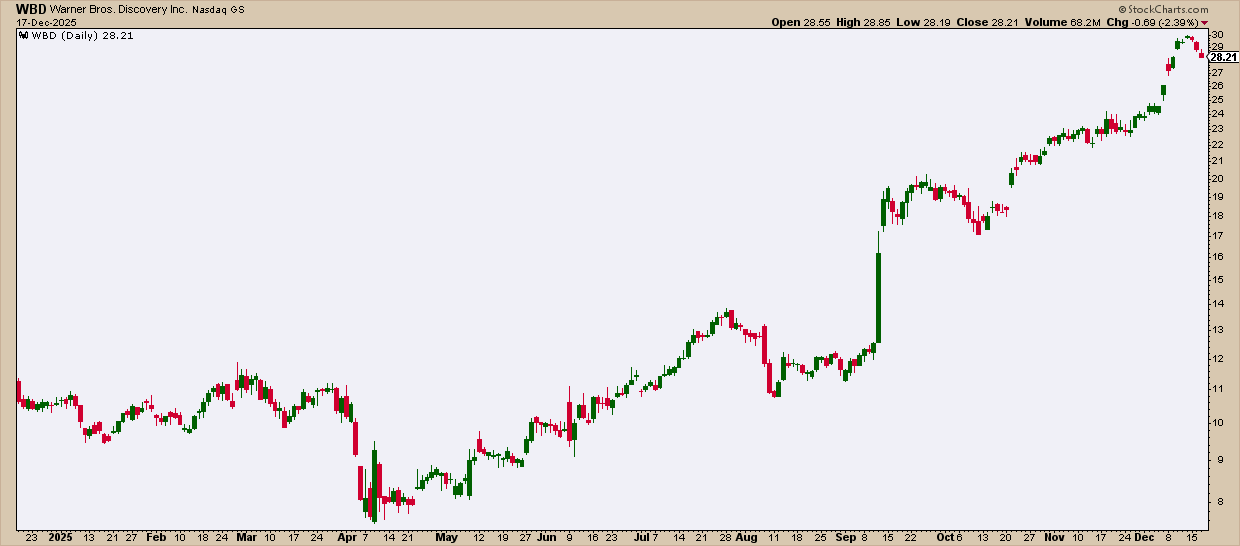
Take a look at this chart of Warner Bros. Discovery Inc. (WBD). The uptrend is obvious, but how strong is the momentum driving it? And notice where WBD is pausing right now, as of this writing. How might you interpret that?
2 - Where Am I Within the Structure?
Once you’ve spotted a trend (or lack of one), the next question concerns where you are: Is it extended, corrective, or near a decision point?
Relevant Laws:
- Law 3: Find the Low and High of It
- Law 4: Know How Far to Backtrack
- Law 5: Draw the Line
What does this set of Laws do for you? Collectively, they trace the market’s memory. They remind you that a pullback isn't a weakness by default, and that a rally doesn’t always signal strength. With that knowledge, you know when to avoid an extended move and when to pull the trigger.
You can better assess a pullback as an opportunity or warning. In short, you can anchor your decisions on structure rather than emotion.
What do you think?
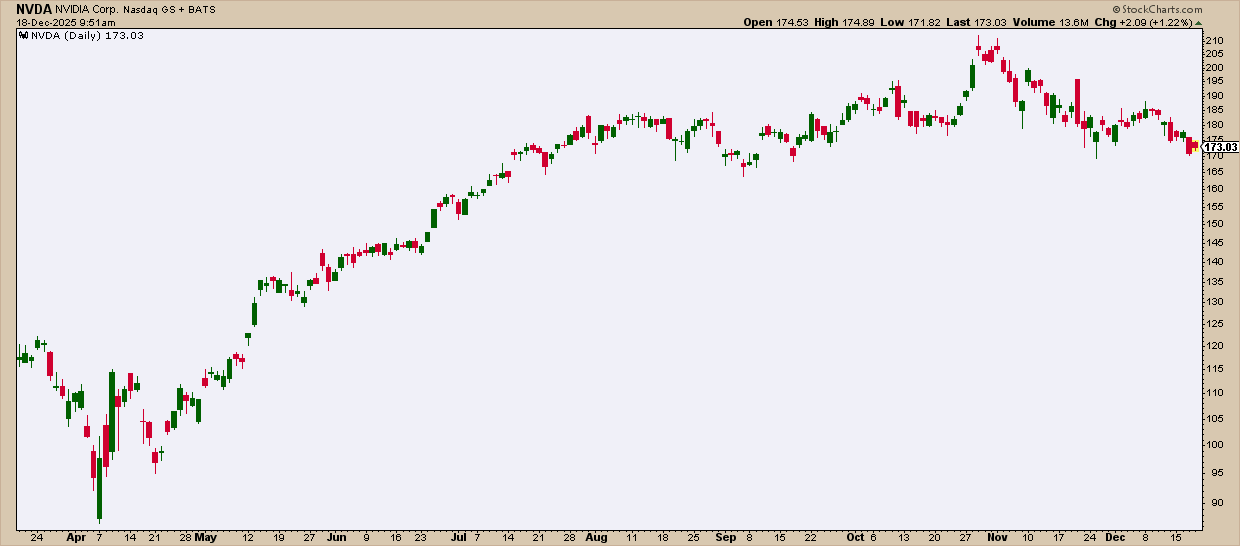
Suppose NVIDIA Corp. (NVDA) dips below $165. Is it a buyable dip, or a falling knife to avoid? If you think it’s a dip, where are the bulls likely to jump in, and why?
3 - Is the Trend Still Intact?
Markets typically don’t reverse in an instant. They degrade. So, when price starts turning down, you need a filter to help see if the prevailing structure is still being respected.
Relevant Law:
- Law 6: Follow That Average
When a stock starts turning lower, the key is understanding what that decline means across the short-, intermediate-, and long-term horizons.
What do you think?
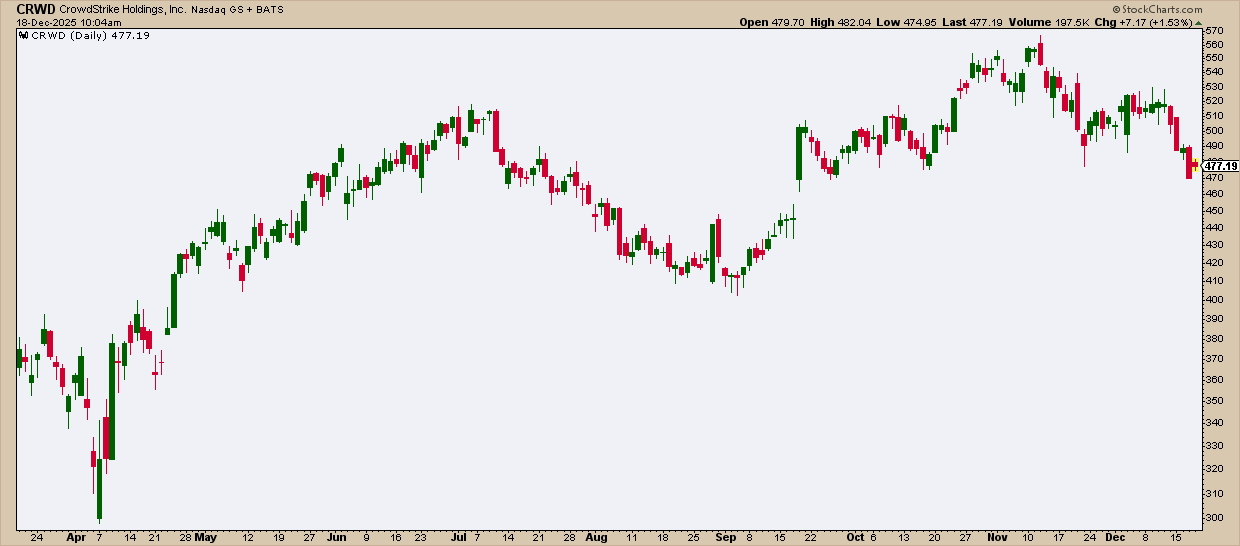
Here’s a perfect example. Is CrowdStrike Holdings, Inc. (CRWD) in an uptrend or downtrend? Where’s the critical level, and why?
4 - Is Momentum Confirming the Move or Raising a Red Flag?
Momentum indicators may not tell you where price is going, but they do tell you whether pressure is building in its favor, or fading.
Relevant Laws:
- Law 7: Learn the Turns
- Law 8: Know the Warning Signs
Law #7 highlights oscillators that help identify potential conditions of overextension. Law #8 focuses on the MACD, which is a unique tool that bridges momentum and trend.
Used correctly, they can warn you before price reacts, confirm strength during continuation, or signal exhaustion before an advance turns. They also help you assess whether a stock may be overbought, oversold, or quietly losing momentum.
What do you think?
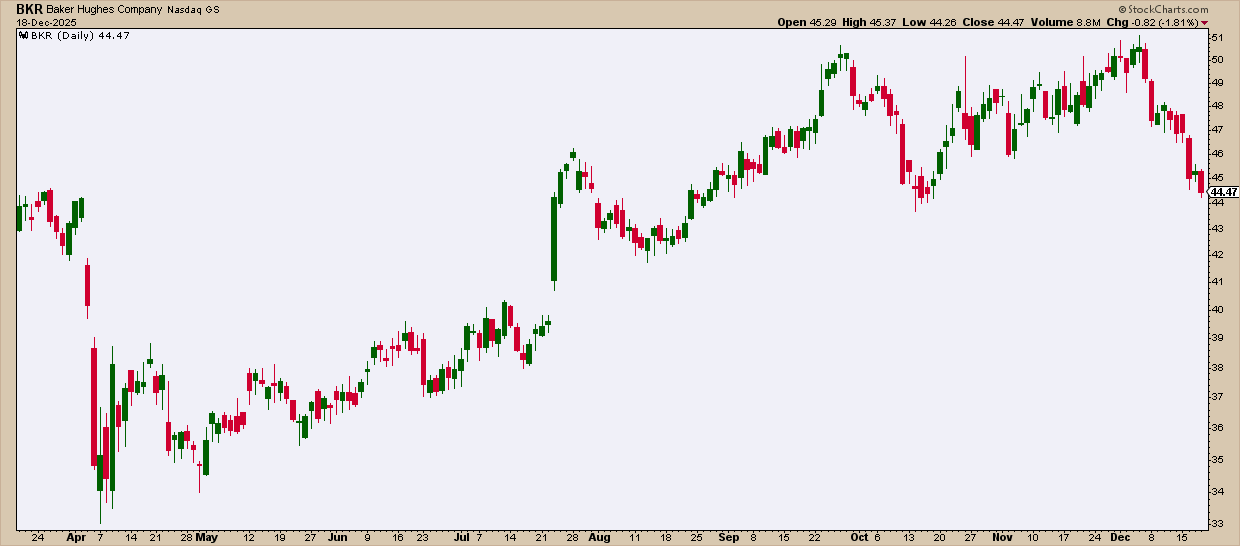
It appears as if Baker Hughes Company (BKR) had been experiencing a healthy trend. Price-wise, yes, but can you spot any divergences?
5. Is Volume Confirming the Move?
At the end of your decision chain, it helps to confirm if money is supporting the move. Price can still move without conviction, but a healthy trend can’t persist without real participation. And volume provides one of the clearest windows into market participation.
Relevant Law:
- Law 10: Know the Confirming Signs
You’re probably wondering why John Murphy put volume last. No matter what your setup might say, volume will either validate or undermine your thesis.
It helps answer questions like: Is the breakout supported, or hollow? Is a trend strengthening, or tiring? Keep in mind that there’s no sustainability without conviction, and price movements without volume are fragile.
What do you think?
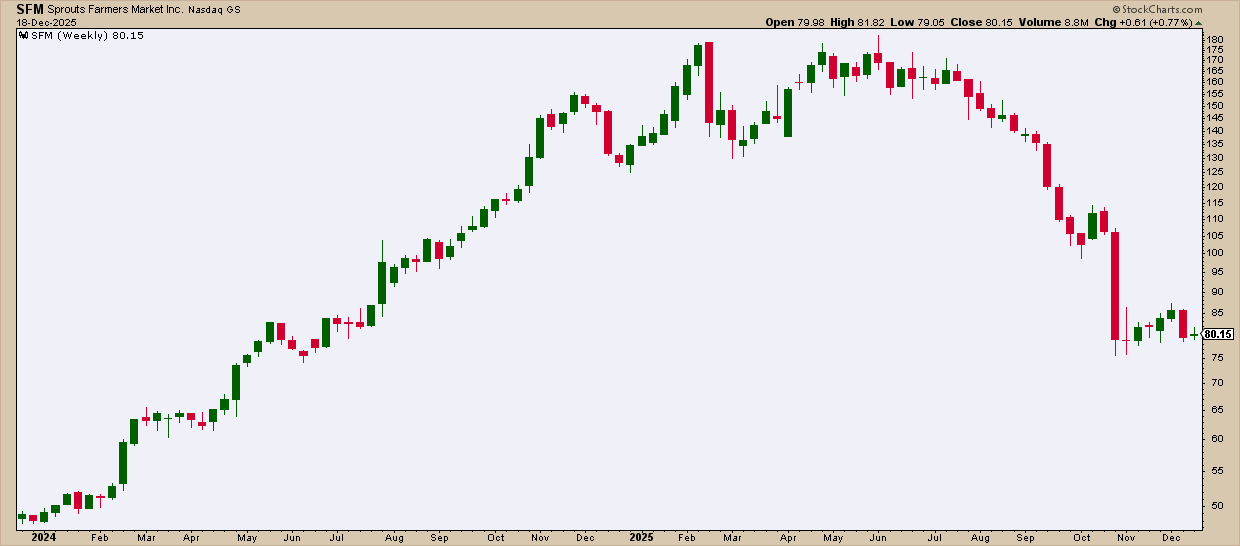
Sprouts Farmers Market Inc. (SFM) has been trending up since 2020. But as it approached its final leg, might you have been able to anticipate the reversal?
And That’s a Wrap
If you read John Murphy’s 10 Laws closely, they’re really about asking the right questions in order to choose the right tools to assess the market. By organizing those Laws into a simple, five-question sequence, you shift your focus from prediction to evaluation, and from reaction to anticipation. The tools stay the same, but the way you view the market, and the way you apply those tools, is where real expertise is built.


