StockCharts Insider: Why Should I Trade This Stock and Not That One?
Before We Dive In…
You’re looking at two stocks. Both seem promising. Both are starting to move. But which one do you trade? Spend five minutes on social media forums and you’ll see this question pop up everywhere. Many traders choose based on the story, the brand, or whatever’s trending. But that’s a popularity contest, not a sustainable process.
Let’s switch it up. First, try identifying the outperformer and the laggard. After that, compare both to the benchmark S&P 500. Then check momentum and money flow before drilling down into price action setups. We have tools for that, and it’s what I’m going to show you.
No need to get stumped every time you reach this decision fork. Let’s build a simple workflow to get through it.
Step 1 - Start with PerfCharts to See Who’s Actually Ahead
Someone says it’s time to buy NVIDIA Corp. (NVDA). Another person says that Advanced Micro Devices, Inc. (AMD) is gaining traction and may be the better trade.
Well, let’s see how they’ve performed over the past year and compare that to the S&P 500, using SPDR S&P 500 ETF (SPY) as our proxy.
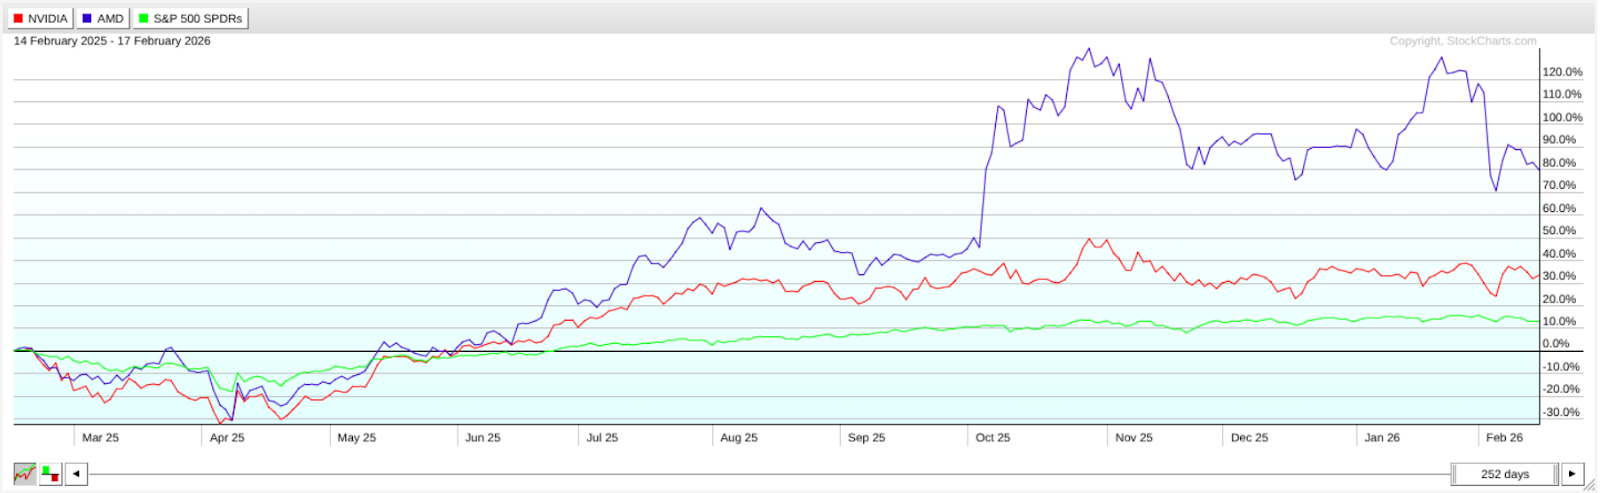
Right off the bat, this removes emotional bias.
- AMD’s the clear leader. It’s up by 80% since a year ago.
- NVDA’s the underdog. Sure, it has the largest AI chip market share, but it’s up only 30%.
- Both are outperforming the S&P 500, which is up a little over 10%.
Mini insight: Outperformance isn’t permanent. But it gives us a clue.
Don’t stop here, though; you still need to see it from a few more angles. So let’s switch over to the individual charts, starting with AMD.
Step 2 - Use Ratio Charts to Zoom In On Leadership
Here’s how to set it up:
- Pull up a chart of AMD.
- In the indicator panel, add three Price Performance indicators.
- Enter the symbols to compare each stock with one another, and each with the S&P 500:
For example:
- AMD:NVDA -> Is AMD outperforming NVDA?
- AMD:SPY -> Is AMD beating the market?
- NVDA:SPY -> Is NVDA beating the market?
A rising ratio means the first symbol is outperforming the second. A falling ratio means it’s lagging.
The important thing is that these steps answer two critical questions:
- Is it beating its closest competitor?
- Is it adding value beyond just owning the index?
Here are the comparison ratios that I came up with.
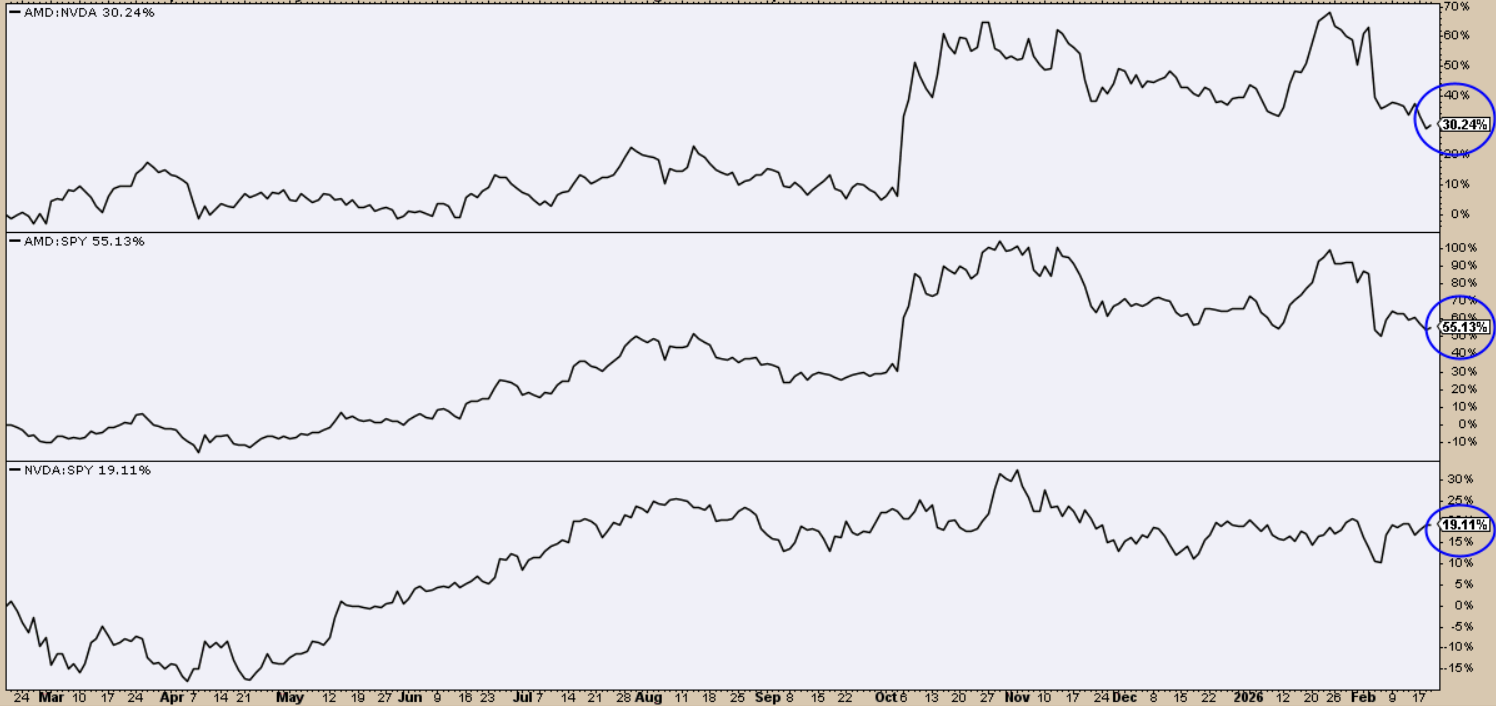
This shows what we saw using PerfCharts, here from a more comparative angle. As you can see, the ratio shows AMD gaining relative ground against NVDA and the S&P. You may notice, however, that its lead over both is starting to falter. NVDA is also leading the S&P to a lesser degree, but its ratio remains within a steady, sideways range.
So, do you buy the leader, or is the underdog about to gain enough traction to challenge that leadership?
Step 3 - Check Momentum, Volume, and Market Structure
A quick checklist might go like this:
- Is the Relative Strength Index (RSI) within the bullish range of 40 to 70+?
- Is volume or buying pressure positive (I like to use the Chaikin Money Flow for this)?
- Is the current trend moving up, down, or sideways?
Let’s take a look.
I’ll just say it straight:
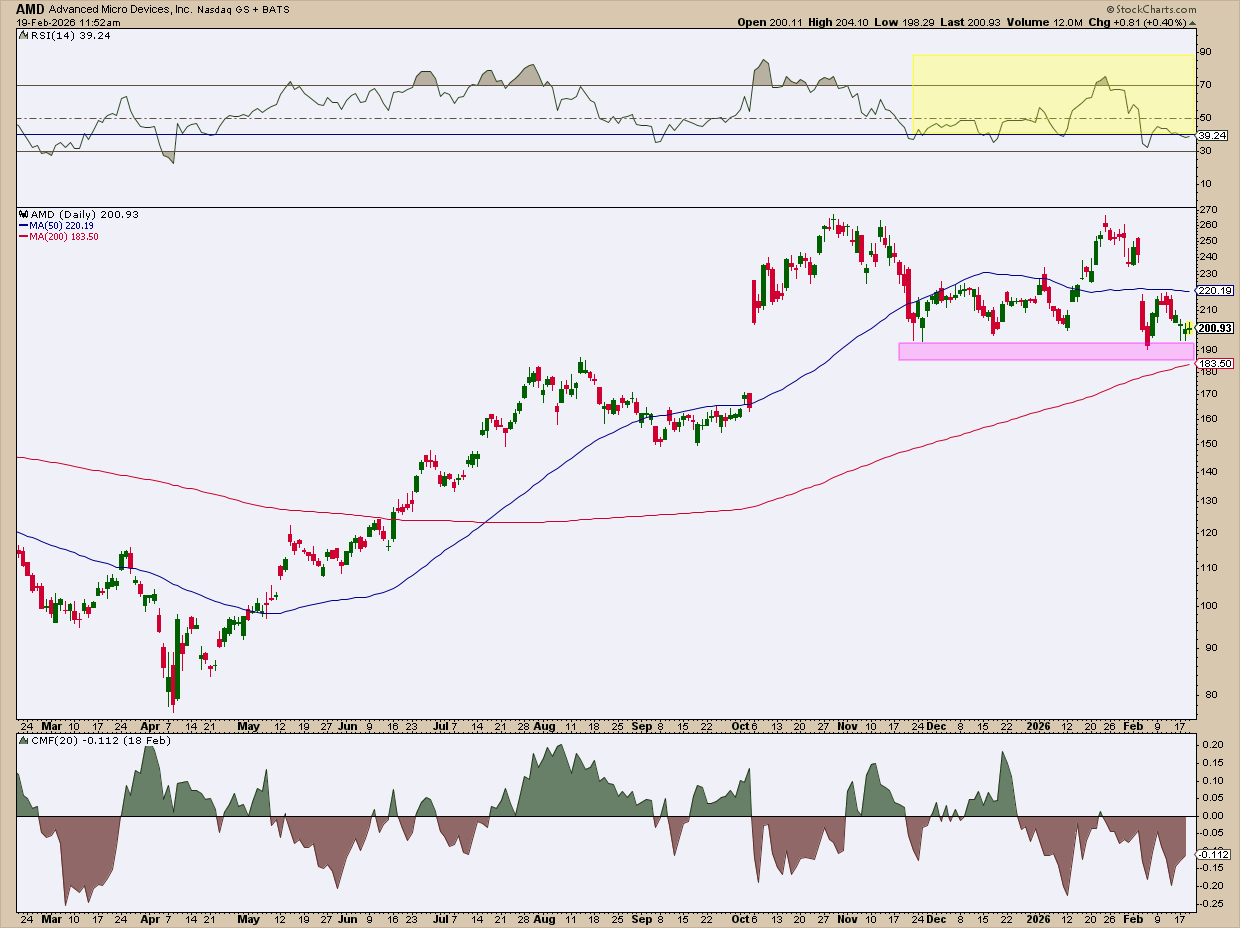
- The RSI is not within bullish range as it’s constantly dipping below 40.
- Selling pressure is strong, as the Chaikin Money Flow (CMF) is below the zero line.
- While price appears to be finding support near the $190 range, just above the 200-day SMA, AMD is trading in a range with no clear sign of upward momentum.
So, the verdict, at least in my book, is to wait and see how AMD develops over the coming days to weeks. In short, no trade.
Now, let’s look at NVDA.
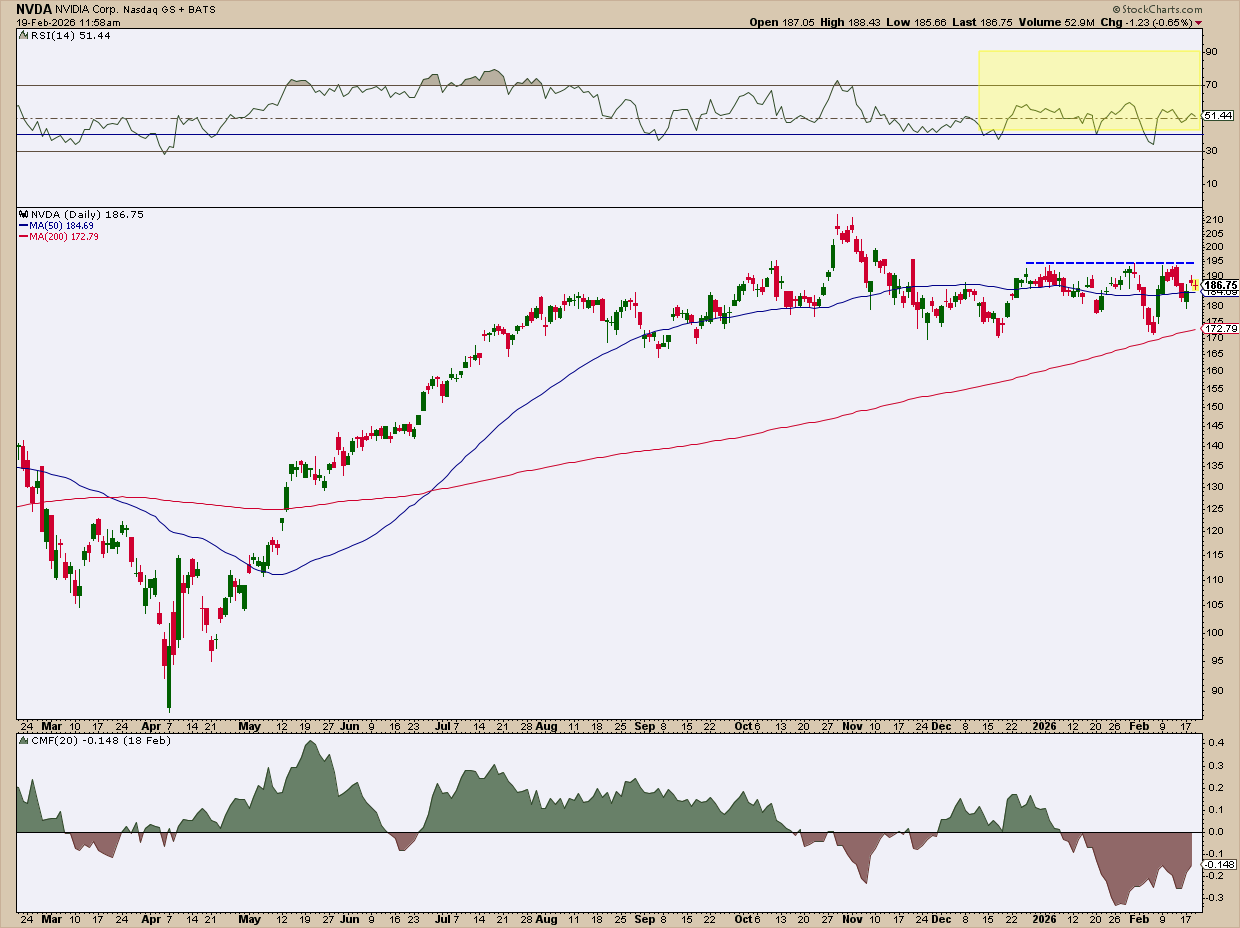
This looks similar to AMD, but with minor differences:
- The RSI is moving sideways with slight dips below 40. I’d like to see RSI hold above 50 and begin expanding toward 60–70. For now, that’s not happening.
- The CMF is deep in the negative. I’d like to see this move above the zero line.
- NVDA is trading in a narrow range, but a near-term resistance level at $195 is worth watching for a breakout. If price breaks out, you’re likely to see shifts in the RSI and CMF.
My final verdict? Also wait and see. Sometimes, no trade is the best decision.
I just want to remind you that the main point isn’t AMD or NVDA. It’s the process of comparing two stocks using these tools. As the legendary trader Jesse Livermore was once quoted: "It never was my thinking that made the big money for me. It was always my sitting tight."
Insider Tip: Use This Five Test Framework
- Performance Test: Which asset is leading and lagging?
- Benchmark Test: Is it outperforming or underperforming the S&P 500?
- Momentum Test: Is it within the RSI’s bullish range?
- Volume Test: Is volume bullish or bearish?
- Market Structure Test: Is it trending or moving sideways, and where are the key support and resistance levels?
If a stock fails multiple tests, then you might want to sit tight. If it passes most of them, then enter carefully and be sure to set reasonable stops.
But What If They’re Both Strong?
In this case, you might select the one with the stronger trend, SCTR score, or growth prospects based on various fundamentals, which you can access in the Symbol Summary page.
Also, consider allocating between the two. Remember: when you buy a stock, you’re assuming the business risk of that one company. It may be wiser to spread that risk across two companies instead of one. That’s diversification.
And That’s a Wrap
If you’re stuck deciding between two stocks, you just need a simple process to compare them. Keep in mind that the edge isn’t in the story. It’s in the structure. When you compare performance, ratios, momentum, volume, and trend, the decision becomes much clearer. That’s the advantage of having a repeatable framework.