Taking Stock of the Small-Cap Record High: Here's How High IWM Could Go

Key Takeaways
- The Russell 2000 ETF finished at a weekly all-time high last Friday.
- Mike outlines the bull case based on the charts and an IWM upside price target.
- However, not all small-cap indicators confirm the advance.
I opined on small-caps shortly after Jackson Hole in August. A “show-me story” is what I dubbed the modest stretch of outperformance for both the iShares Russell 2000 ETF (IWM) and S&P SmallCap 600 ETF (IJR). After last Thursday’s thrust to a new all-time high and Friday’s marginal fresh record weekly close, the space warrants a second look.
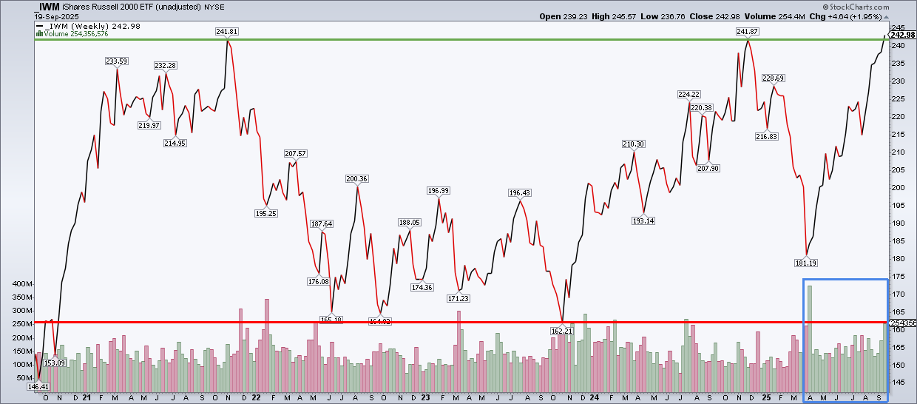
Persistent Strength in IWM
For a long-term IWM view, I applied the volume profile on SharpCharts. I prefer to overlay the indicator with price to capture more information. Remarkably, the Russell 2000 ETF has been up in all but three weeks since early April. It’s a global small-cap phenomenon, too, as the Vanguard FTSE All-World ex-US Small-Cap ETF (VSS) has been on a torrid ascent of its own since the early-Q2 volatility event.
Sticking with the domestic story, many traders likely still doubt IWM. The fund notoriously holds about 40% in unprofitable companies. I’d call out that on a cap-weighted basis, as that figure is more like 27%, according to data compiled by WisdomTree. Nevertheless, the low-quality nature of IWM is a worrisome factor to consider.
Macro Backdrop: Fed Policy and Small-Cap Growth Potential
Fundamentally and at the macro level, Chair Powell and the rest of the Fed’s voting members appear content with allowing the U.S. economy to “run hot” over the next several quarters. Inflation near or even above 3% would have been a headwind for the rate-sensitive small-cap area, but that might no longer be the case. So long as it comes with a backdrop of stable near-term borrowing costs, then small-cap companies may be in prime position to grow. As such, the current consensus estimate for Russell 2000 EPS growth next year is a whopping +40%, according to Goldman Sachs.
You see, elevated inflation is only an issue for small caps if it means higher short-term interest rates. As it stands, there’s roughly a 90% chance of an October Fed rate cut and a better than three-in-four probability of a third quarter-point ease on December 10. Dare to peek at the 12-month Fed Funds futures, and an additional few cuts could be on the way.
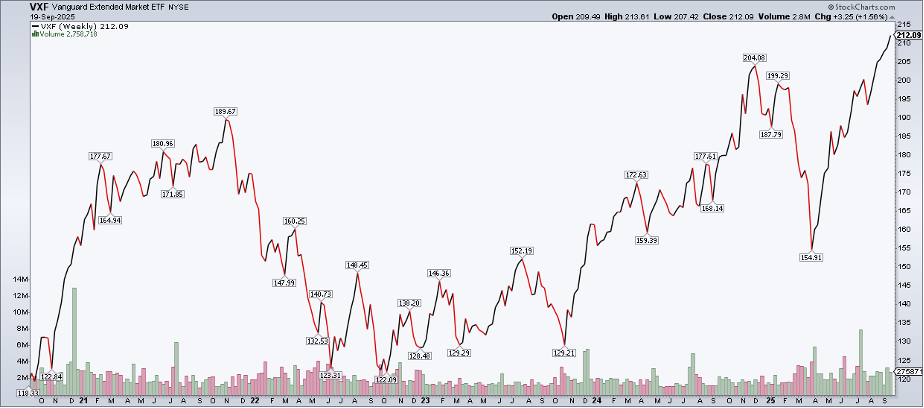
We’re technicians, though. We recognize that markets discount the news (one of the six Dow Theory tenets). “If it’s in the newspaper, it’s in the price,” as they say. To be clear, a cohesive story and macro narrative can sway sentiment, but I’m not going to make any Fed-related predictions today. Rather, price action is in my crosshairs.
Dow Theory: Price Discounts the News
IWM’s record weekly settle triggered a key upside measured move price objective, something I did not offer color on in August. The math is simple on this one: Based on the nearly four-year range of $242 down to $162, we can take that $80 depth and add it to the breakout point. Thus, the upside target is $322, or another 32%.
That’s plenty to get excited about over the months and quarters ahead. Some technicians may still be cautious — a second weekly close above the November 2021 and November 2024 double top would help from a confirmation perspective. That makes the next several trading days potentially pivotal to the bull case.
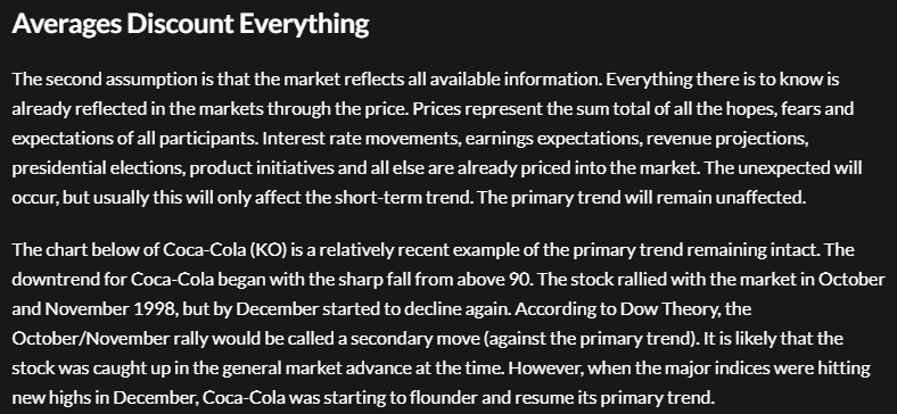
Moreover, my August write-up detailed how IWM has been outperforming IJR this cycle. To that point, IJR (at $119) remains materially under its high from 10 months ago; I’d like to see the SmallCap 600 ETF’s false breakout negated by a year-end rally.
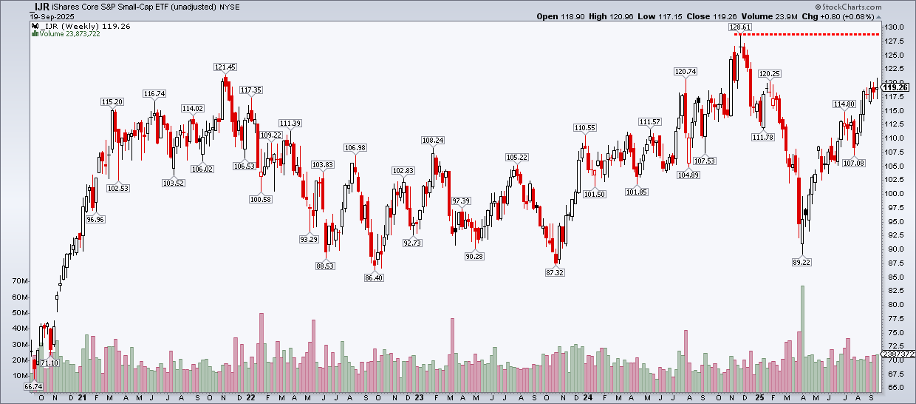
Confirmation from SMID-Caps: VXF Hits Record High
There is confirmation, however, from the wider “SMID-cap” piece of the U.S. stock market. For that, I chart the Vanguard Extended Markets ETF (VXF), which holds all domestic equities not in the S&P 500 Index. Up seven weeks running, it logged a record close last week, too. VXF tends to be more “growthy,” while IWM has a significant allocation to small-cap value.
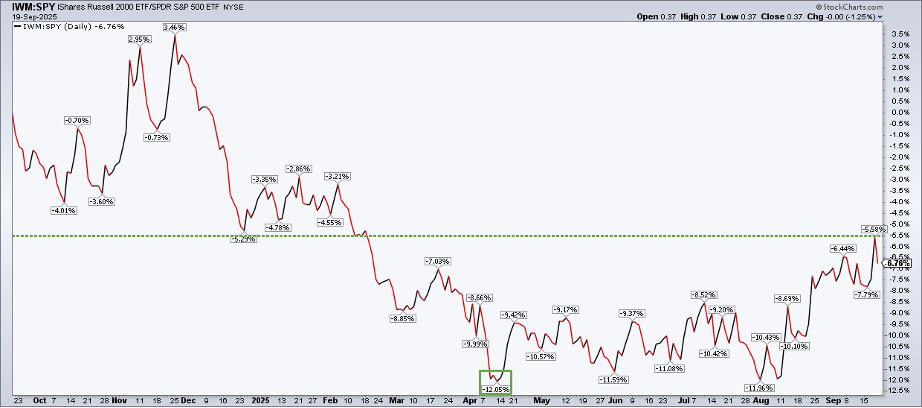
I am encouraged by IWM’s persistent relative strength to the SPX. Small caps have led large caps off the April low, with IWM boasting the best alpha going back to February before a retreat last Friday.
IWM vs. SPY: Multi-Month Highs Hit Last Week
Regional Banks: The Missing Piece
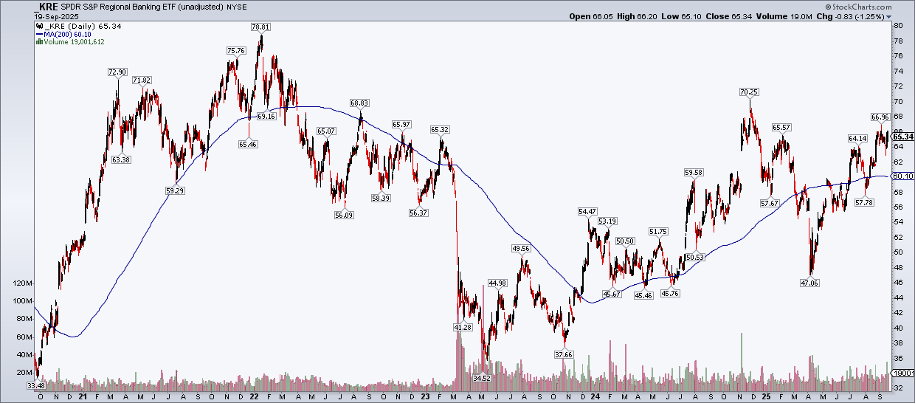
What’s less encouraging is sputtering price action among regional bank stocks. You can’t perform a full small-cap assessment without eyeing the SPDR S&P Regional Banking ETF (KRE). Despite a more sanguine market view regarding interest rates, a significant gap remains between the current price and the late-2024 peak.
KRE’s long-term 200-day moving average is merely flat in its slope, suggesting an ongoing battle between the bulls and bears. The bulls may need to grab the reins for IWM to thrust toward that $322 target.
Seasonality Tailwinds Through Year-End
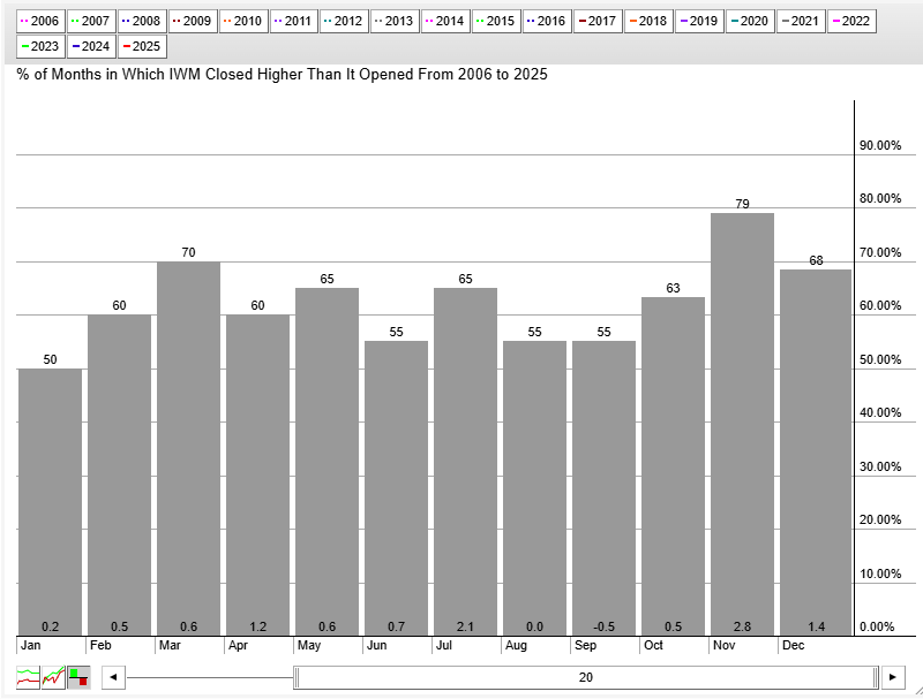
Wrapping up with seasonality, I warned investors that “sell Rosh Hashanah, buy Yom Kippur” begins tonight (Monday, September 22) and ends on Thursday next week (right before the September jobs report is released). Beyond that, Q4 returns have been strong, on average, since 2006.
IWM Seasonality: Calendar Tailwinds Through Year-End
The Bottom Line
Small caps delivered the goods after soaring on Jackson Hole Day. IWM notched a new record weekly close last Friday, triggering a bullish measured move target. Confirmation this week is key, while areas like the Small-Cap 600 and regional banks have yet to join IWM at new highs.
Disclaimer: This blog is for educational purposes only and should not be construed as financial advice. The ideas and strategies should never be used without first assessing your own personal and financial situation, or without consulting a financial professional.


