Tech May Be About to Regain Part of Its Old Leadership Role
Last month, I observed that several earnings-driven sectors, specifically Energy, Materials, and Industrials, opened 2026 as clear market leaders, and then showed why that leadership was likely to persist. Over the same period, Technology was among the weakest performers. However, recent action in the Technology Select Sector SPDR Fund (XLK) suggests that, under the right conditions, the sector could begin to reclaim at least part of its former leadership role.
In Chart 1, the top two panels show that XLK’s price remains in a primary uptrend, trading above its 12‑month moving average and its long‑term secular trendline. The long-term KST is also positive.
Despite the recent concerns surrounding AI, the relative strength line in the third panel has managed to hold above both its moving average and the post‑2018 up trendline. Nonetheless, any further deterioration could quickly undermine this constructive setup.
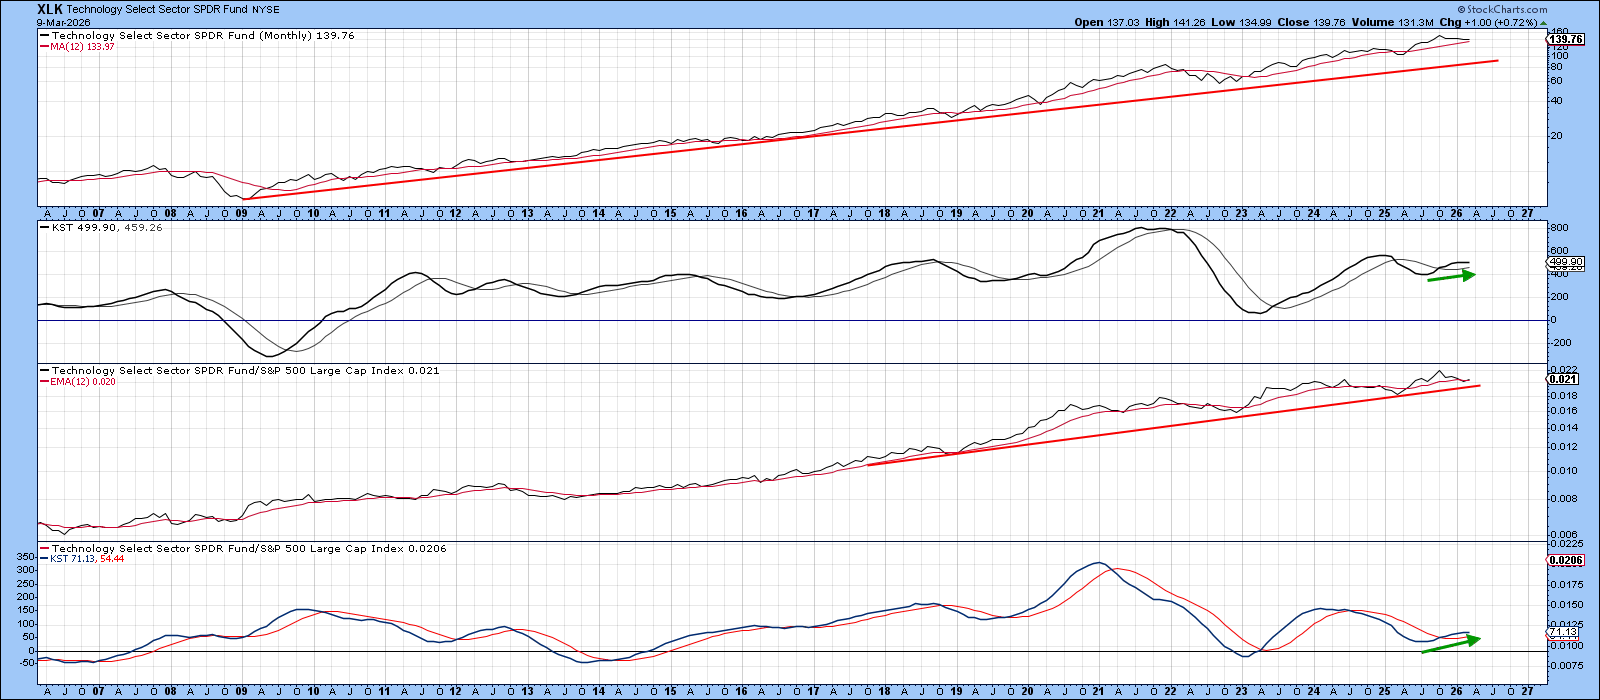
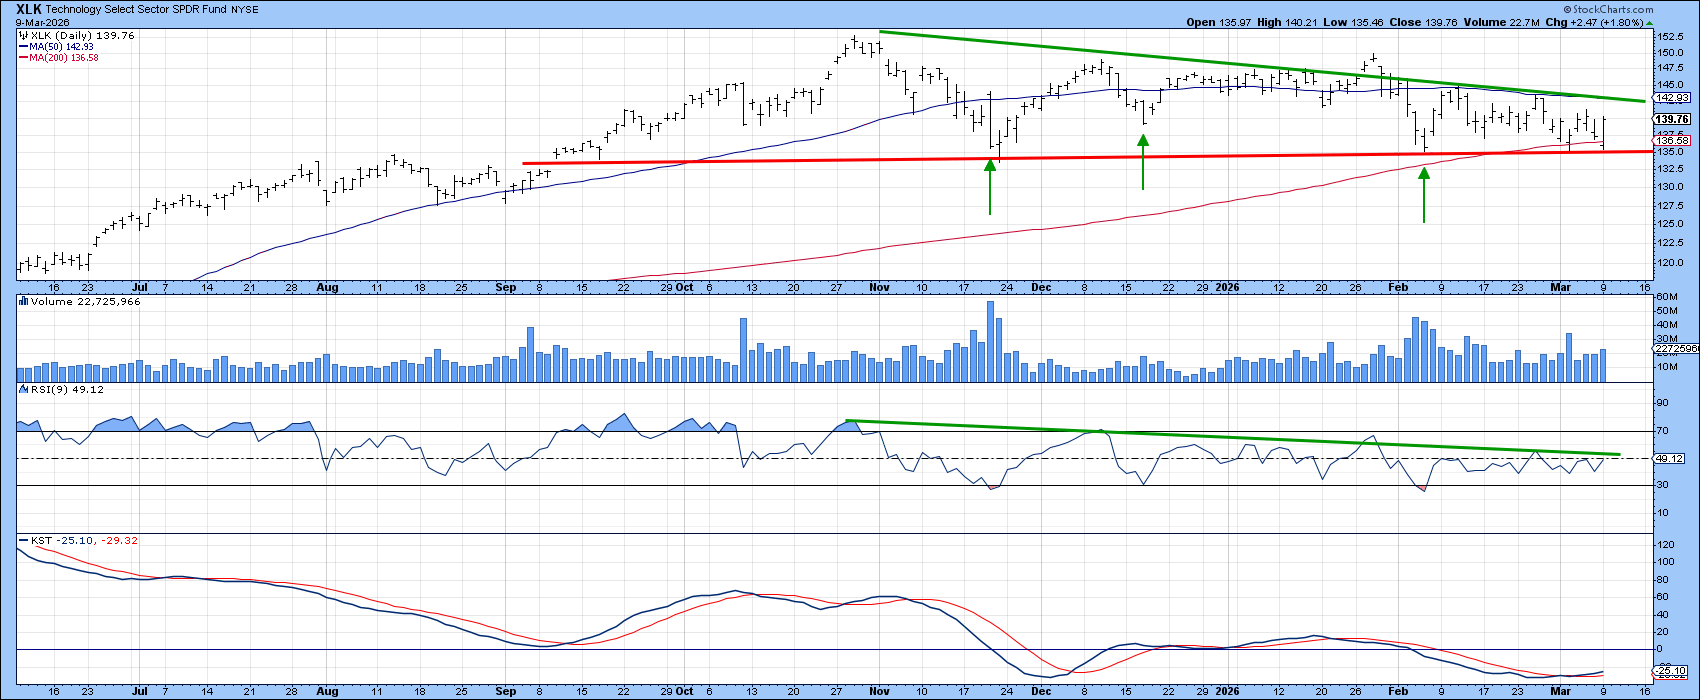
Chart 2 shows how, with the price having been close to the 2025–2026 red support trendline and 200-day MA. That said, it bounced off what is really the lower edge of a potential symmetrical triangle top, a clearly positive development. Since the daily KST in the bottom window has just gone bullish, a test of the green resistance line is now a distinct possibility. That line represents meaningful intermediate resistance, since it coincides with the 50‑day moving average; a decisive break above it would be a clear positive. Another sign that this may be a bull‑market correction is the RSI’s ability to rebound quickly from oversold territory. That has happened three times in the past five months, highlighted by the three upward‑pointing green arrows.
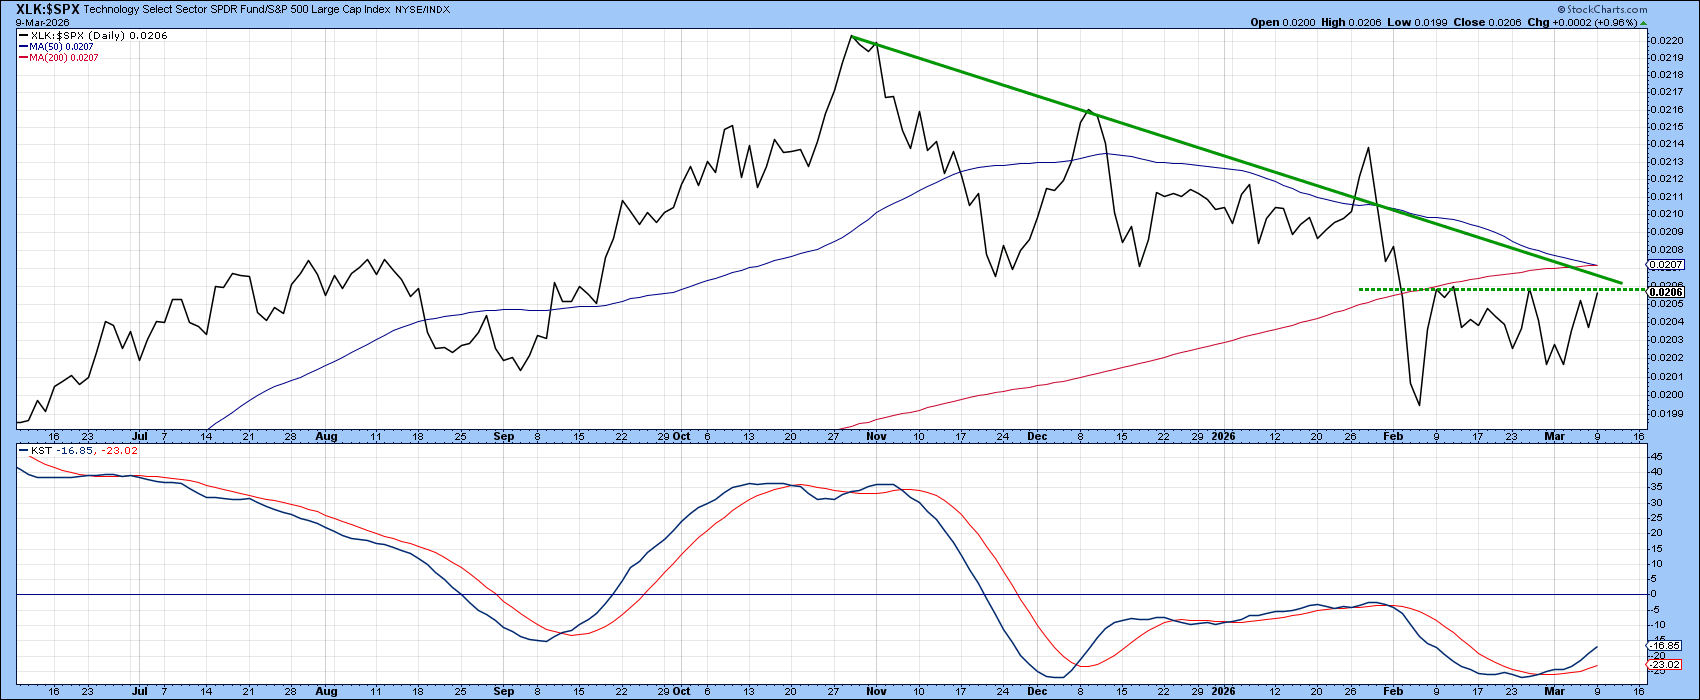
The significance of the current technical position is emphasized in Chart 3, which compares the relative line to its daily KST. The first thing to notice is that the KST for relative action has gone bullish, which suggests the relative line is about to rally. If so, such action would likely propel it above the two converging trendlines. Even more important would be a probable break above the 50- and 200-day MAs. That they both are residing in the same area reinforces their importance as a resistance zone.
Internal Technology Indicators
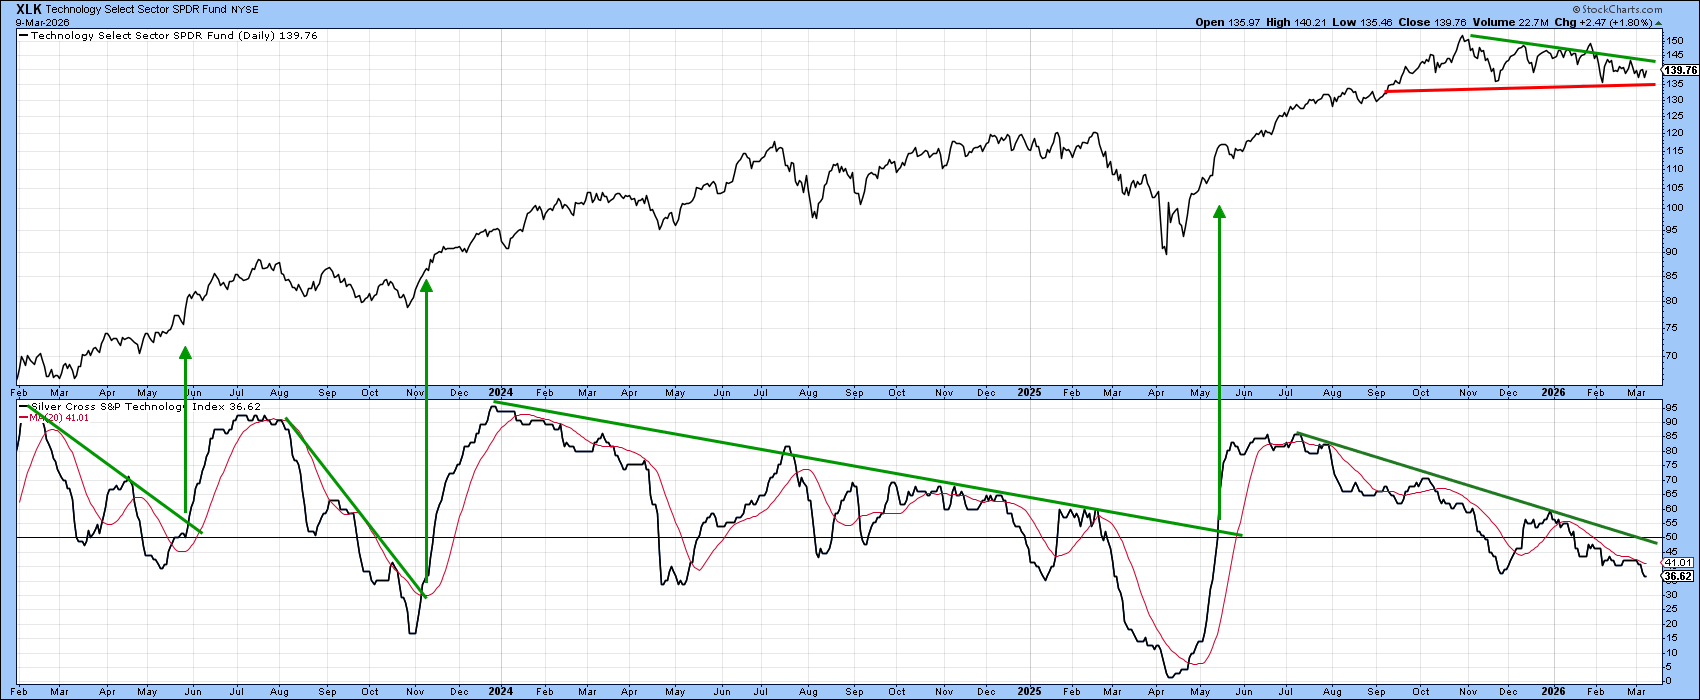
A review of StockCharts’ internal technology indicators shows that the sector is in an oversold intermediate condition and well‑positioned to signal a rally if a few key triggers fall into place. Chart 4 illustrates this by comparing XLK with the percentage of its components holding a positive Silver Cross. A Silver Cross occurs when a stock’s 20-day EMA moves above its 50-day EMA; each positive crossover adds to the indicator, while negative crossovers subtract from it.
One of the most useful aspects of this series emerges when a trendline can be drawn on the raw data and subsequently broken to the upside. The chart shows three such instances. A fourth trendline has been forming since last summer, but the indicator has yet to break above it. A decisive move through that line, combined with price clearing its green downtrend line, would, in my view, constitute a powerful signal that technology stocks have finally shaken off their recent lethargy.
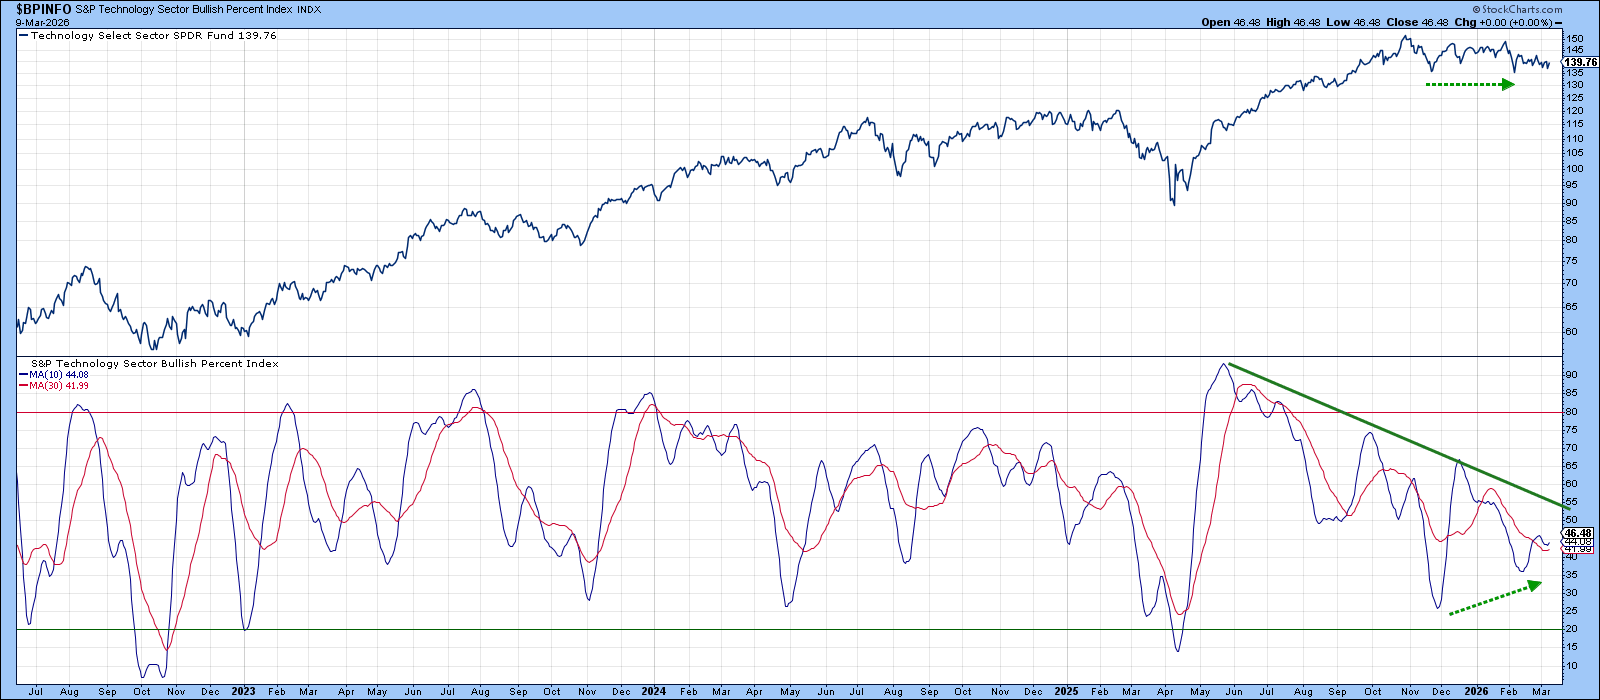
XLK dropped to the same level in February as it did last December. However, the bullish‑percent reading for technology stocks came in higher in February, indicating that fewer stocks were participating in the decline. That improvement in internal strength is a constructive sign.
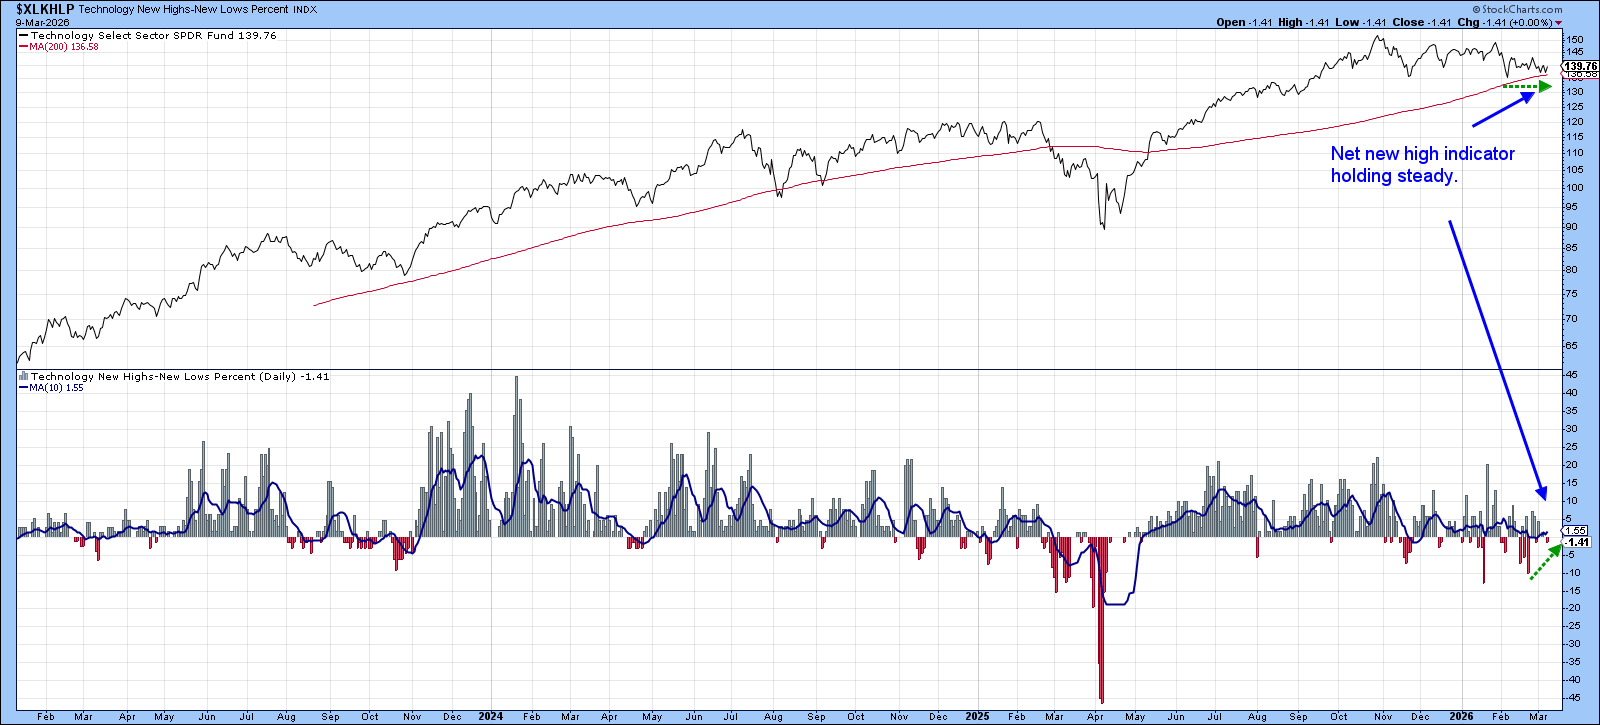
Finally, Chart 6 shows that the net new high indicator for technology stocks started to break down at the early February low. However, when it came to the early March sell-off, the indicator barely dropped at all, indicating that technology stocks had the opportunity to sell off but decided not to take it.
Bottom Line
We can’t declare technology stocks out of the woods just yet. But, if a few key triggers fall into place, the recent predictions of an XLK collapse will prove to have been greatly exaggerated.
Good luck and good charting,
Martin J. Pring
The views expressed in this article are those of the author and do not necessarily reflect the position or opinion of Pring Turner Capital Group of Walnut Creek or its affiliates.