The $4 Gas Threat: The Travel Boom Is Crashing

For the past three years, the hospitality industry has been riding the unstoppable wave of "revenge travel." Consumers and corporations paid premium prices for hotel rooms, assuming the post-pandemic economic boom would last forever.
That narrative is rapidly colliding with a harsh macroeconomic reality.
Recent geopolitical tensions and the resulting oil shock in the Middle East have changed the economic landscape. With gas prices above $4/gallon, the discretionary budget of the average American consumer is being squeezed dry. This puts leisure travel on the chopping block and may also impact corporate travel.
As inflation proves sticky and the Federal Reserve is forced to hold interest rates "higher for longer," we are entering a stagflationary environment, something we haven't seen since the 1970s. Corporate CFOs are tapping the brakes on investments and freezing travel budgets to preserve capital. When leisure and business travel face simultaneous demand destruction, hotel operators trading at premium valuations are poised for a severe repricing.
Marriott's Head-and-Shoulders Top
The fundamental anxiety surrounding the travel sector is reflected in the chart of Marriott International (MAR).
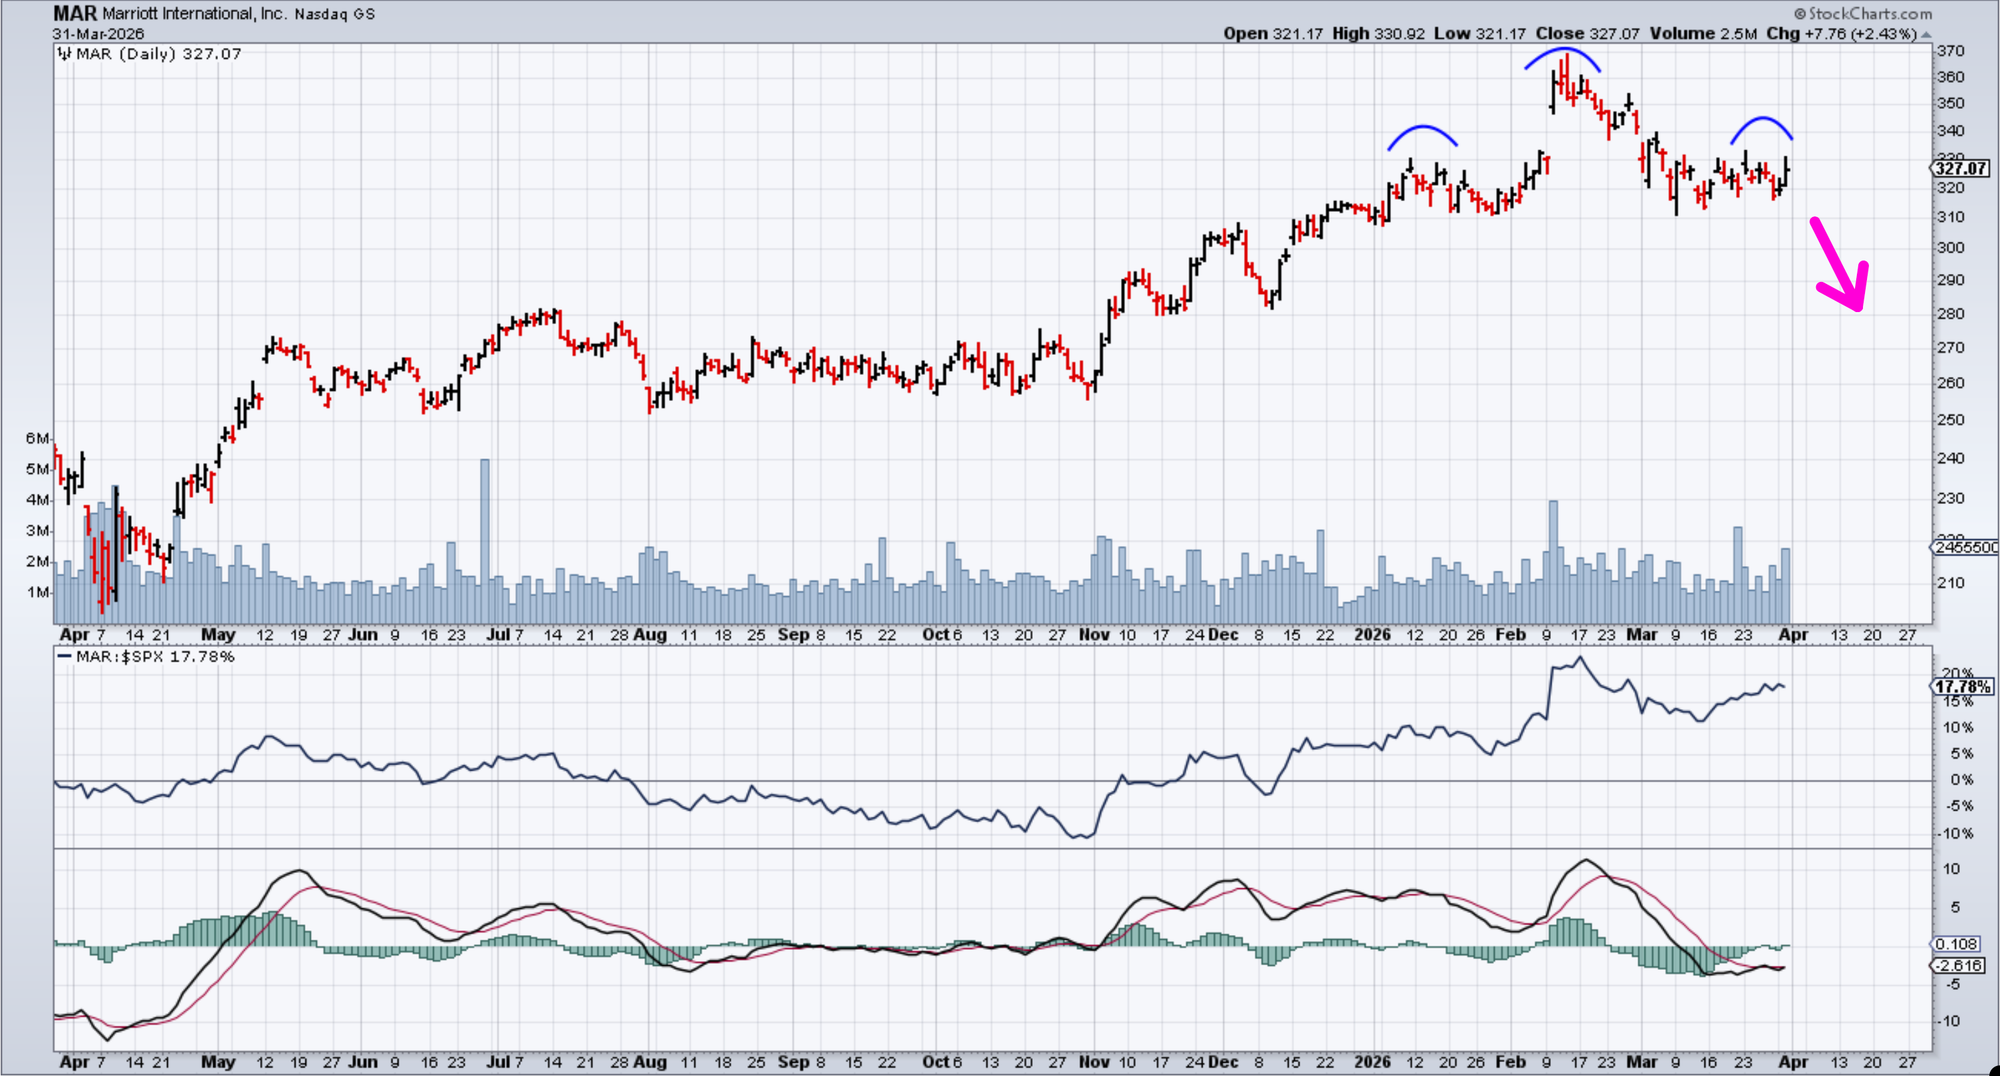
Looking at the daily chart, MAR is carving out a massive, textbook head-and-shoulders top. After establishing a "left shoulder" earlier this year and pushing to a euphoric "head" near $370, the stock is failing to regain its momentum. The recent anemic bounce we’ve seen over the last couple of weeks on negative momentum is the formation of the right shoulder.
If MAR breaks below its neckline support, the measured move of this topping pattern points to a downside target near $285. The buyers are exhausted, and the trap is set.
How to Trade the Breakdown with Options
Shorting a stock like MAR outright is dangerous; a sudden headline about a diplomatic resolution or a short squeeze can wipe you out. Buying naked puts is also sub-optimal, as the geopolitical fear has inflated implied volatility, making options expensive.
Instead, I used the OptionsPlay Strategy Center to engineer an aggressive Bear Put Spread, which leverages the downside momentum while strictly defining my risk and cutting my capital outlay.
The Trade: Buy to open May 1, 2026 $320/$295 Put Vertical @ $5.80 Debit
Legs: Buy $320 put/sell $295 put
Net Cost & Max Risk: $5.80 ($580 per contract)
Max Profit: $1,920 per contract
Breakeven: $314.20 (-3.93% from current price)
What makes this bear put spread compelling?
- Asymmetric payoff: You are risking $580 to potentially make $1,920. That is an exceptional roughly 3.3-to-1 reward-to-risk payout for a directional bet in a high-volatility environment.
- Target Alignment: By selling the $295 Put, we are explicitly targeting the downside momentum before the stock even reaches the ultimate $285 pattern target. We get paid to align our option strikes exactly with the technical breakdown.
- Defined Risk: In a market driven by unpredictable geopolitical headlines, this spread ensures that your maximum possible loss is strictly capped at the premium paid, no matter what happens overnight.
Finding Trades Like This in Under 5 Seconds
Traditional workflow to find setups like this:
- Scan for breakouts/breakdowns → 50-100 stocks
- Research fundamentals → Narrow to 10-15
- Analyze options chains → Check liquidity
- Build spreads → Calculate risk/reward
- Compare → Pick the best one
- Time: 1-2 hours.
- Confidence: Low to Medium (always wondering what you missed).
What we did:
- OptionsPlay Strategy Center → "Bearish Trend Following" scan
- Strategy: "Bear Put Spread"
- Timeframe: "30 Days"/Risk: "Aggressive"
- Click "Update"
- Time: 5 seconds.
- Result: MAR at the top with Score 158.
The OptionsPlay Strategy Center scans for stocks with optimal technical setups, liquid options, optimal strikes for current IV, and best expirations for theta/time value balance.
Instead of hoping good charts have good options trades, you start with the best options opportunities, then validate the thesis. For MAR: Head and Shoulders breakdown ✓ / Stagflation & Oil Shock catalyst ✓ / ~3.3-to-1 reward-to-risk ✓ / Defined risk in volatile market ✓
That's not just speed. It's confidence that you're working from the best setups in the market.
The Bottom Line
The era of price-insensitive "revenge travel" is colliding with a stagflationary reality. The Middle East oil shock is squeezing the consumer, while rising rates and geopolitical fears are freezing corporate travel budgets.
MAR is completing a massive head-and-shoulders top pattern, targeting $285. The May $320/$295 bear put spread perfectly capitalizes on this macro and technical alignment, offering a highly attractive 3.3-to-1 payout while strictly defining your risk in a choppy market.
And we found it in 5 seconds using the OptionsPlay Strategy Center—not by luck, but by starting with the best options opportunities and validating the thesis. That's the workflow transformation.
The OptionsPlay Add-On for StockCharts is available for $40/month and includes the Strategy Center, OptionsPlay Explorer, and hundreds of daily curated trade ideas.
Options trading involves risk and is not suitable for all investors. This article is for educational purposes only and does not constitute investment advice.


