The Best Five Sectors This Week, #40
Key Takeaways
- Technology, Communication Services, and Consumer Discretionary maintained their top 3 positions.
- Healthcare made a significant jump from 10th to 7th place.
- Industrials are facing potential weakness, moving towards the lagging quadrant.
- Utilities shows strength on both weekly and daily RRGs.
Stability Amidst Volatility
Despite a volatile week in the markets, particularly Friday's rapid decline, the overall sector rankings remained relatively stable. The top three sectors, Technology, Communication Services, and Consumer Discretionary, held their positions, while only minor shuffling occurred elsewhere in the rankings.
This leaves us with the latest ranking.
- (1) Technology - (XLK)
- (2) Communication Services - (XLC)
- (3) Consumer Discretionary - (XLY)
- (5) Utilities - (XLU)*
- (4) Industrials - (XLI)*
- (6) Financials - (XLF)
- (10) Healthcare - (XLV)*
- (8) Materials - (XLB)
- (7) Energy - (XLE)*
- (9) Real-Estate - (XLRE)*
- (11) Consumer Staples - (XLP)
Weekly RRG
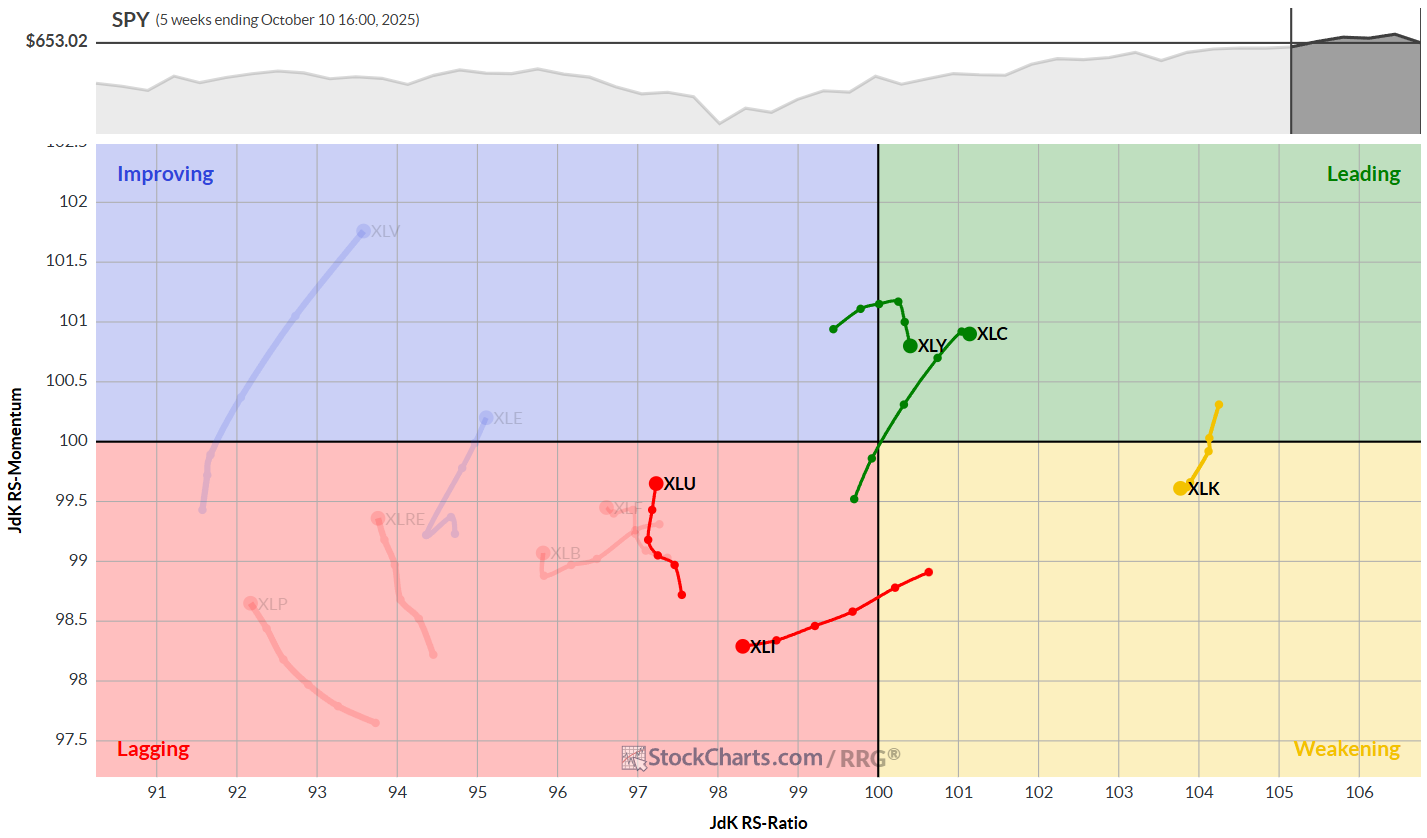
The weekly RRG continues to show Technology (XLK) with the highest RS-Ratio reading, firmly planted on the right side of the graph. However, it's now moving through the weakening quadrant, signaling a short-term setback.
Communication Services is well inside the leading quadrant, moving at a positive RRG heading. Consumer Discretionary, while still in the leading quadrant, has rolled over and is losing relative momentum.
Industrials (XLI) is in what I'd call the danger zone, heading into the lagging quadrant and continuing to travel lower on the RS-Ratio scale with a negative heading.
On a more positive note, Utilities has stopped its decline on the RS-Ratio scale, indicating a potential shift in relative trend as it picks up relative momentum.
Daily RRG
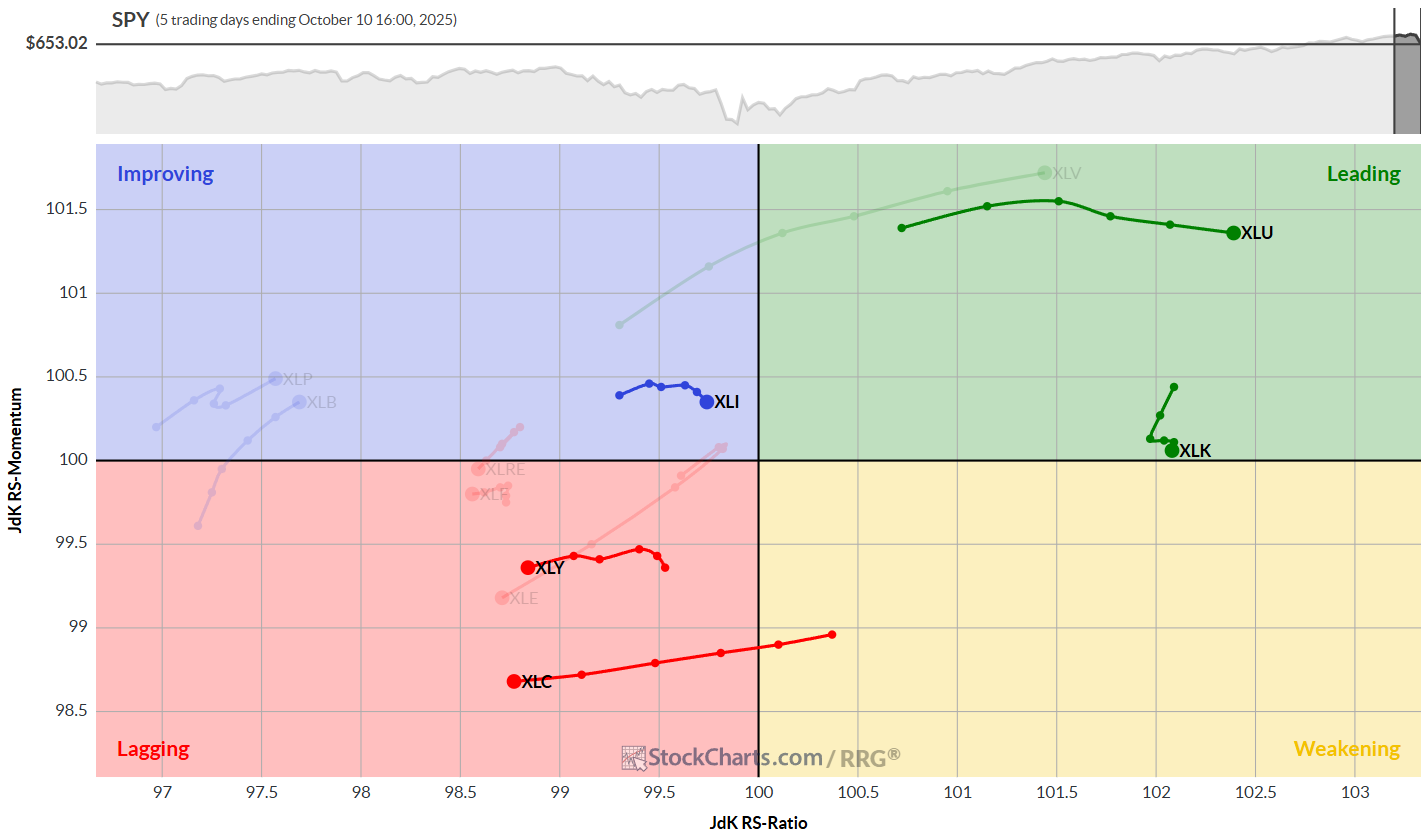
Shifting to the daily RRG, we see some interesting developments:
- Technology remains on the right-hand side, almost mirroring its position on the weekly chart, a strong confirmation of the sector's current strength, even after Friday's move.
- Utilities is performing exceptionally well, with its tail well inside the leading quadrant and continuing to move right at a high RS-Momentum level.
- Industrials is in the improving quadrant but already starting to roll over downward, potentially heading back to the lagging quadrant, confirming the weakness we observed in the weekly tail.
- Consumer Discretionary and Communication Services are both inside the lagging quadrant and continuing to move lower on the RS-Ratio scale. However, they're still on the right-hand side of the weekly RRG, suggesting these might be temporary setbacks.
Technology
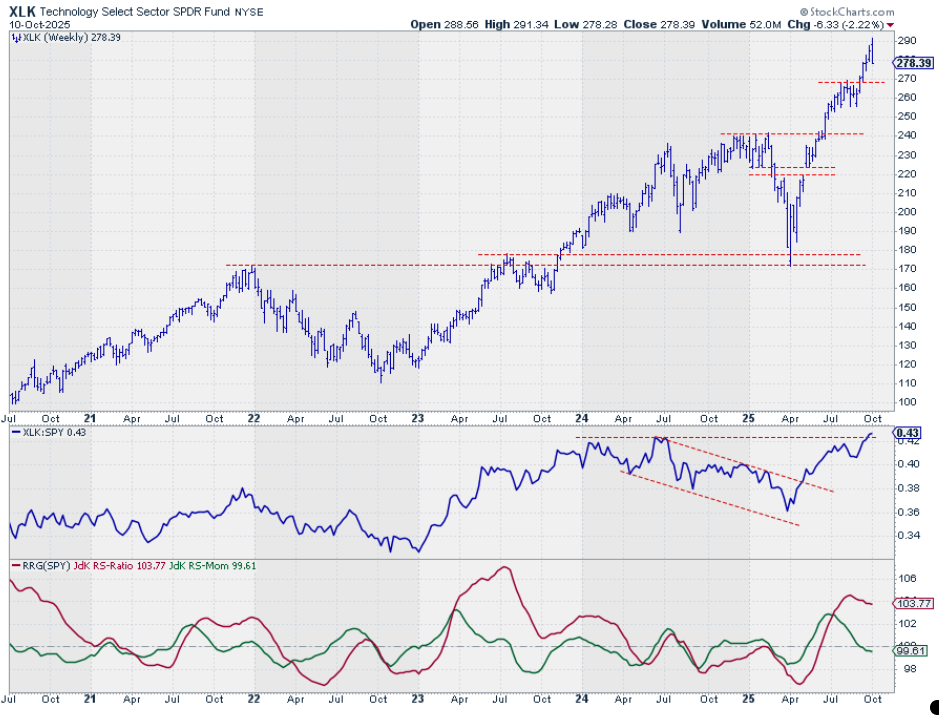
Last week showed a huge reversal bar for XLK, a characteristic often associated with trend endings or topping patterns. After the significant rally in the tech sector, this isn't entirely surprising. There's room for a correction, with the first support level I'm watching just below 270 (let's say 267.5–268). The raw RS line is still peaking above its previous high, confirming the current relative strength for the technology sector.
Communication Services
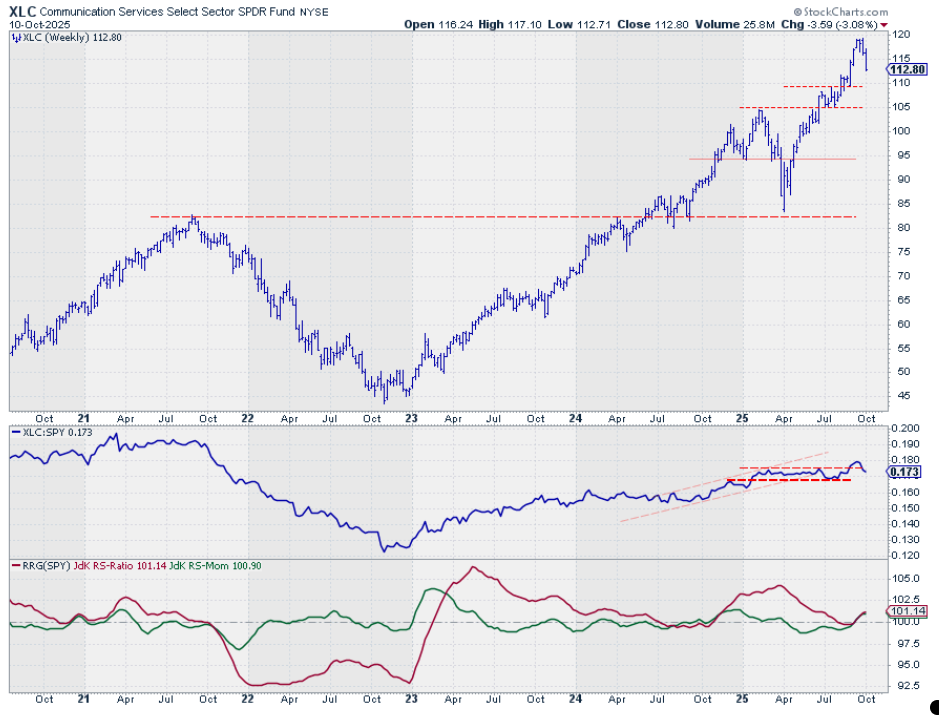
XLC is also showing a big down week, approaching the first support levels around 110. The raw RS line has dropped back below its previous high; this is not ideal, but still well above its previous low. The relative uptrend remains in play, supported by RRG lines above 100 and moving higher.
Consumer Discretionary
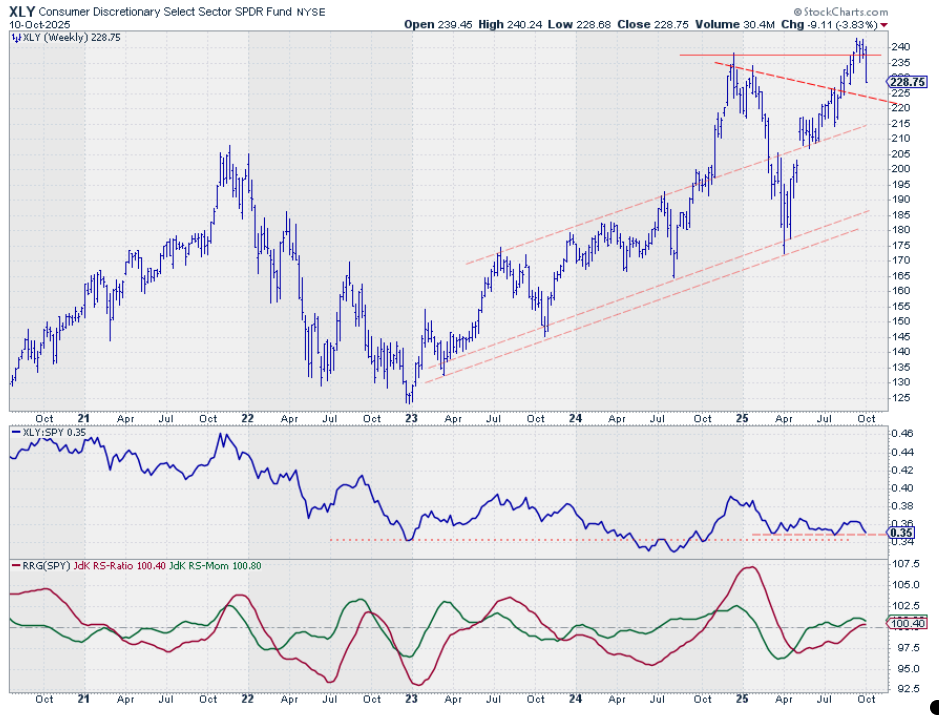
Another sector with a huge down bar, XLY is moving towards its support area, which I'm pegging between 220 and 225. This zone represents a former falling resistance line (potentially the neckline of a reverse head-and-shoulders pattern) and a previous high around 225. The raw RS line is back to testing previous lows — as long as they hold, relative strength remains intact.
Utilities
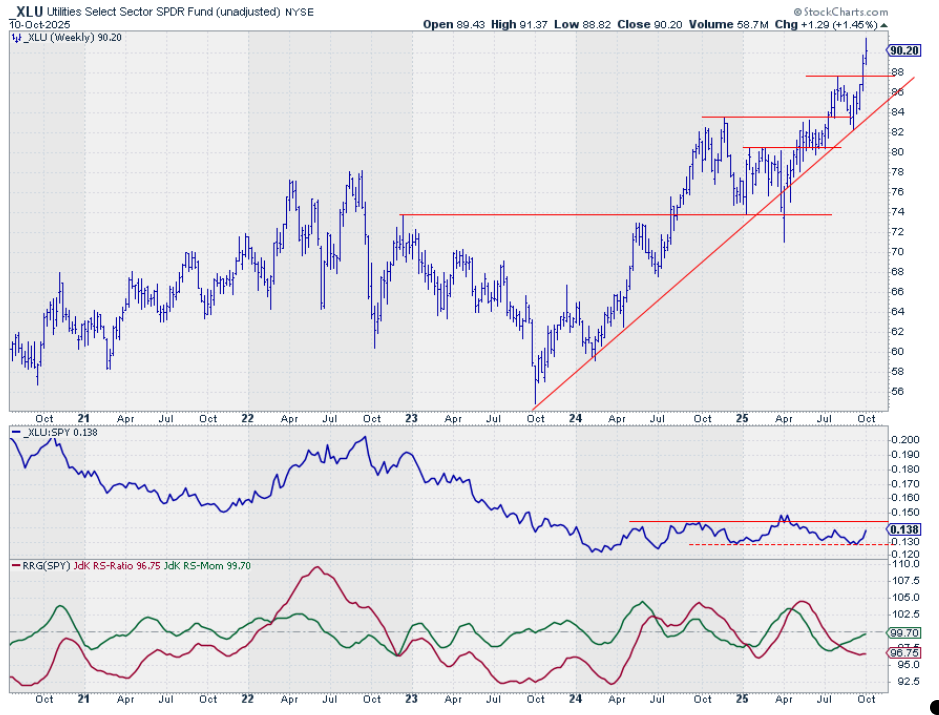
As a defensive sector, Utilities actually had a good week, not surprising given the late-week weakness in the broader market. The raw RS line is bouncing off support and moving towards the upper boundary of its trading range, well supported by strength in the price chart. This strength is reflected in the RRG lines, with RS-Momentum almost crossing above 100 and starting to drag the RS-Ratio line higher.
Industrials
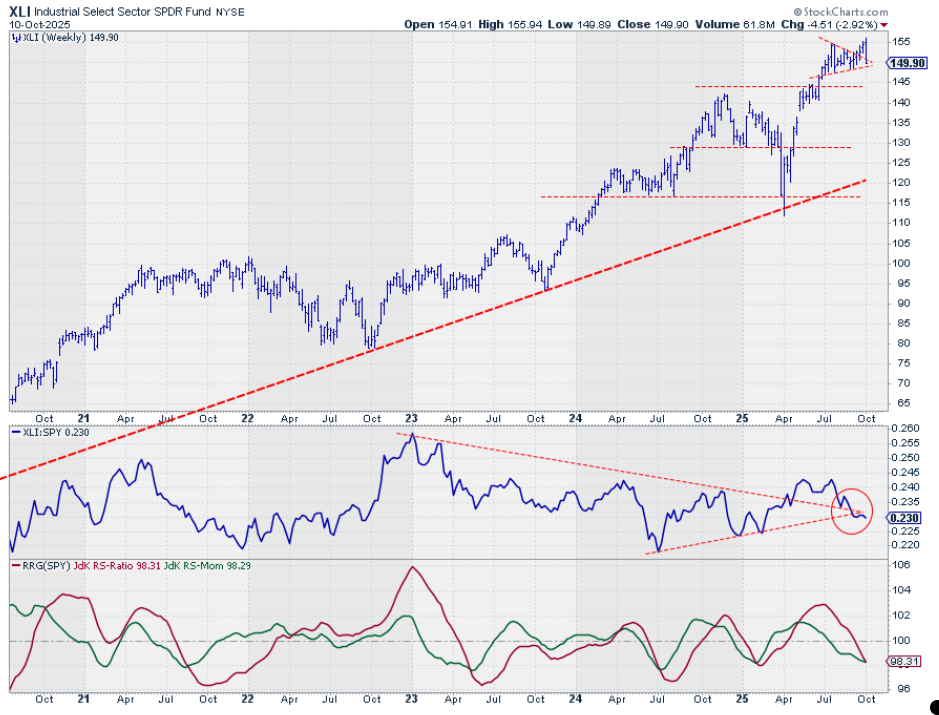
XLI showed a big reversal week, moving back into the flag-like pattern (now negated). We need to look for support levels between the current price and just below 145 (maybe 144).
More concerning is the continued weakness in the raw RS line, which is now showing a series of lower highs and lower lows. This is reflected in the RRG lines, both of which are below 100 and moving lower, creating that negative heading on the RRG chart.
Portfolio Performance
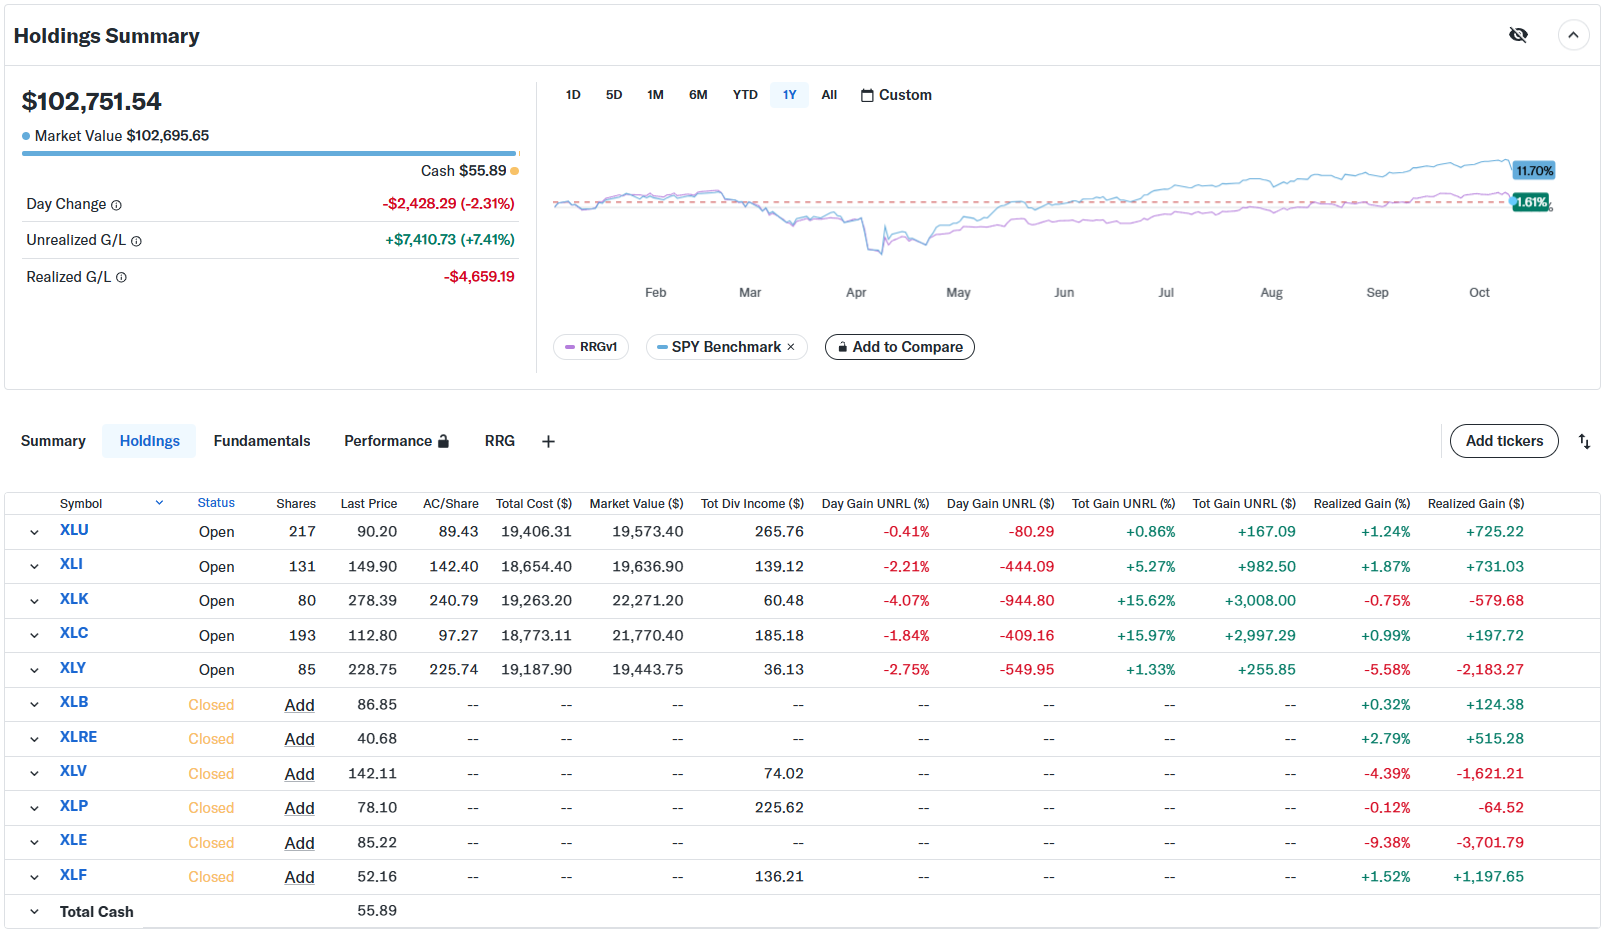
Looking at portfolio performance, we've recovered a bit, but remain well behind the S&P 500 since the start of the year. It's all about the weightings. With our equal-weight approach (20% per sector) vs. the market index (where Technology is 30%), it's almost impossible to keep up when tech is outperforming.
I still need to do a lot of work on the weighting scheme. There's a good chance, and I'm almost sure, that the overall performance will improve significantly if we abandon the equal-weight approach.
#StayAlert, -Julius


