The Best Five Sectors This Week #56
Key Takeaways
- Utilities entered the top five sectors, replacing Health Care, while Energy remains the strongest sector overall.
- Materials and Industrials are still in the leading quadrant but are losing relative momentum.
- On the daily RRG, all top five sectors have moved into the weakening quadrant, indicating a short-term corrective phase despite longer-term leadership.
- Portfolio performance lagged the S&P 500 last week, mainly due to losses in Industrials, Health Care, and Materials.
Utilities Enter the Top Five as Materials Lose Momentum
After another volatile week in the markets, the composition of the top five sectors shifted slightly. Health Care dropped out, making way for Utilities, which now join the ranks. Here’s how the current sector rankings stand:
- (1) Energy - XLE [15%]
- (2) Materials - XLB [10%]
- (3) Industrials - XLI [40%]
- (4) Consumer Staples - XLP [25%]
- (6) Utilities - XLU [10%]*
- (5) Health Care - XLV*
- (7) Real Estate - XLRE
- (8) Communication Services - XLC
- (9) Technology - XLK
- (10) Consumer Discretionary - XLY
- (11) Financials - XLF
Weekly RRG
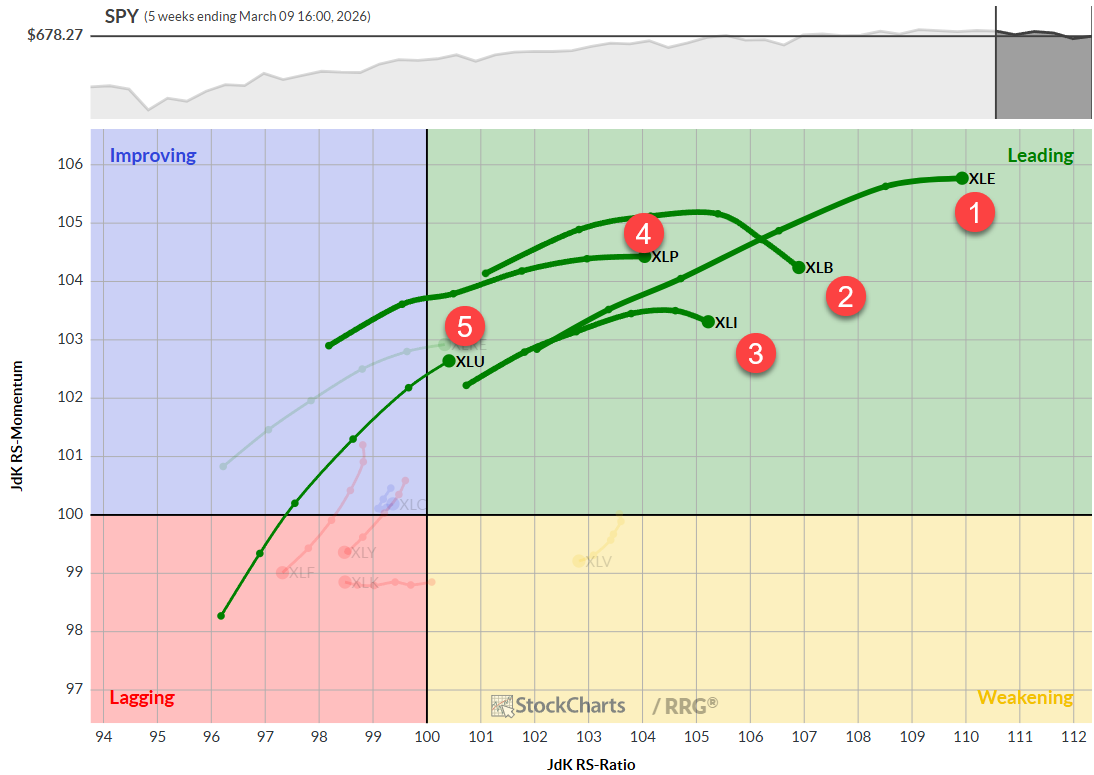
At the end of last week, Energy continued to dominate inside the leading quadrant. Materials, while still in leading, has started to lose some momentum, a rotation mirrored by Industrials.
Materials maintains a stable level of momentum, but is pushing higher on the RS ratio scale. Utilities, now in the leading quadrant, show both a positive heading and positive momentum.
Daily RRG
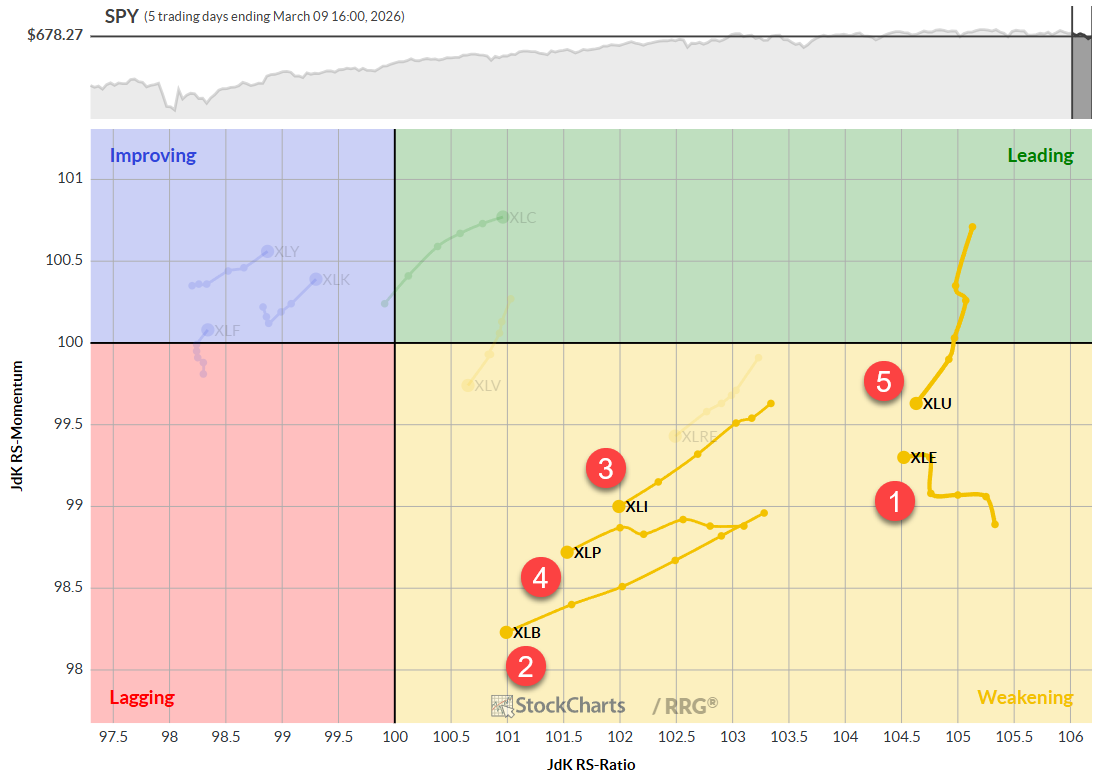
Zooming in on the daily RRG, all top five sectors are currently inside the weakening quadrant. This signals that these sectors are undergoing a corrective move, even though they remain leaders in the longer term. Each is on a negative heading and losing momentum, indicating the corrective phase is ongoing. However, most still have relatively high RS ratio levels, suggesting potential for a rebound and a return to leadership.
The only sector entering the risk zone is Materials, which has the longest tail among the top five on the daily chart, a negative heading, and the lowest RS momentum score.
Sector Highlights
Energy
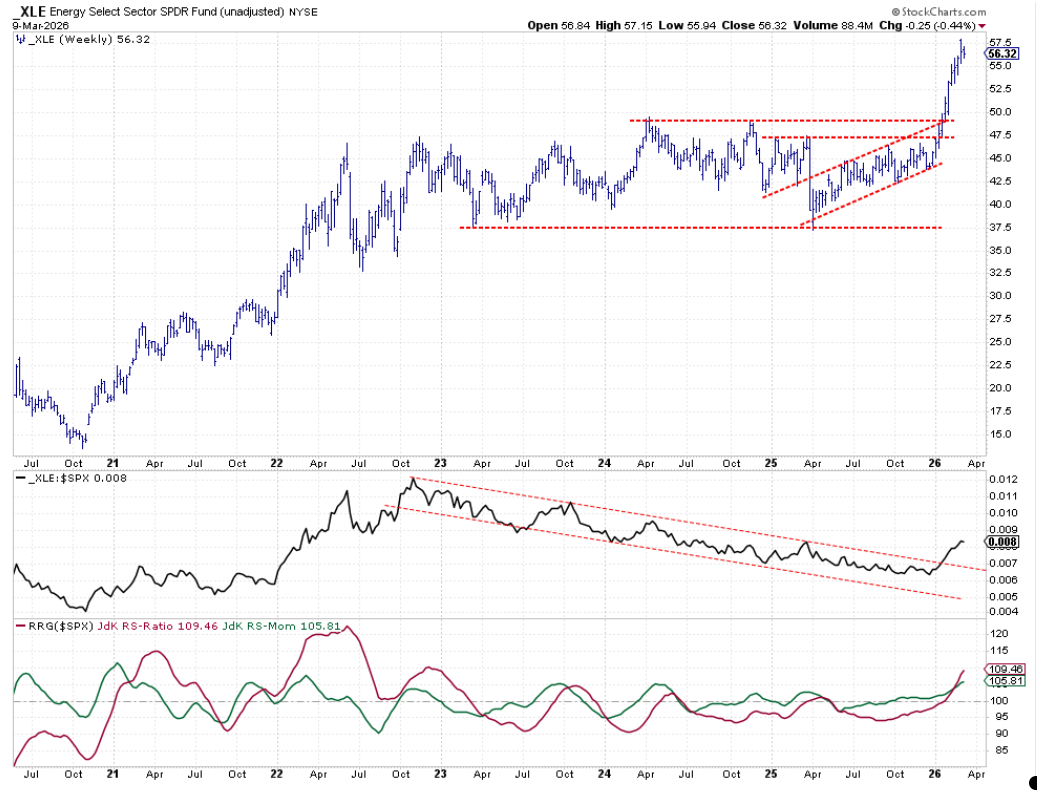
Energy remains resilient after its recent breakout, consolidating around $56. Relative strength continues to climb, pulling both RRG lines higher. Historically, the RS ratio for energy reached as high as 120 in 2022, indicating there’s still room for further upside.
Materials
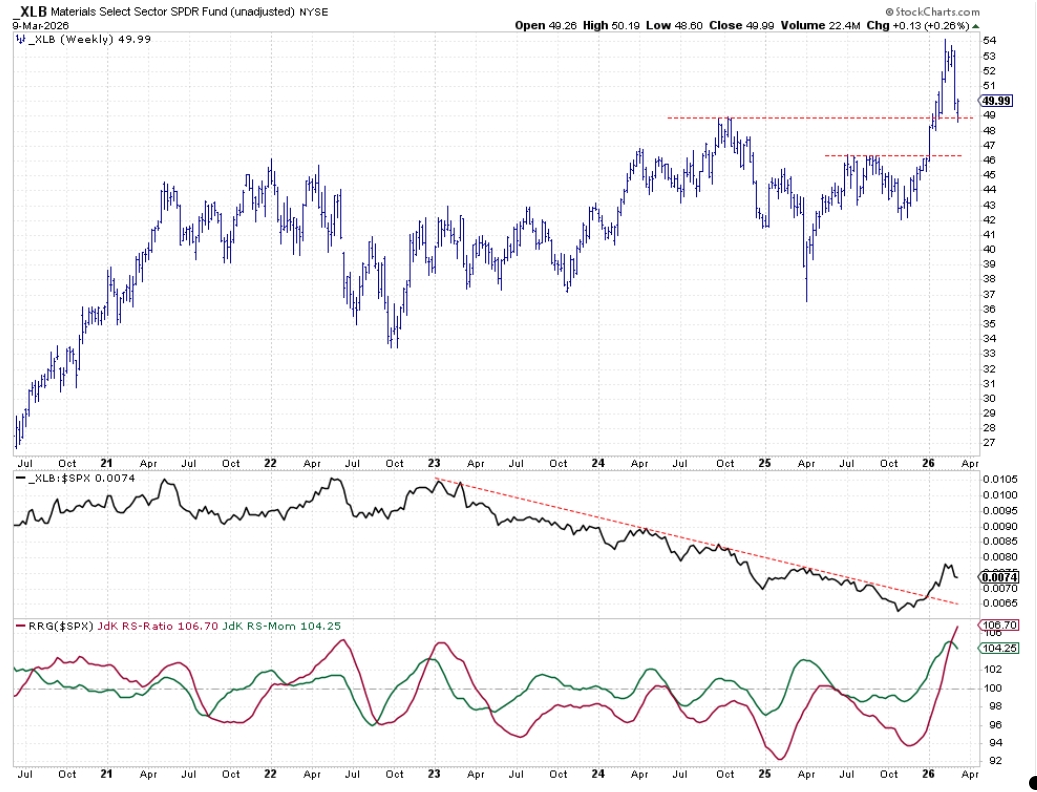
Materials experienced a sharp drop last week, including on Monday. However, the sector has reached the level of its previous high, which is now acting as support. If a new low forms just below $49, it could signal a revival of the uptrend that began in 2025. The raw relative strength is out of its previous downtrend, and the RS ratio is still rising, though momentum is waning.
Industrials
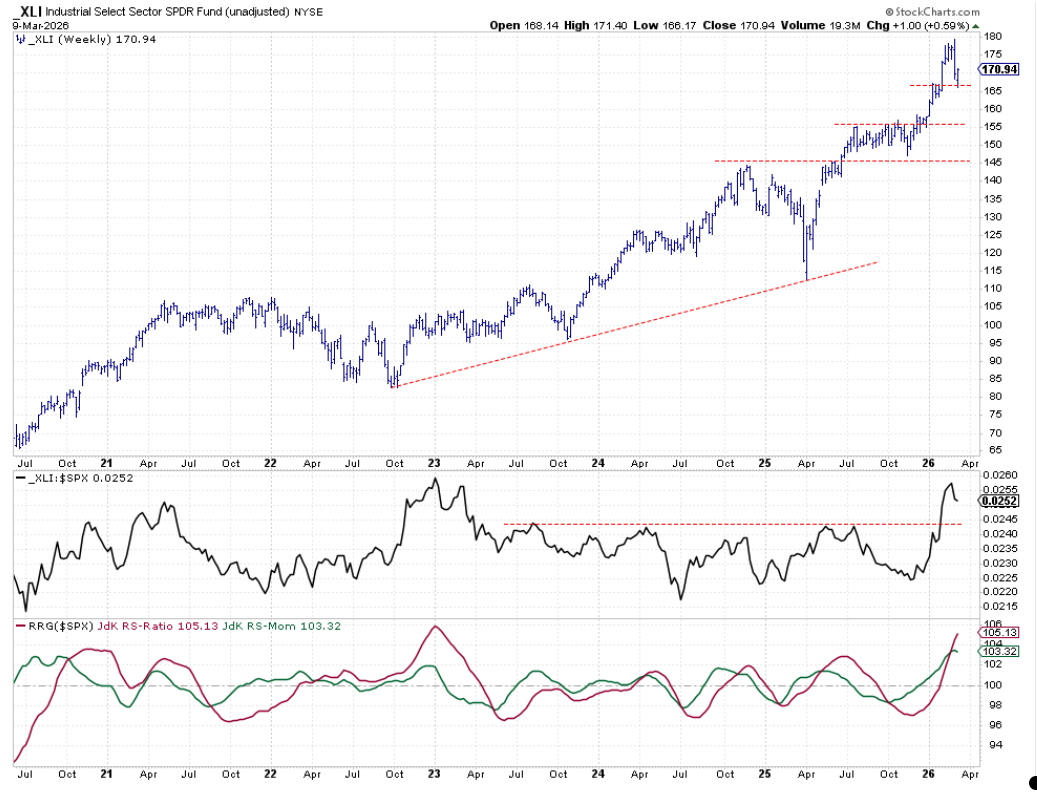
Industrials also saw a pullback, with a significant reversal candle last week and a dip followed by recovery on Monday. The recent low aligns with the highs from the first three weeks of 2026, serving as intermediate support. The raw RS line remains above its all-time highs from late 2022 and, while the RS ratio is at maximum levels (last seen in 2023 around 106), there’s a slight setback in relative momentum.
If XLI holds above support and relative strength recovers, the sector could see renewed outperformance.
Consumer Staples
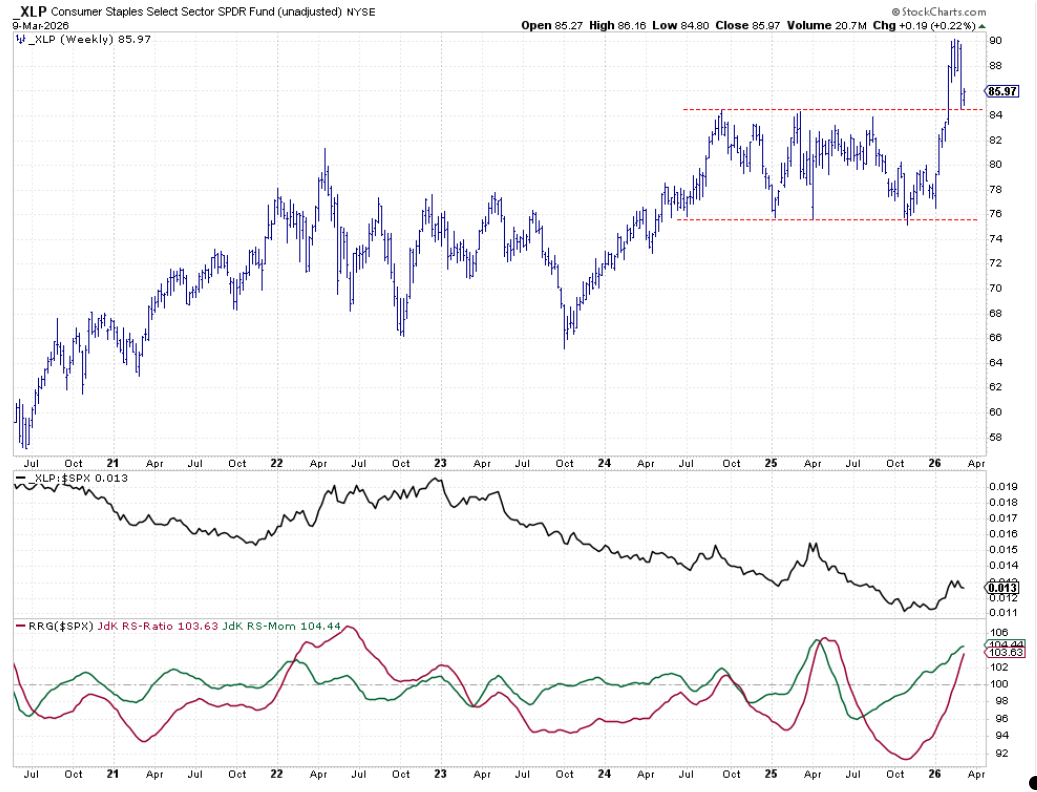
Consumer Staples fell sharply last week, testing previous resistance (just above $84) as new support. If this level holds, it would reinforce the breakout and create upside potential. RRG lines are still trending higher, indicating ongoing strength.
Utilities
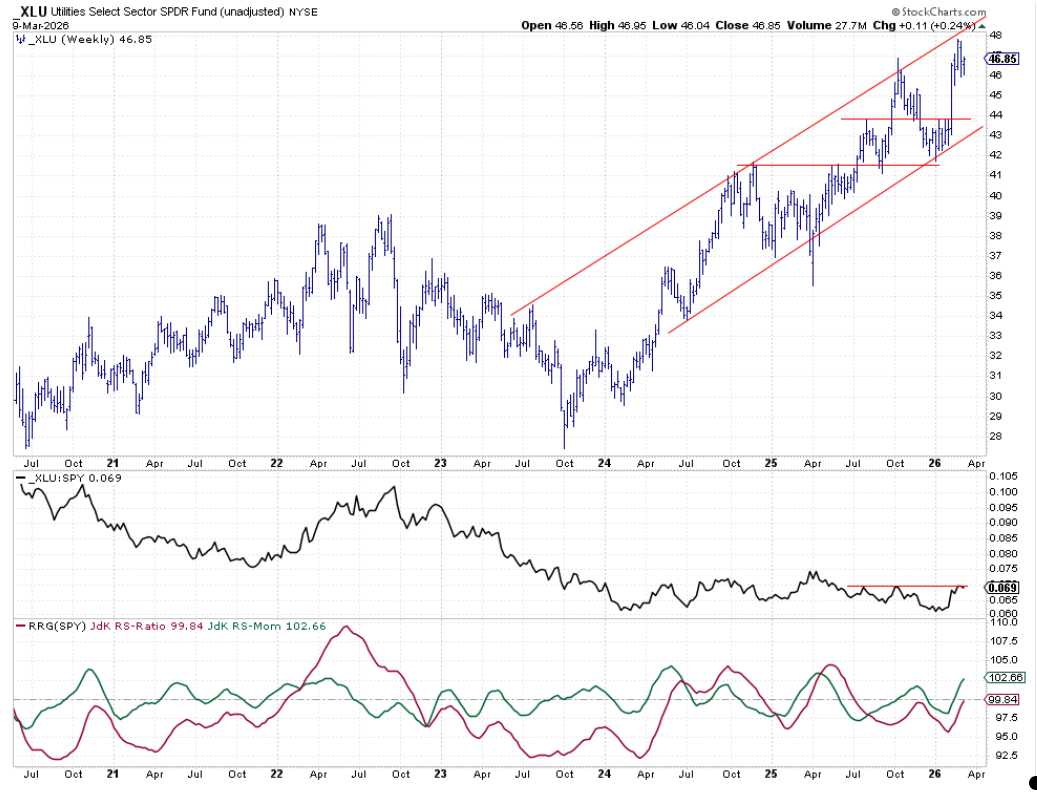
Utilities entered the top five this week, showing positive momentum and heading on the RRG. Their entry reflects a shift in market dynamics, as investors seek stability amid volatility.
Portfolio Performance and Outlook
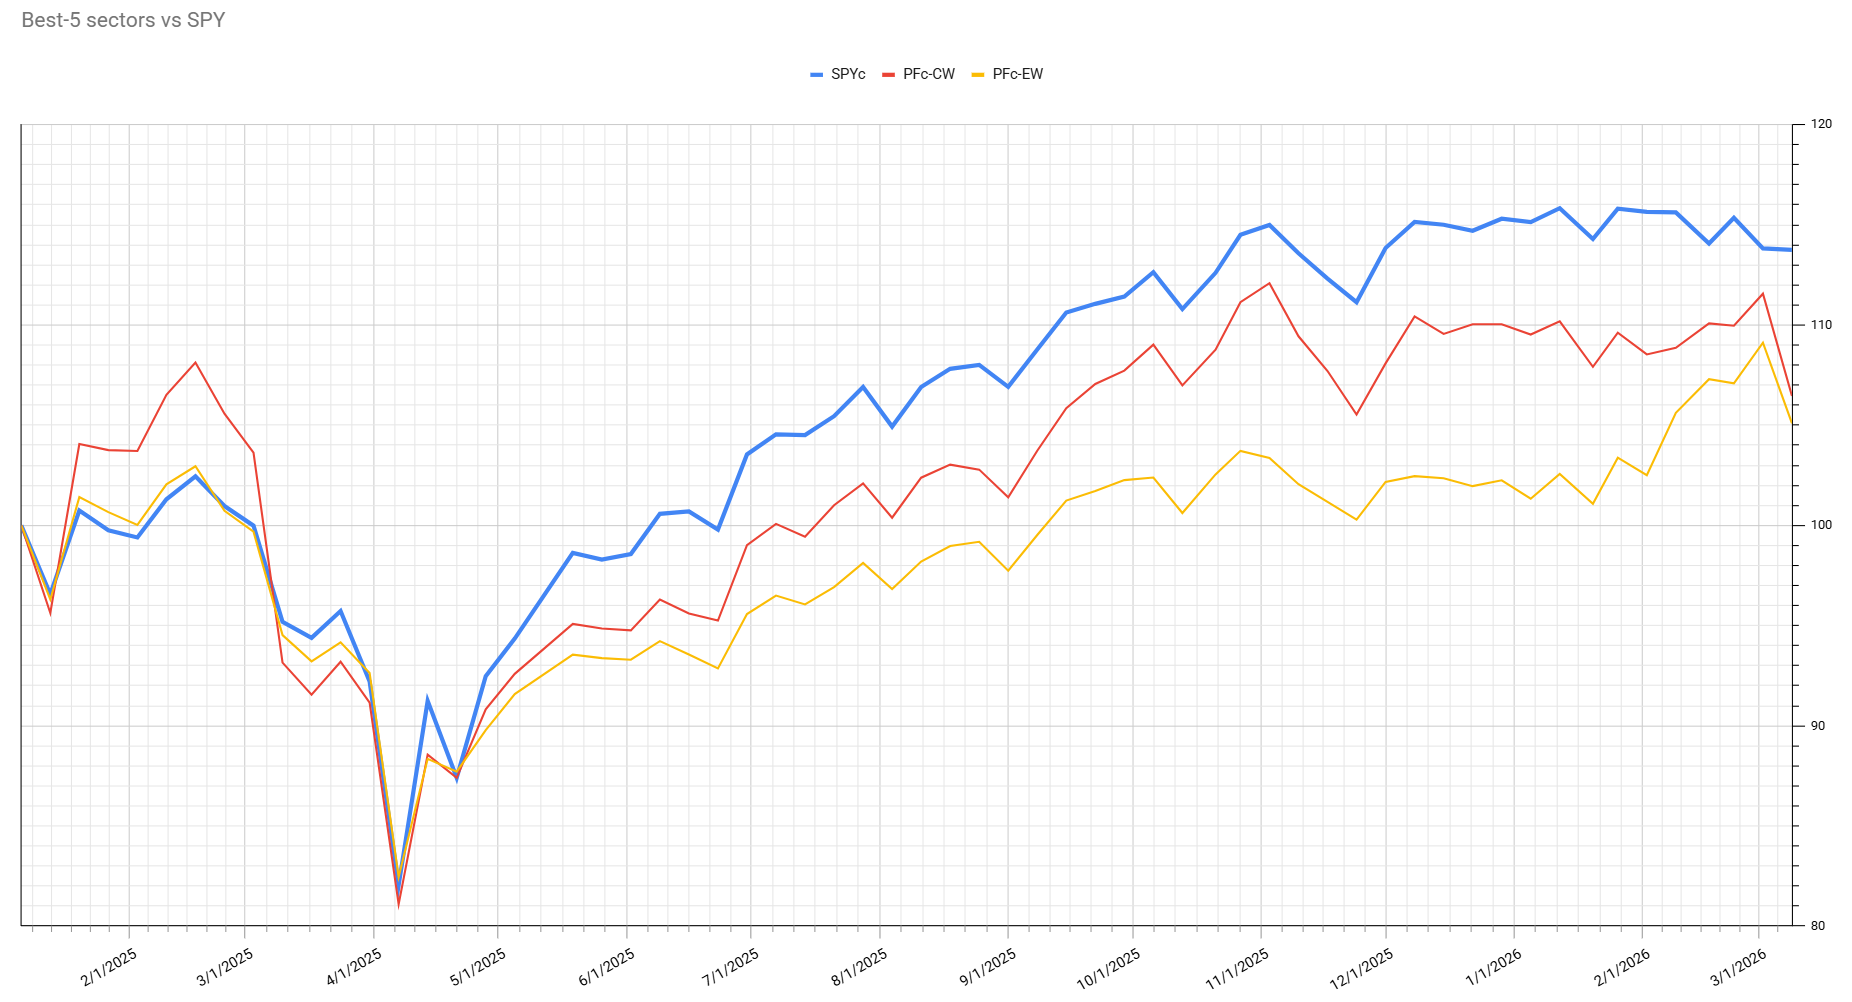
The portfolio took a significant hit last week, mainly due to Industrials (-1.26%) and Health Care (-1.39%, which was still in the portfolio last week. Materials also contributed a smaller loss (-0.58%). These declines widened the gap versus the S&P 500.
For the portfolio to recover, it’s crucial that these sectors stabilize at their current support levels, form new lows, and resume their uptrends, both in price and relative performance. This would help close the performance gap with the S&P 500 over time.
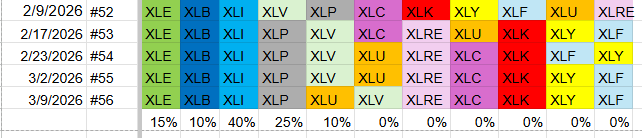
Note that because the Health Care sector has a larger market capitalization than Utilities, the total market capitalization of the top 5 sectors has dropped to 20% of the S&P 500. As a result, the active weights in the other sectors have increased. XLI is at a whopping 40% and XLP at 25%.
#StayAlert, Julius