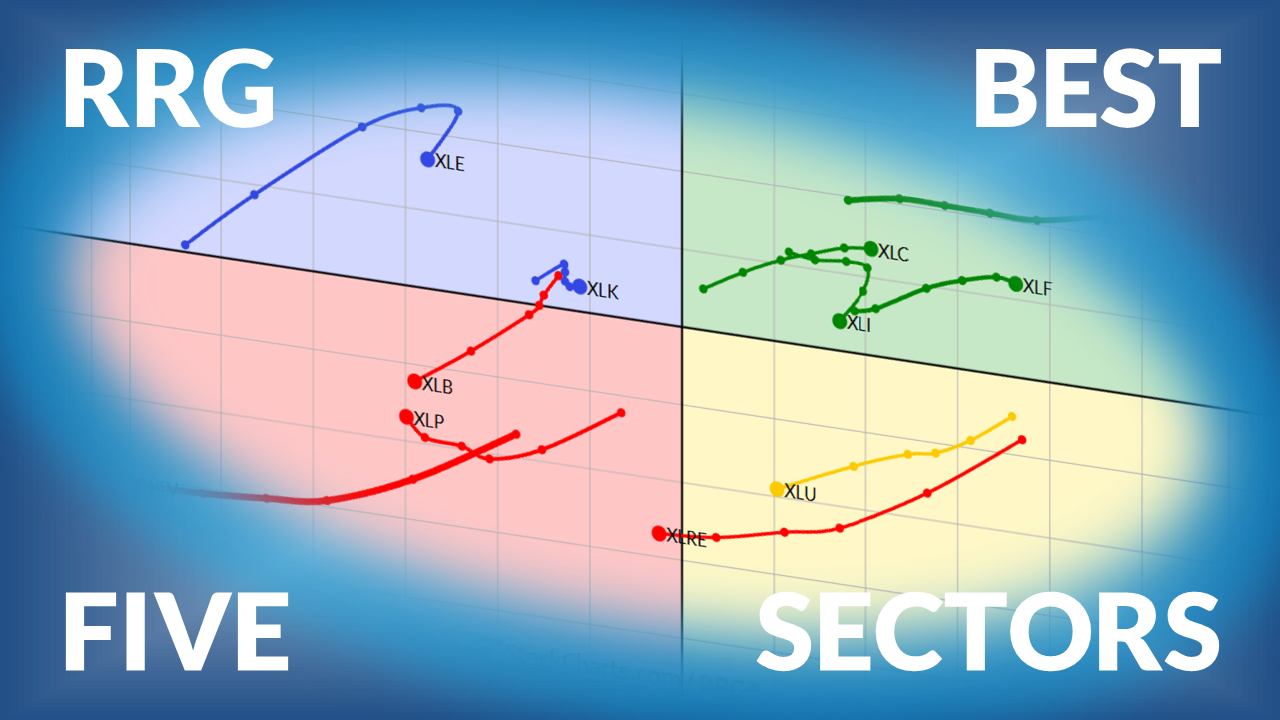
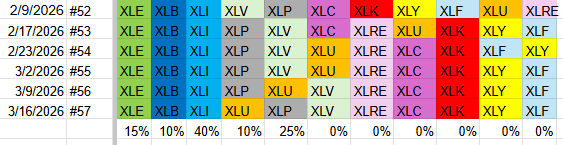
The Best Five Sectors This Week #57
Key Takeaways
- Energy remains the dominant sector.
- The top 5 sectors remain positioned on defense.
- Materials, Industrials, and Staples are rotating through the Lagging quadrant in a corrective move.
- Portfolio performance gap widened once again.
Weekly Sector Rotation Review: Energy Leads, Utilities Climb
At the end of last week, the S&P 500 closed slightly lower, prompting a subtle shift in sector rankings. The top five sectors saw only a swap in positions, Utilities and Consumer Staples, with no new entries or exits.
- (1) Energy - XLE [15%]
- (2) Materials - XLB [10%]
- (3) Industrials - XLI [40%]
- (5) Utilities - XLU [10%]*
- (4) Consumer Staples - XLP [25%]*
- (6) Health Care - XLV
- (7) Real Estate - XLRE
- (8) Communication Services - XLC
- (9) Technology - XLK
- (10) Consumer Discretionary - XLY
- (11) Financials - XLF
Weekly RRG
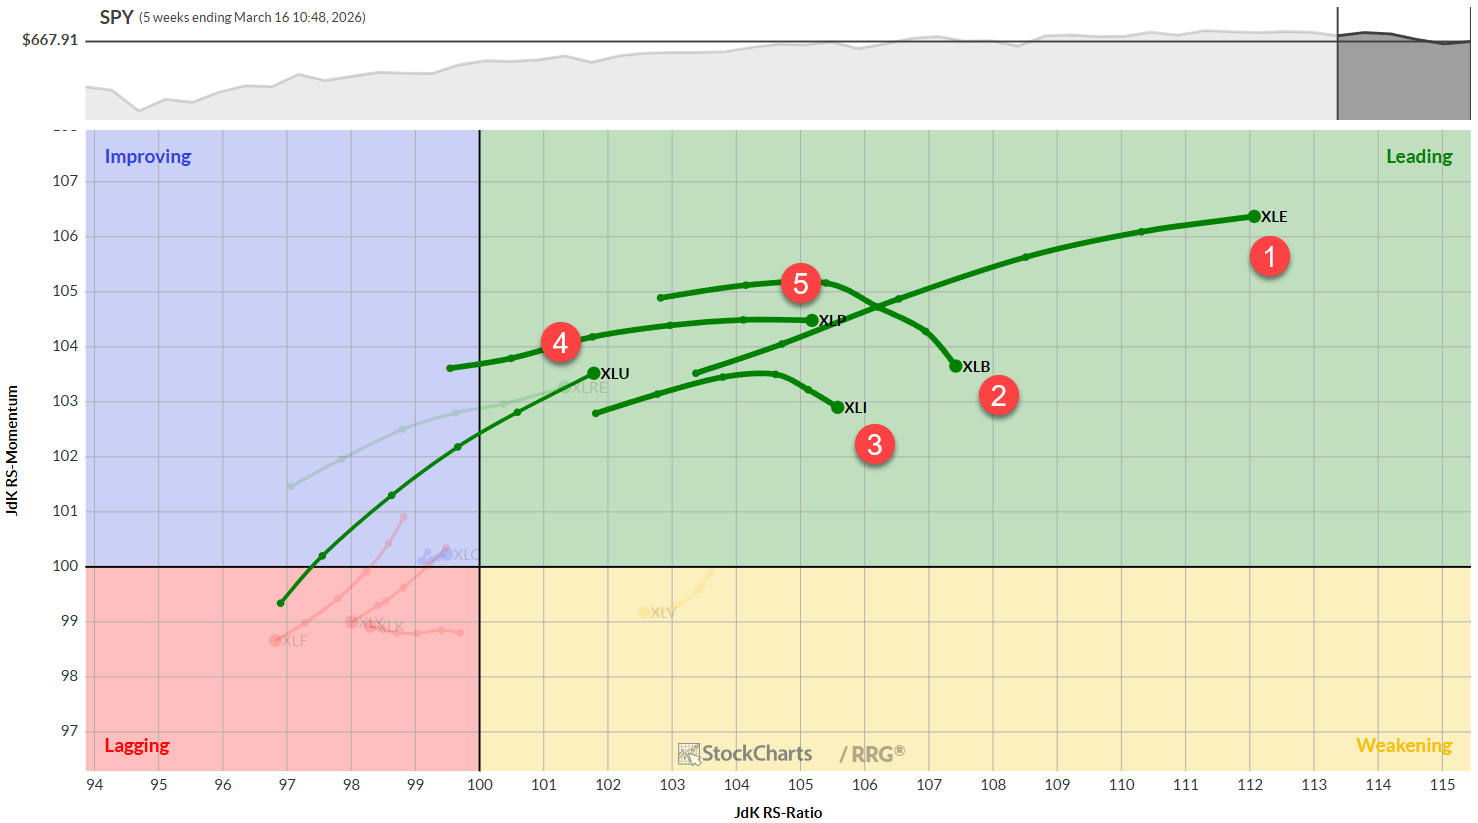
The weekly Relative Rotation Graph (RRG) shows all top five sectors firmly within the leading quadrant. Energy continues to dominate, pushing deeper into the leading quadrant and rising on both scales.
Materials, while rolling over, remain well ahead, suggesting a temporary loss of relative momentum. Industrials are also comfortably inside the leading quadrant at high RS ratio levels, only beginning to lose a bit of momentum.
Utilities, now at number four, have just entered the leading quadrant with a strong RRG heading, continuing to rise on both scales. Consumer Staples, ranked fifth, are well inside the leading quadrant at stable RS momentum levels, moving almost horizontally further into the leading quadrant.
Daily RRG
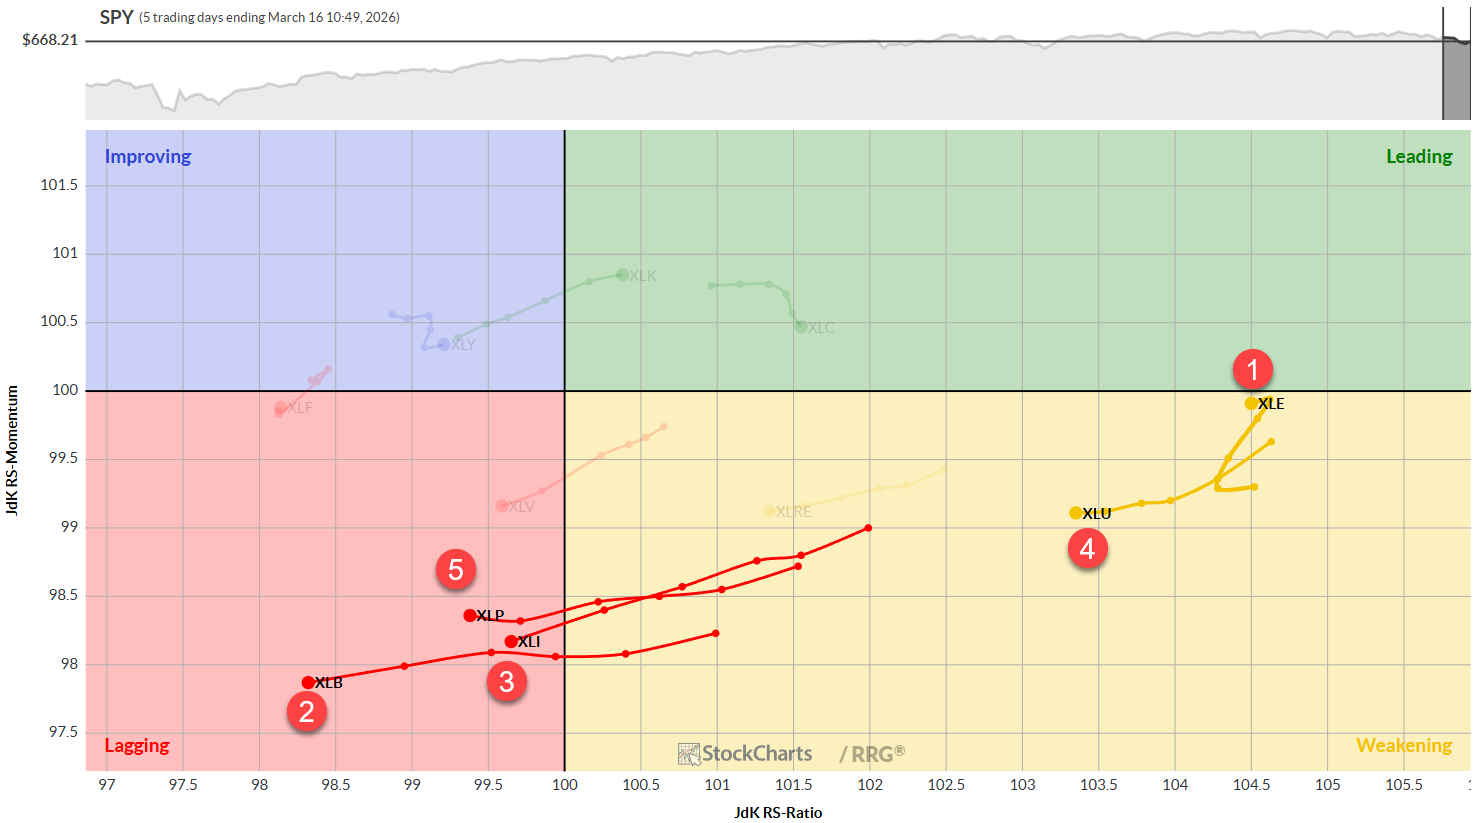
Zooming in on the daily RRG, the energy sector stands out at the highest RS ratio level, moving up toward the leading quadrant but just shy of crossing over.
Materials and Industrials, ranked two and three, have entered the lagging quadrant on the daily RRG, as has Consumer Staples at number five. Despite this, these sectors remain comfortably in the leading quadrant on the weekly RRG, indicating that their move into lagging on the daily timeframe is likely a temporary setback. For these three sectors, the focus will be on their tails curling back up toward the improving quadrant on the daily timeframe, which would confirm the strength seen on the weekly RRG.
Utilities, in the weakening quadrant but at the second-highest RS ratio level, has room to curl back up toward the leading quadrant, completing a leading-weakening-leading rotation and syncing with the weekly RRG.
Sector Highlights
Energy
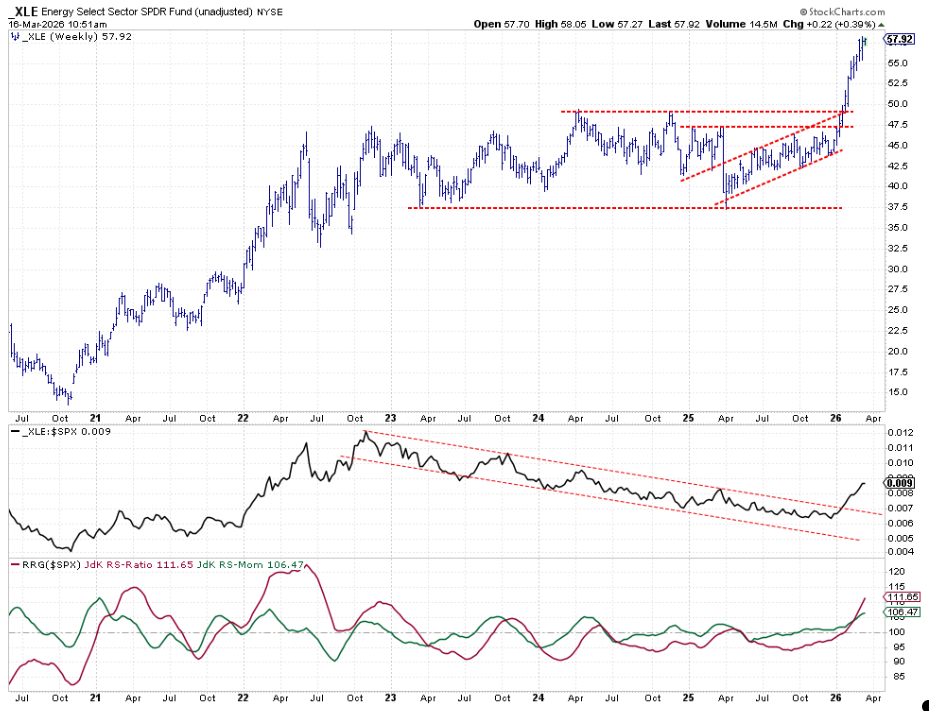
The energy sector is holding up well after breaking above horizontal resistance, showing no significant setback. It has remained stable for two to three weeks, just below the 58 level. Both raw relative strength and RRG lines continue to rise, underscoring the sector's current strength.
Materials
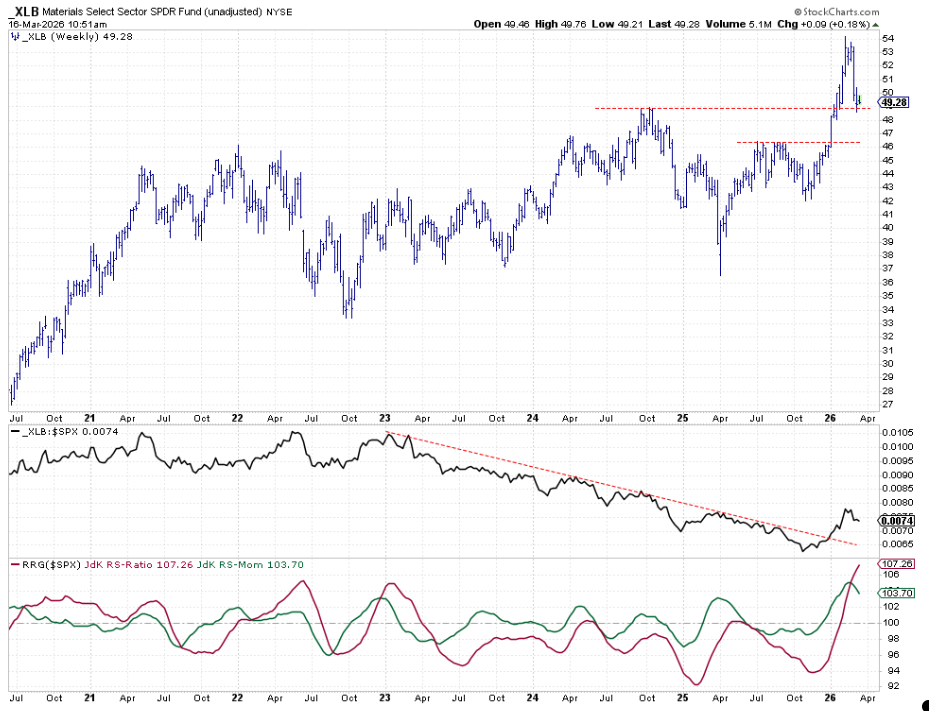
Last week, Materials tested former resistance as support and is holding up well. The raw RS line broke from its falling trend channel and appears to be forming a small new high. The trend reversal remains intact, and a first higher low in raw relative strength is anticipated. The RS-momentum line has rolled over, signaling a slowdown in momentum, but the RS-ratio line is at its highest level in five years.
This recent turnaround is significant, and the setback in relative momentum appears to be the first corrective move after breaking from the downtrend.
Industrials
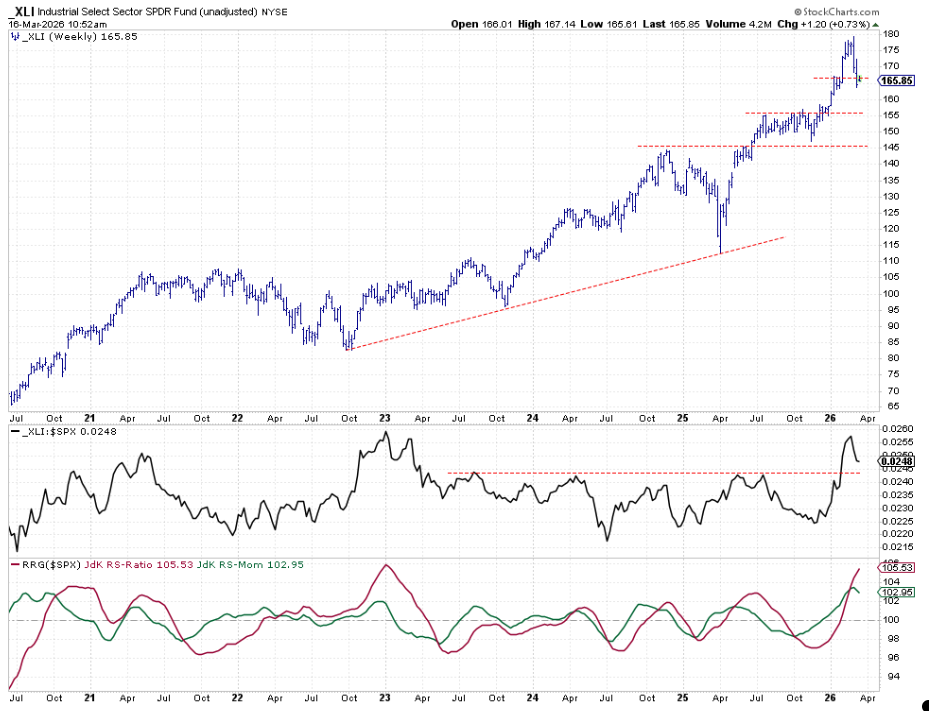
Industrials is around the level of a previous plateau set at the start of the year, which should act as support, but is under pressure.
After two weeks of rapid declines, stabilization is occurring, impacting the raw RS line, which has dropped significantly from its recent high. The line is heading toward its first support level, defined by relative highs from 2023, 2024, and 2025. Meanwhile, the RS-momentum line has rolled over, but the RS-ratio line remains at very high levels, suggesting the odds for a temporary setback are high. Industrials remains one of the stronger sectors in the top five.
Utilities
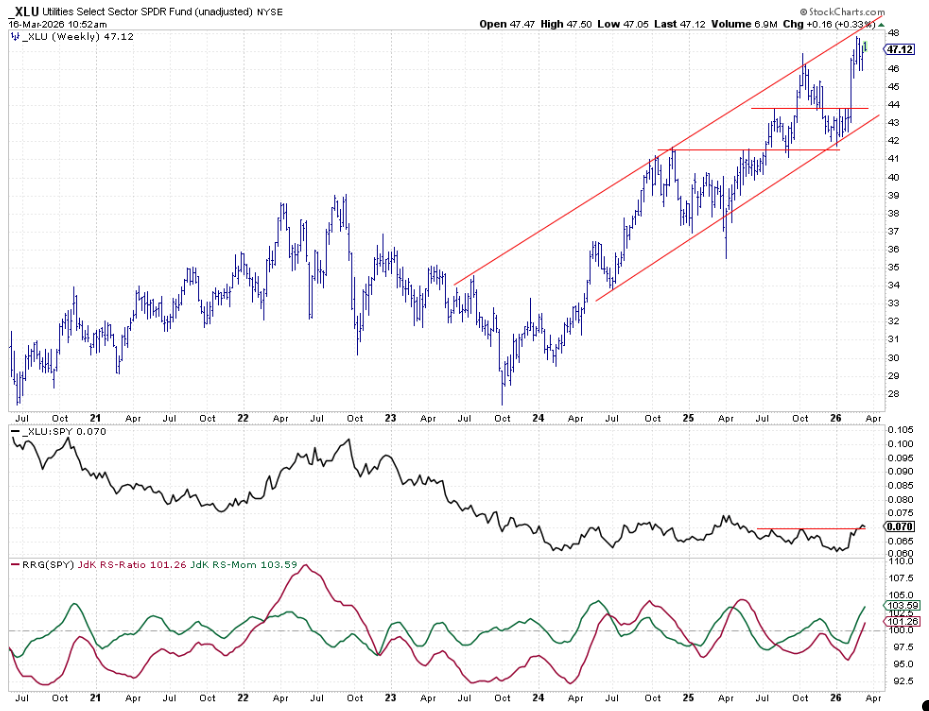
Utilities jumped to the number four position and remains inside the rising trend channel on the price chart, stabilizing around forty-seven. The raw RS line is looking to break overhead resistance for the first time, which is positive and could allow the RRG lines to continue to rise, keeping up that positive RRG-Heading on the tail.
Consumer Staples
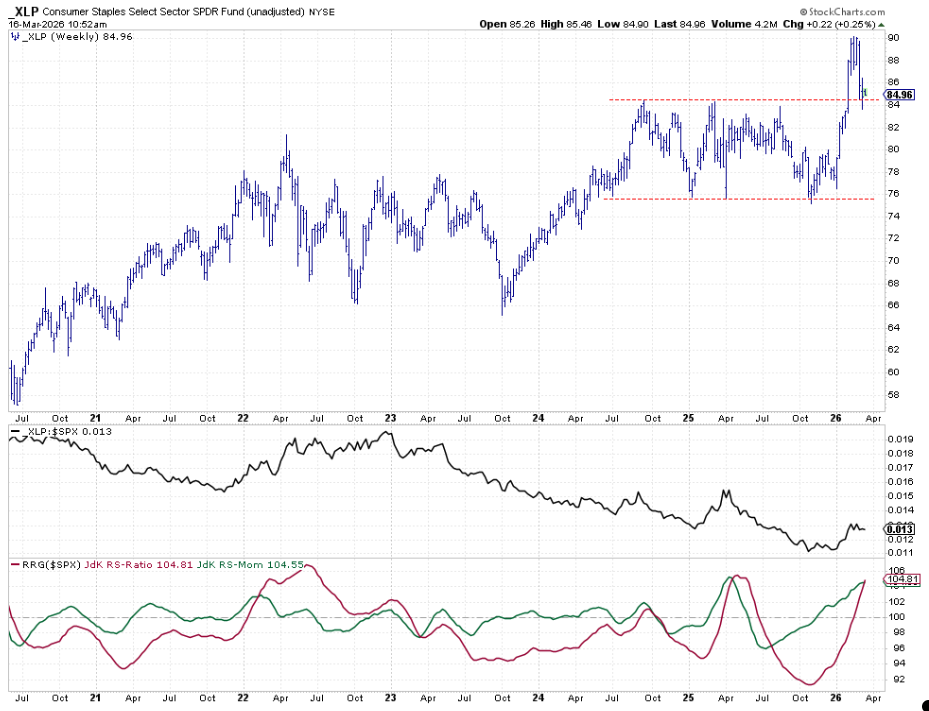
Consumer Staples fell back toward their breakout level, with expected support in the 84 range holding. If a new bottom forms here, it could signal a new rally for the sector. A break from the relative downtrend, which has been intact since the end of 2022, is still needed.
Both RRG lines are well above 100 and continue to rise, maintaining a positive trend in the RRG tail.
Portfolio Performance
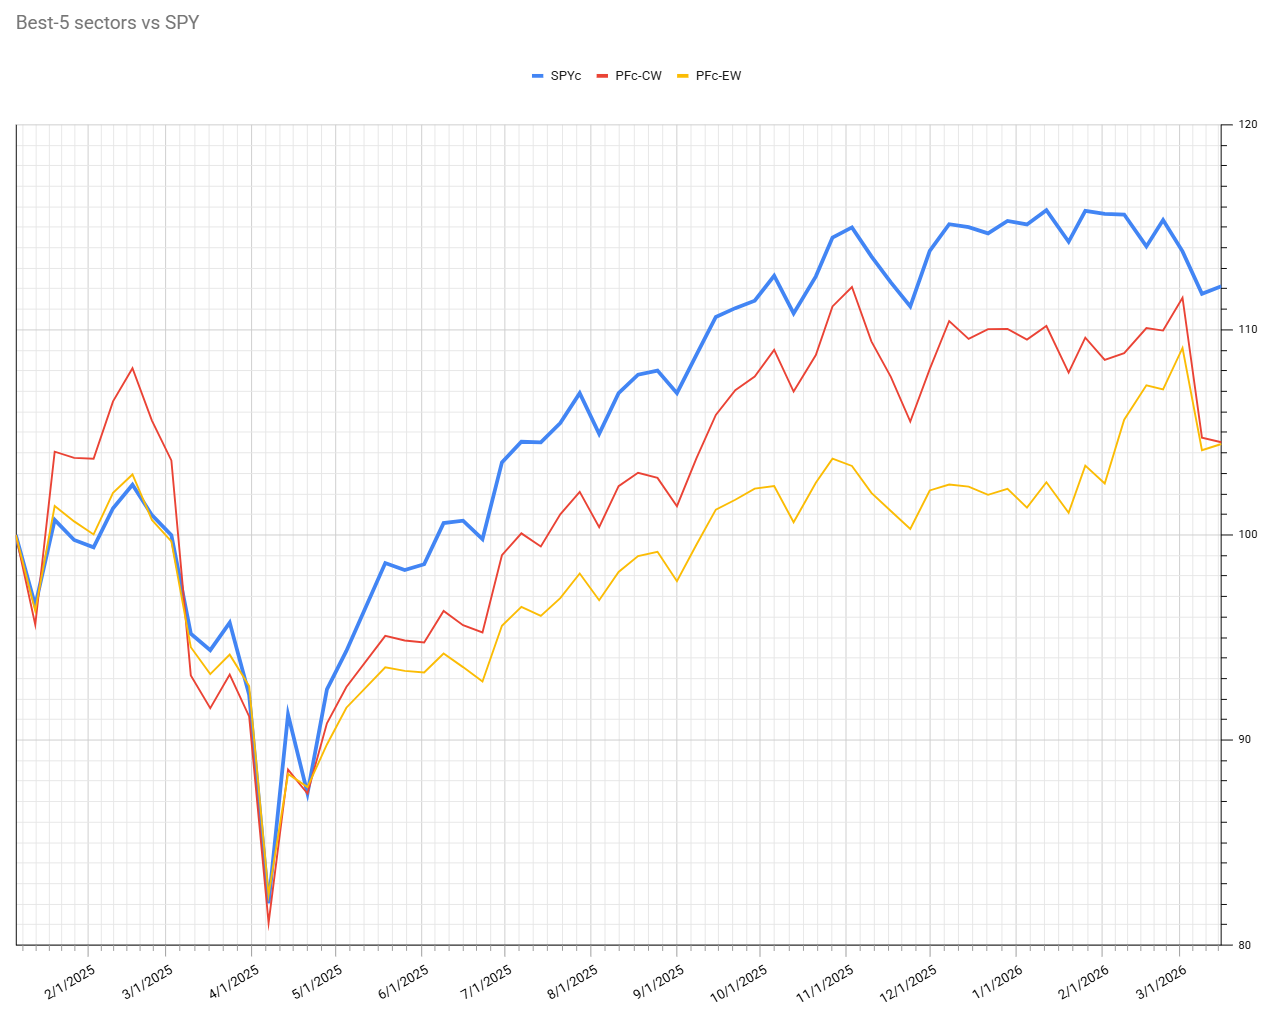
Last week, the gap between the portfolios widened again after initially narrowing. Both cap-weighted and equal-weighted portfolios remain stable at their current levels but are about six to seven points behind the S&P 500. Let's see if the current, more defensive composition of the top 5 will be good enough to start catching up again.
#StayAlert, -Julius