The Best Five Sectors This Week, #48

Key Takeaways
- Healthcare solidifies its position as the number one sector.
- Consumer Discretionary re-enters the top five, pushing Energy out.
- Communication Services moves up the ranks despite a weak position on the Weekly RRG.
- Daily RRG shows short-term rotation favoring the "offensive" sectors (XLY, XLC, XLK) while defensive sectors (XLV, XLU) take a breather.
The defensive rotation led by Healthcare and Utilities is stalling. The S&P 500 has paused near its highs while short-term rotation favors more offensive sectors.
The most notable change in the rankings this week is the return of Consumer Discretionary (XLY) to the top five, replacing Energy (XLE), which has dropped out. Health Care (XLV) remains the undisputed leader at number one. Technology (XLK) holds steady at number two, Communication Services (XLC) has climbed to number three, and Utilities (XLU) slipped one spot to number four.
At the bottom of the list, Materials and Real Estate have swapped positions.
- (1) Health Care - (XLV)
- (2) Technology - (XLK)
- (5) Communication Services - (XLC)*
- (3) Utilities - (XLU)*
- (6) Consumer Discretionary - (XLY)*
- (4) Energy - (XLE)*
- (7) Industrials - (XLI)
- (8) Financials - (XLF)
- (10) Materials - (XLB)*
- (9) Real Estate - (XLRE)*
- (11) Consumer Staples - (XLP)
Weekly RRG
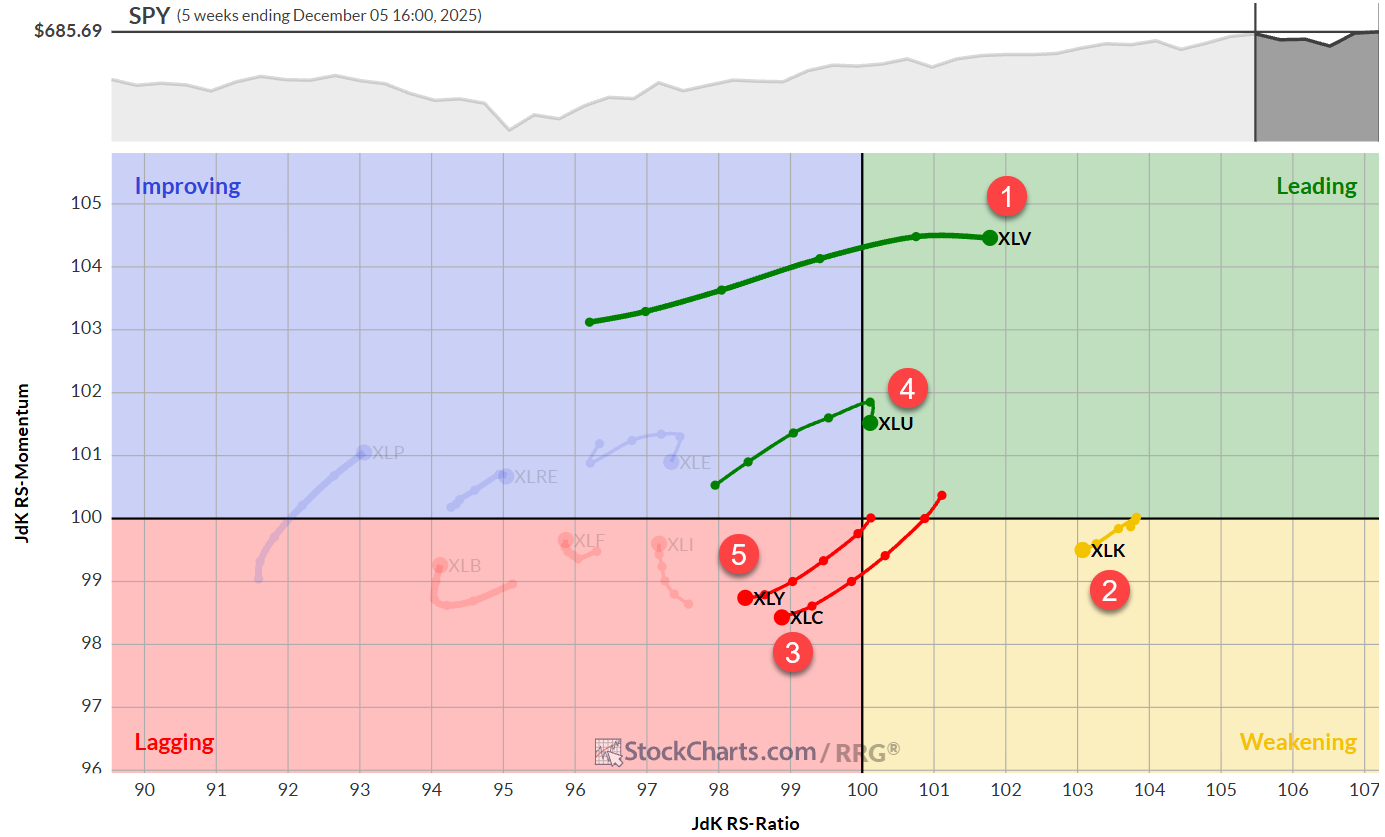
The Weekly Relative Rotation Graph (RRG) highlights the dominance of Health Care (XLV). It is positioned deep inside the Leading quadrant, with the highest RS-Ratio and RS-Momentum combination of the group. Utilities (XLU) showed strength, and crossed over into leading but immediately rolled over. That is a warning sign.
The remaining three sectors in our top five — Technology (XLK), Communication Services (XLC), and Consumer Discretionary (XLY) — present a more complex picture. Technology is in the Weakening quadrant (yellow), indicating a pause in its long-term uptrend. More concerning are XLC and XLY; despite their high ranking in the top five, both are currently traveling through the Lagging quadrant (red) on the weekly timeframe. This suggests their inclusion in the top five is driven by recent short-term improvements or legacy strength that hasn't fully dissipated, but the weekly trend remains under pressure.
Daily RRG
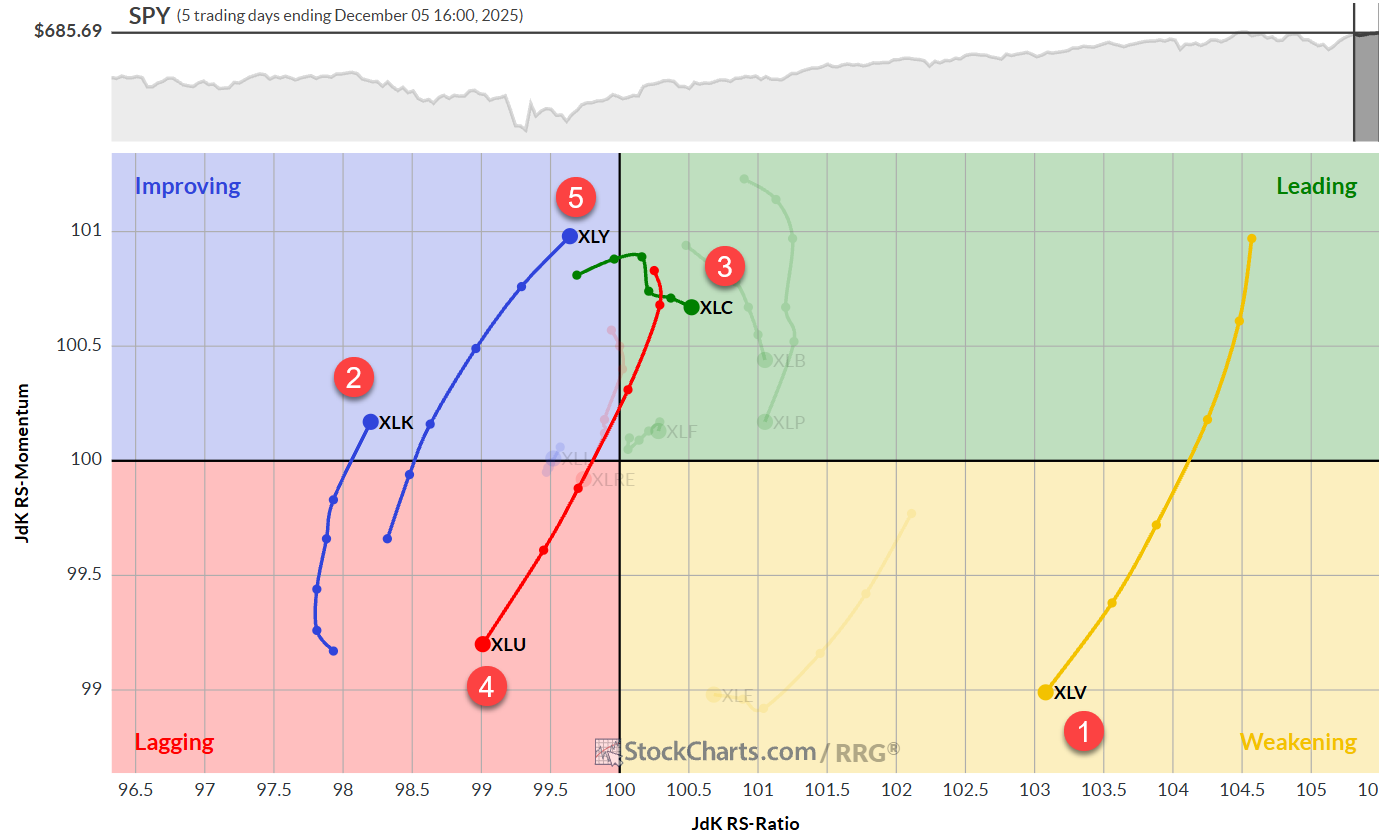
The Daily RRG tells the story of the short-term rotation that is keeping the growth sectors alive in the rankings.
While Health Care (XLV) and Utilities (XLU) are showing tails moving into the lagging/weakening quadrants, indicating a short-term pause, the offensive sectors are waking up.
Communication Services (XLC) is firmly inside the Leading quadrant on the daily chart with a strong tail. This caused XLC to jump back to #3 after having slipped lower over the past few weeks.
Consumer Discretionary (XLY) and Technology (XLK) are sweeping through the Improving quadrant (blue) with positive headings, signaling that relative momentum is returning to these sectors in the very short term.
This divergence between the weekly and daily RRG explains why XLC and XLY remain in the top five despite their weak weekly positioning; the daily momentum is currently providing enough lift to support their rank.
Healthcare
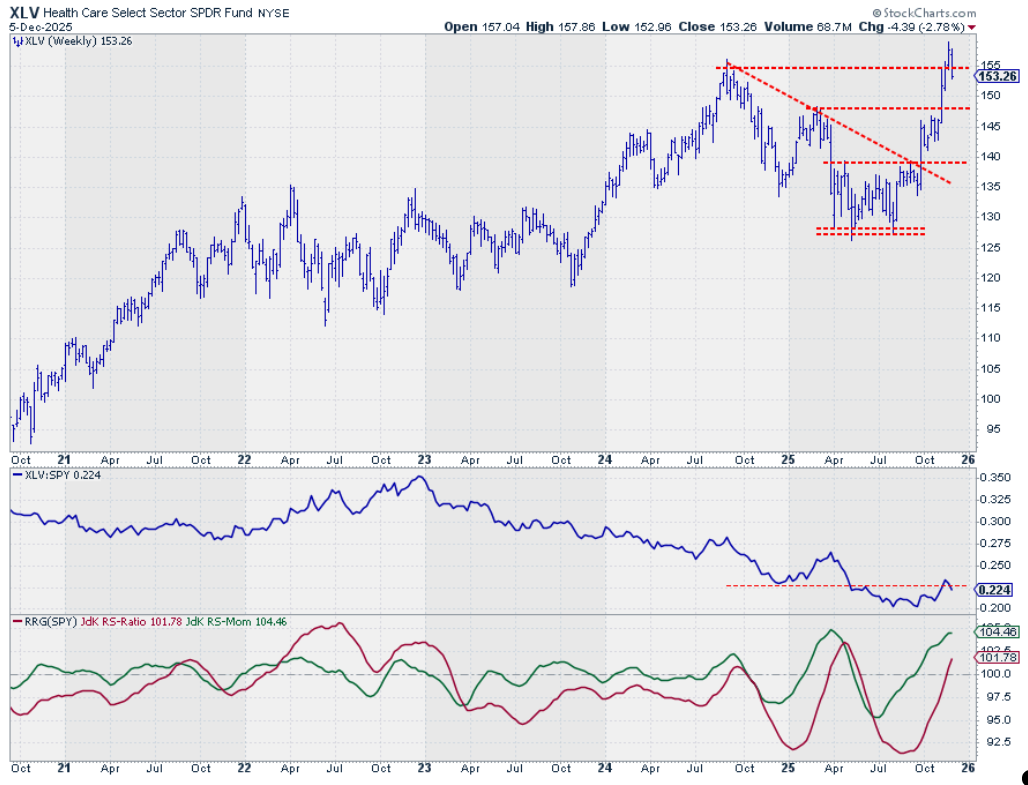
Health Care (XLV) remains the strongest chart in the universe. But price just dropped back below its previous high as support in that area failed to hold. This makes 147.50 the next support level to watch.
Technology
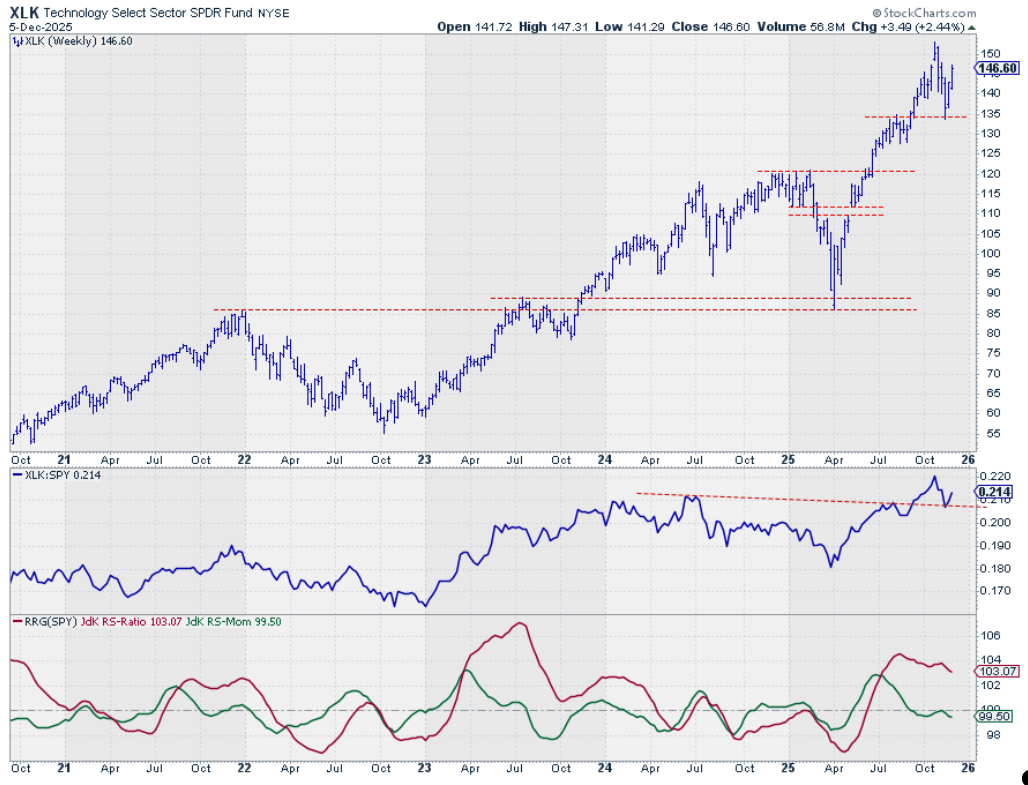
Technology (XLK) bounced off of support near 135 and is now rapidly in the way back to its all-time-high level above 150. This higher low underscores that the uptrend is still intact.
A similar move is seen on the raw RS chart, which also bottomed out at the level of two former peaks, now acting as support. The RRG-Lines are still digesting the recent decline, pushing the XLK tail into the weakening quadrant on the RRG. Given the high reading of the RS-Ratio line, this move is still judged as being temporary.
Communication Services
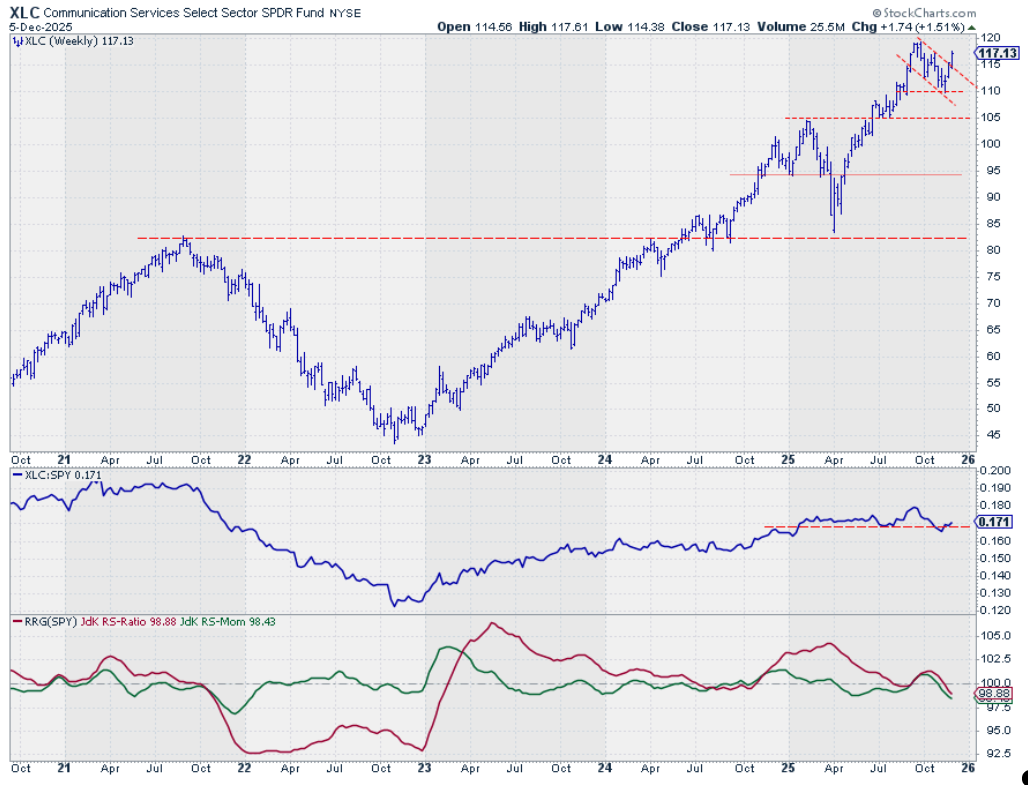
Communication Services (XLC) presents a mixed picture. The price chart shows a rally off the recent lows and a breakout from a flag-like pattern (=bullish).
However, the relative strength picture on this weekly chart is concerning. The raw RS line broke below its support area and then returned above it. Both RRG lines are clearly below 100 and trending lower, placing the sector in the Lagging quadrant on the weekly timeframe.
The sector's jump to the #2 spot is coming from the rapid improvement on the daily RRG, and it will become interesting to see if this is a return to the long term relative uptrend for XLC or the first recovery rally after starting a new downtrend.
Utilities
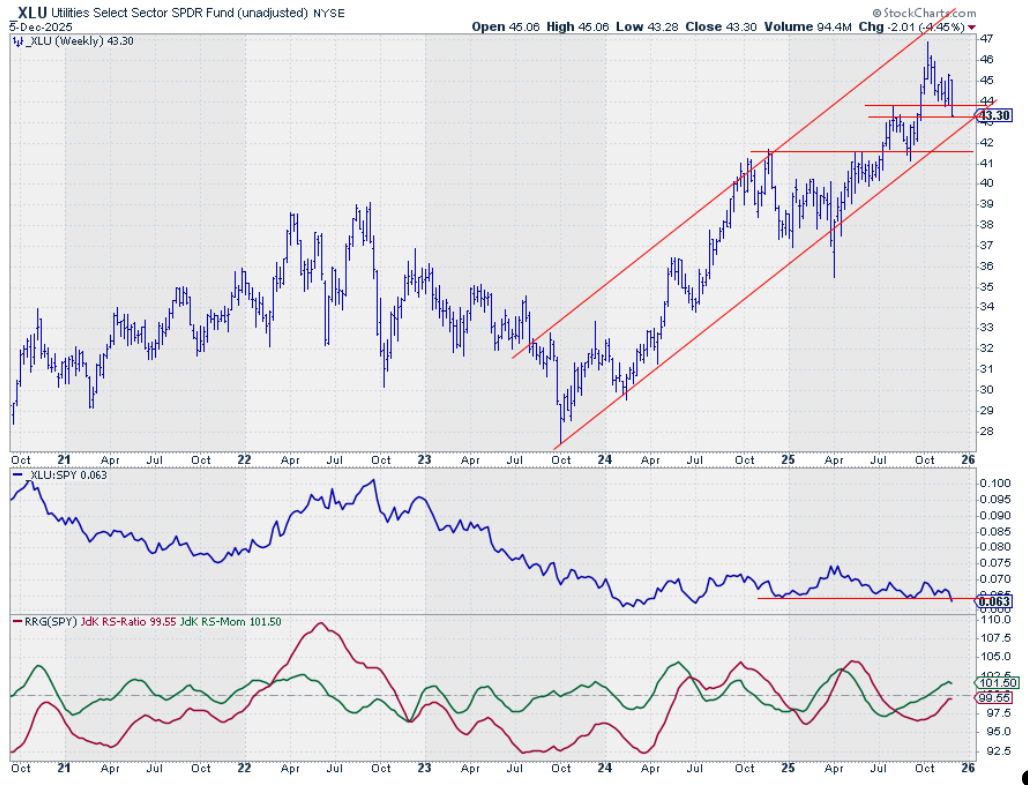
Utilities (XLU) continues to trade within a well-defined rising channel, but dropped below its first support level and is now testing the lower boundary of that support "range". After that, there's not much space left within the rising channel.
The relative strength line also dropped below a horizontal support level, making the outlook shaky in the near term.
Consumer Discretionary
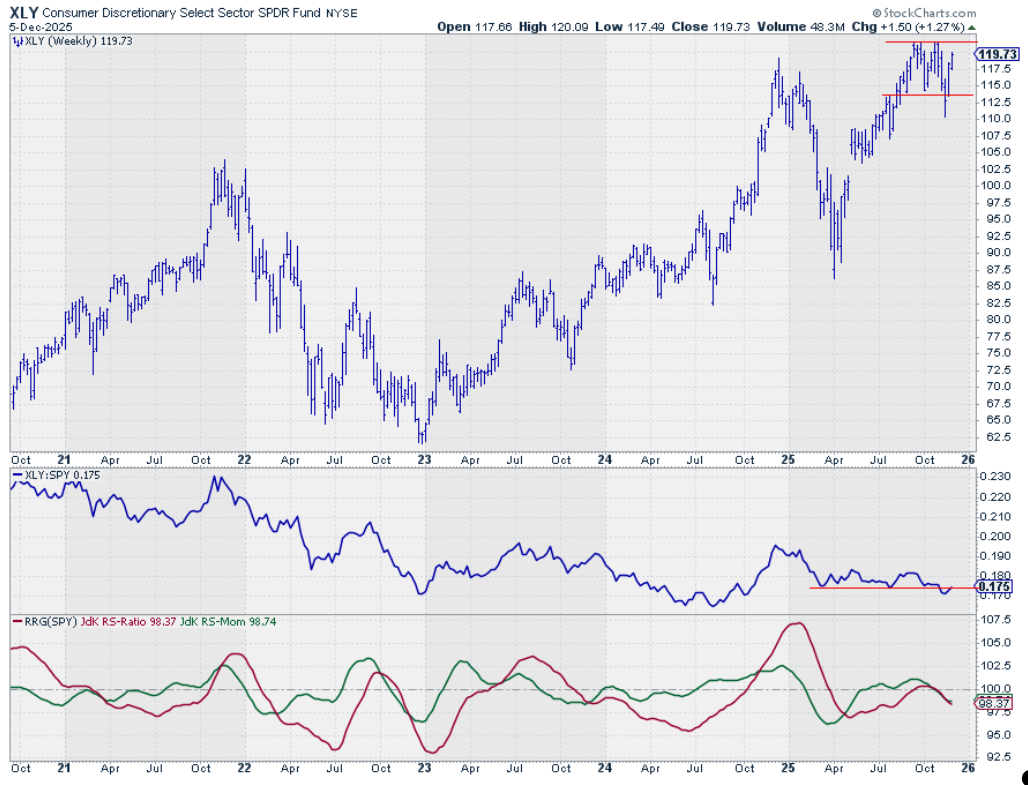
Consumer Discretionary (XLY) rounds out our top five, having re-entered the list this week. The price chart shows the sector challenging resistance near $120 after a rapid dip to, and recovery from, the 110 area.
Relative strength dropped below support and dragged both RRG-Lines below 100 in this move, which positions XLY inside the weakening quadrant on the weekly RRG. Here also, the daily rotation shows strength, and the answer we are waiting for is whether this short-term move is a recovery within the weekly downtrend or the start of a turnaround.
Portfolio Performance
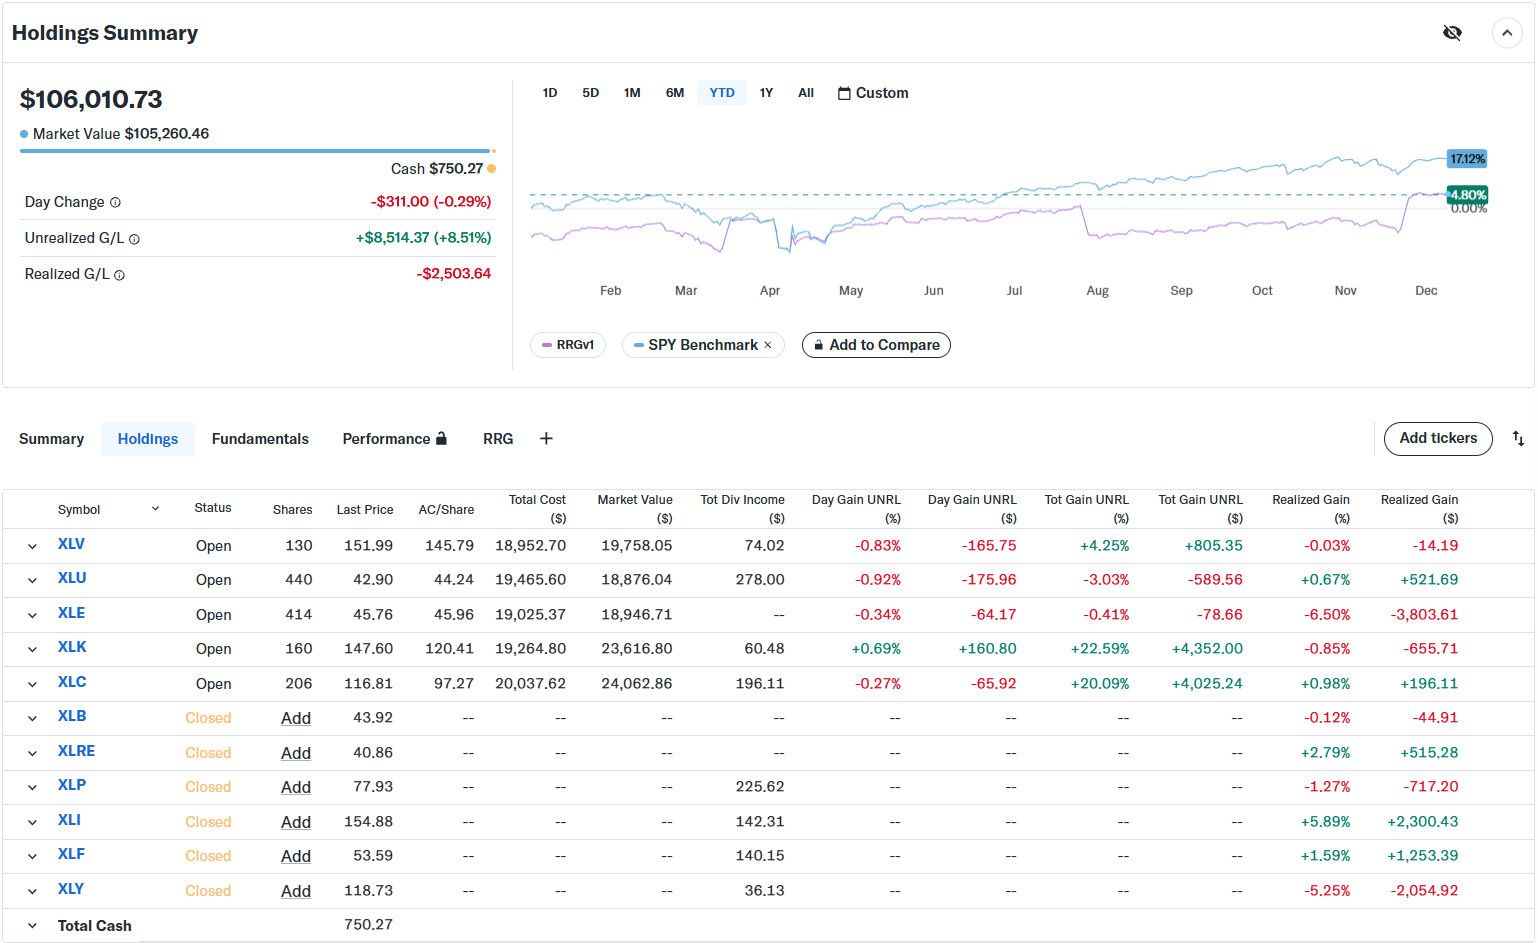
The performance of the equal-weight portfolio continues to lag SPY despite some catching up last week.
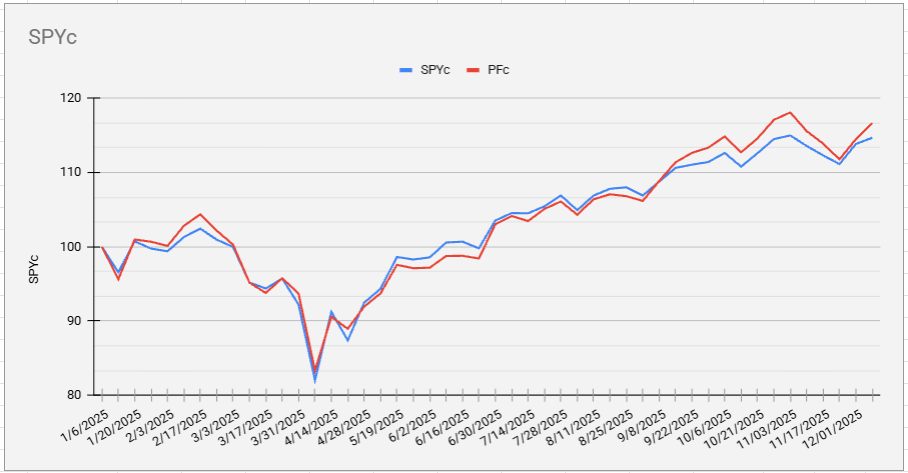
The cap-weighted portfolio is now up 2% vs SPY.
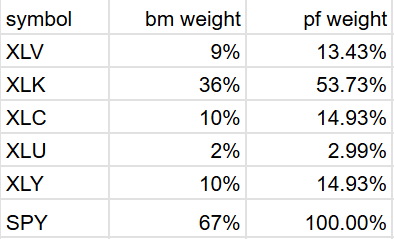
To illustrate this further, the table below shows the current weightings of the top-5 sectors based on their relative market capitalizations. As you can see, XLK is now a whopping 53.73% of the portfolio.
#StayAlert and have a great week, -Julius


