The Best Five Sectors This Week #59
Key Takeaways
- The Energy sector remains the standout leader.
- Materials, Industrials, Consumer Staples, and Utilities are all showing renewed strength.
- Portfolio performance is improving, and defensive positioning is starting to pay off.
Energy Leads the Charge as Portfolio Performance Improves
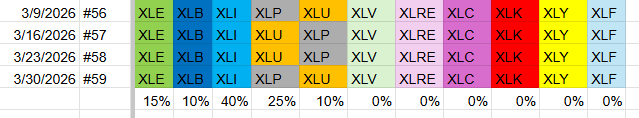
After a challenging week for the stock market, sector rankings changed little. The only shift in the top five was Consumer Staples moving up one spot; the overall composition remained intact, and all other sector rankings held steady.
As we enter the new week, the sector standings are as follows:
- (1) Energy - XLE [15%]
- (2) Materials - XLB [10%]
- (3) Industrials - XLI [40%]
- (5) Consumer Staples - XLP [25%]*
- (4) Utilities - XLU [10%]*
- (6) Health Care - XLV
- (7) Real Estate - XLRE
- (8) Communication Services - XLC
- (9) Technology - XLK
- (10) Consumer Discretionary - XLY
- (11) Financials - XLF
Weekly RRG
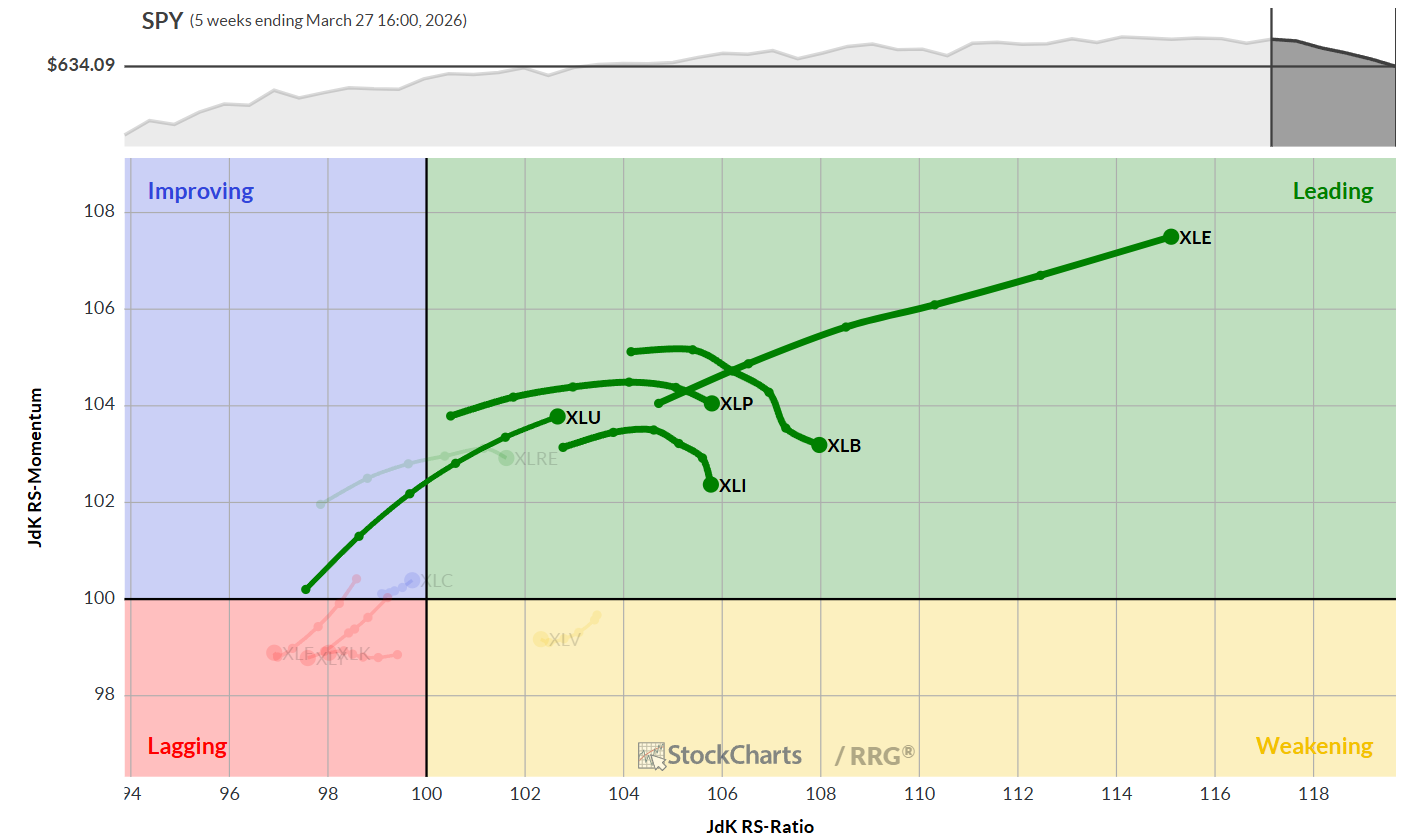
The weekly RRG continues to highlight the strength of the Energy sector, which is pulling away from the rest of the pack. Materials, in second place, is also trending higher on the RS ratio scale, showing a robust relative trend despite a slight dip in momentum. Consumer Staples is following a similar path, with a minor loss in momentum that isn’t yet significant.
Utilities is moving strongly into the leading quadrant, rising on both axes. Industrials is rolling over within the leading quadrant – still strong, but with a slight loss of momentum.
Overall, these five sectors are comfortably leading, underscoring the strength of their current trends.
Daily RRG
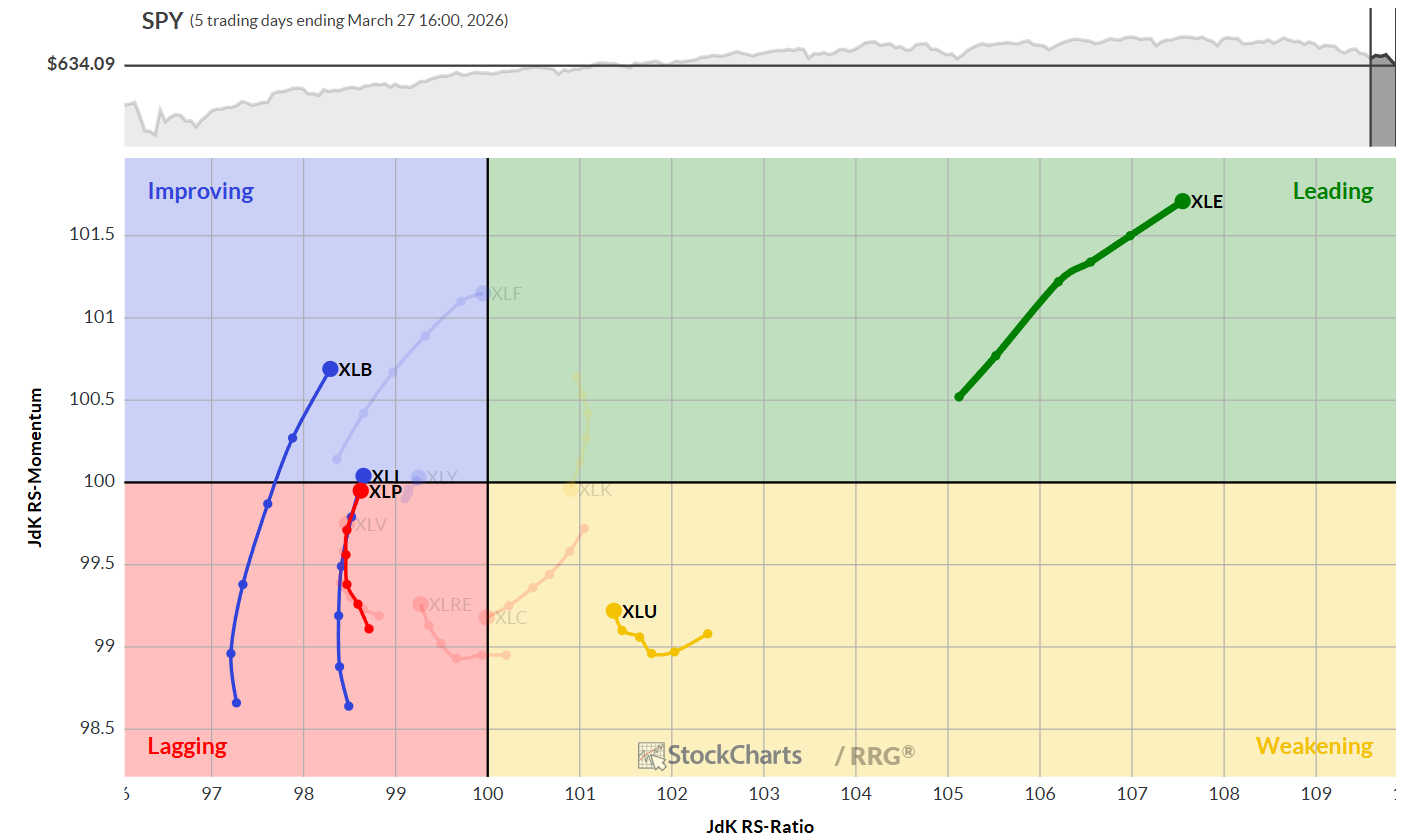
Zooming in on the daily RRG for the top five sectors, Energy stands out deep in the leading quadrant, maintaining a strong positive heading. The other four sectors, which recently experienced a corrective phase, are now regaining relative momentum.
Utilities is rotating from leading to weakening and back to leading—a powerful pattern. Materials, Industrials, and Staples are all picking up momentum and getting back into alignment with their strong weekly trends.
Sector Highlights
Energy
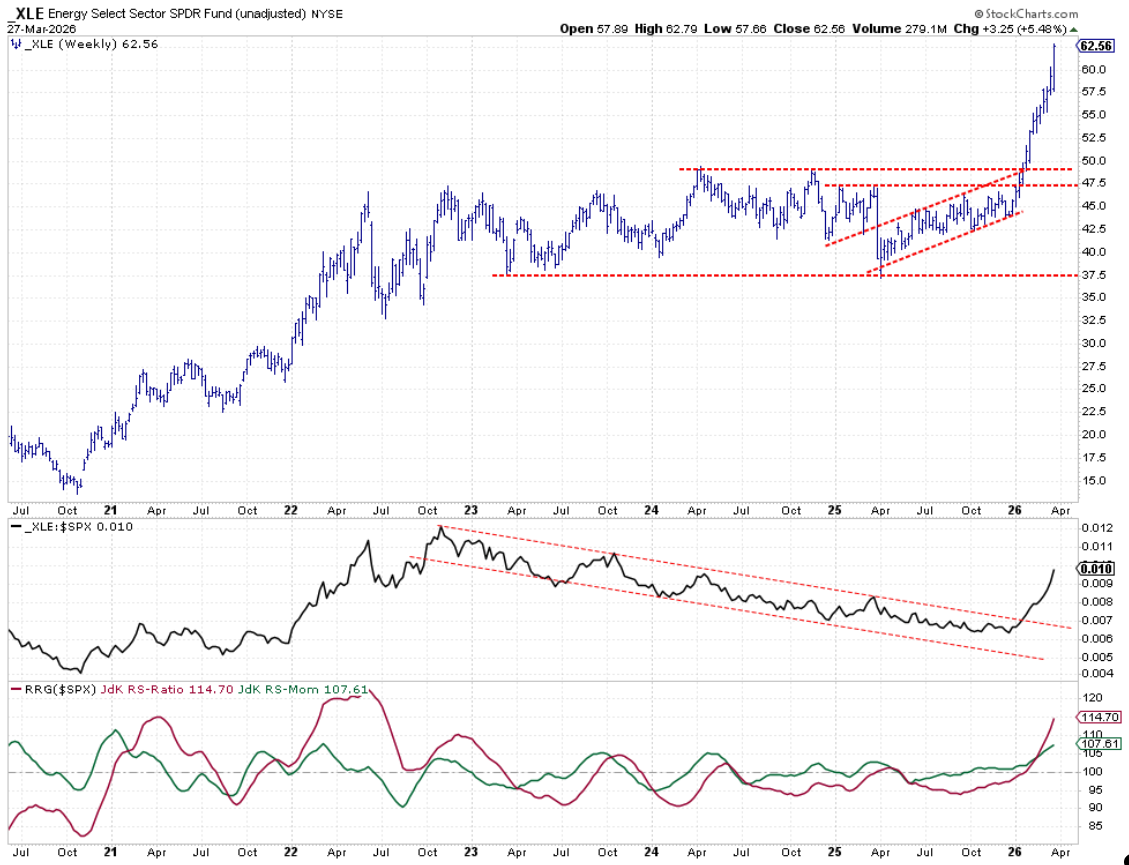
The Energy sector continues its almost vertical ascent, closing above 62.50 last week. This strength is reflected in the raw relative strength line, which has broken out of its previous downtrend. Both RRG lines are well above 100 and rising, making Energy the clear leader among all sectors.
Materials
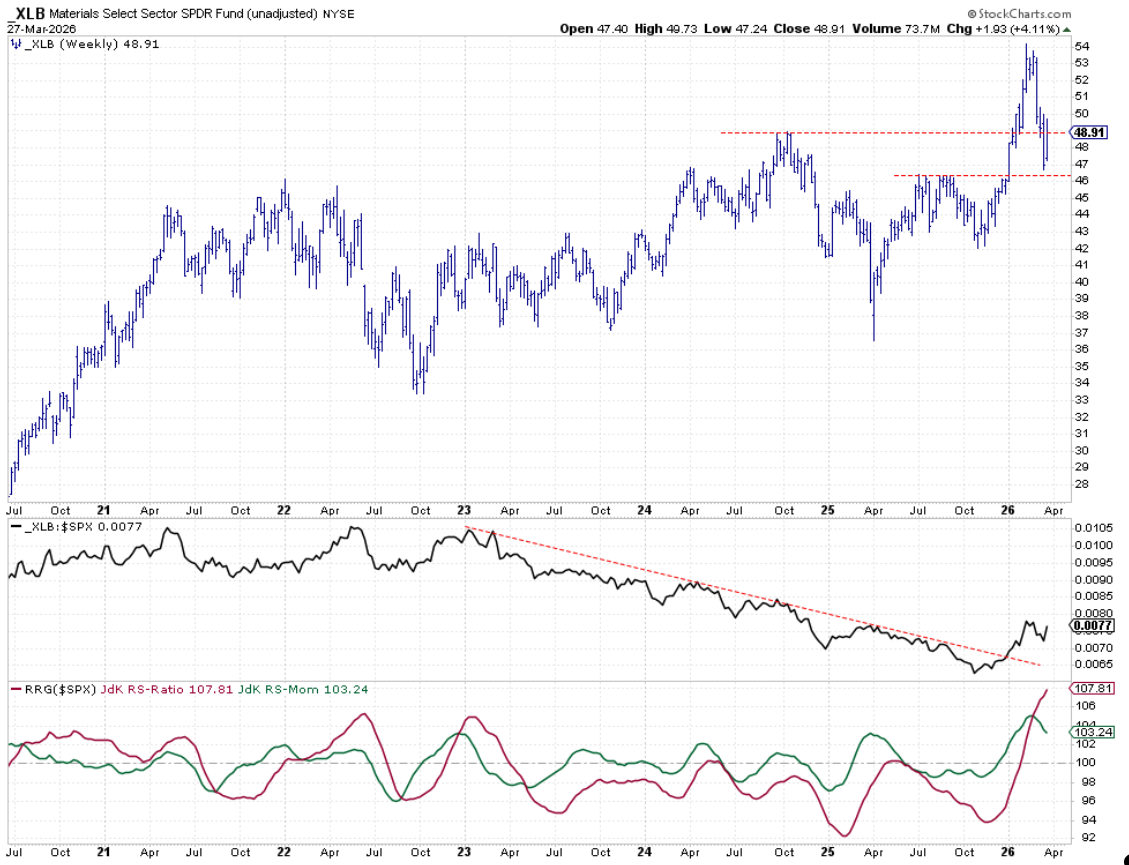
Materials found a higher low last week, stabilizing between $46 and $47 and ending near a key support area. If the sector moves higher from here, the positive trend should continue, supported by a recovering relative strength line. The RRG lines remain strong, despite a slight dip in momentum.
Industrials
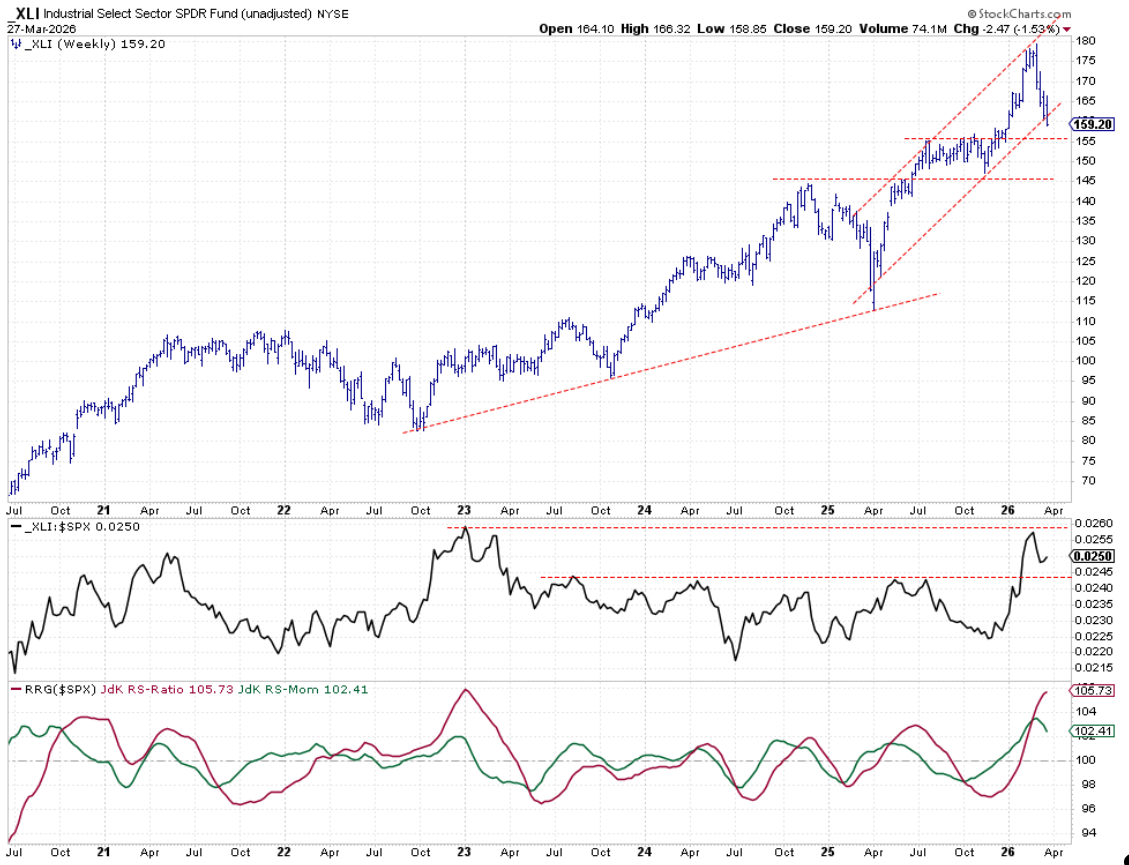
Industrials appear to be bottoming out at the lower boundary of their rising trend channel. If the sector can hold these levels and break above the 2023 high in relative strength, it would confirm a strong trend. As long as prices stay within the channel, the outlook remains positive.
Consumer Staples
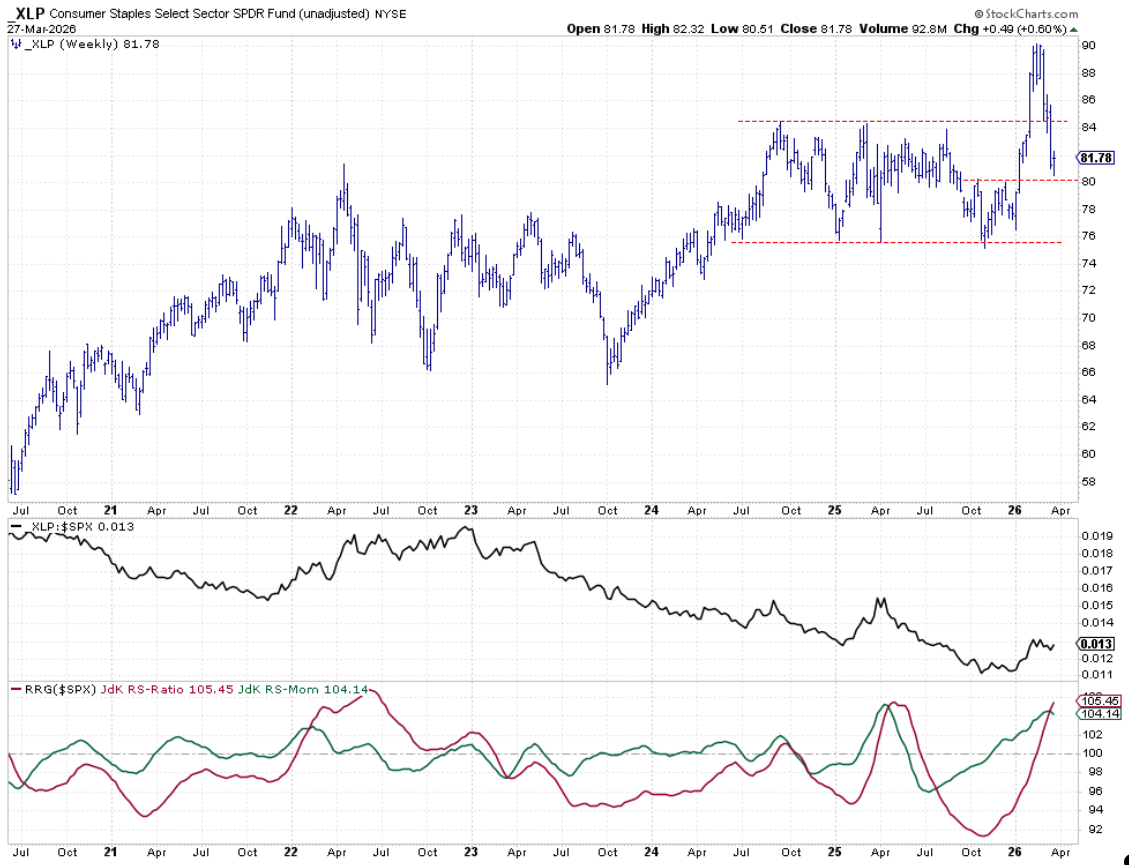
Consumer Staples (XLP) slipped below previous resistance but found support around $80, a level marked by previous highs. Holding this support would establish a new higher low, reinforcing the positive trend. A continued rise in the relative strength line would confirm the uptrend identified earlier this year.
Utilities
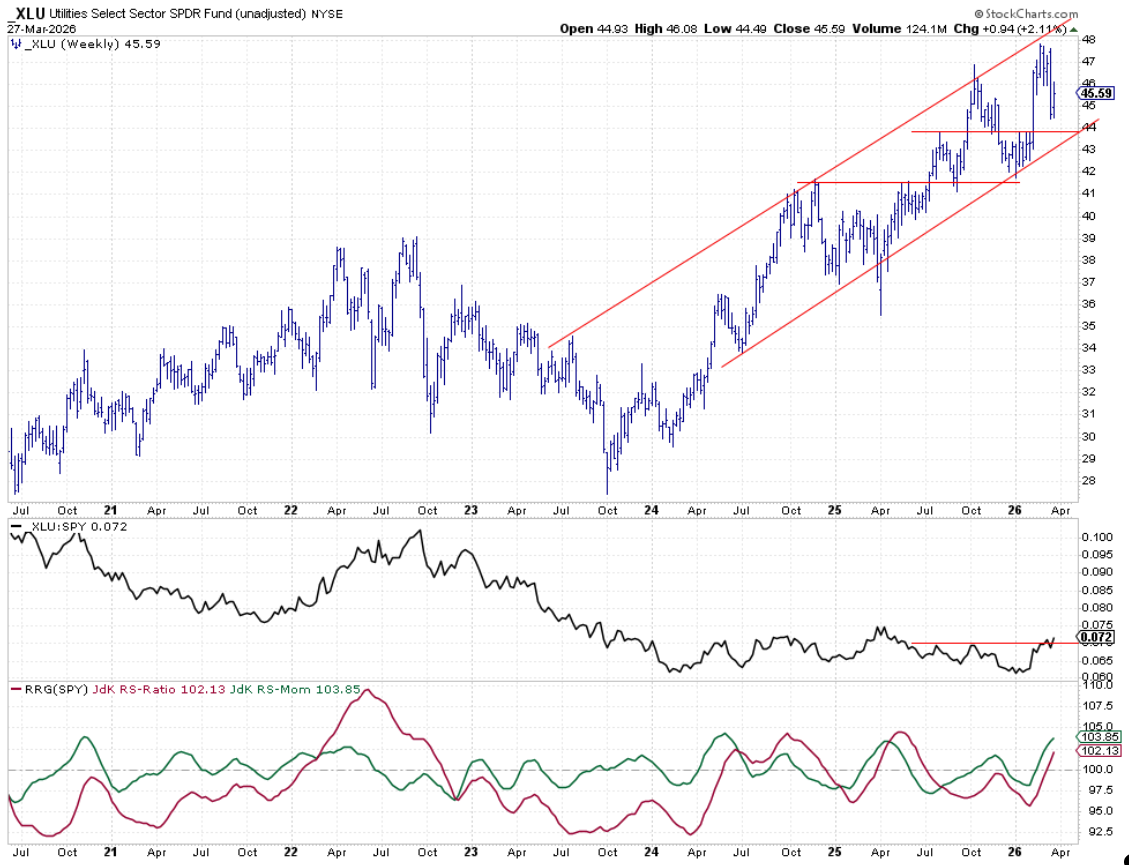
Utilities remain strong within their rising channel. Recent lows didn’t test previous support, indicating buyers are stepping in earlier. The relative strength line is poised to break above resistance, signaling a continuation of the trend. Both RRG lines are above 100 and climbing, supporting the sector’s positive outlook.
Portfolio Performance Update
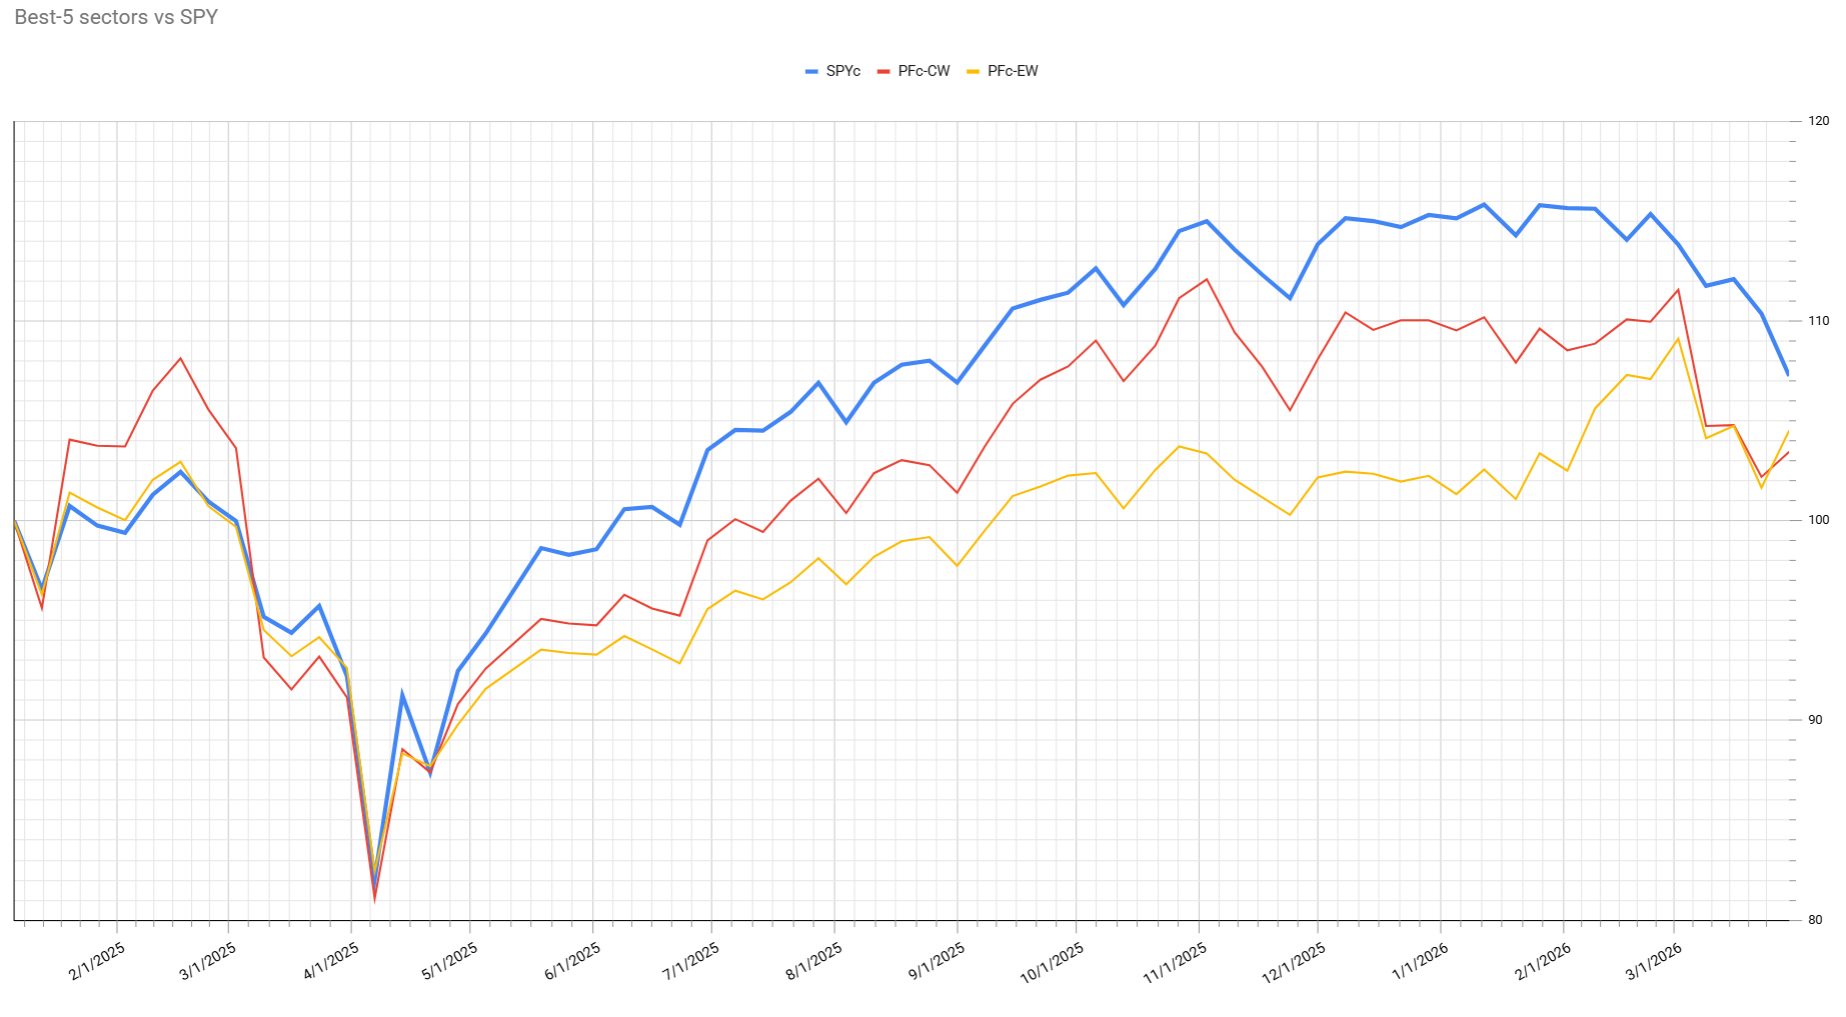
The current defensive positioning of the Top-5 portfolio drove the portfolio’s performance significantly higher last week. Previously, it lagged the S&P 500 by about 7–7.5%. Now, the gap has narrowed to 3.8% for the cap-weighted portfolio and 2.5% for the equal-weight portfolio. This means the portfolio outperformed the S&P 500 by around 5% in just one week, a notable improvement.
If market volatility persists, we could see further gains in relative performance, potentially moving the portfolio into an outperforming position against the S&P 500 for the first time in about a year. While it’s still early, the portfolio is back on track. The coming weeks will be crucial in determining if this trend continues.
#StaySafe, --Julius


