This Sector Is Making Its First Relative Breakout in 8 Years

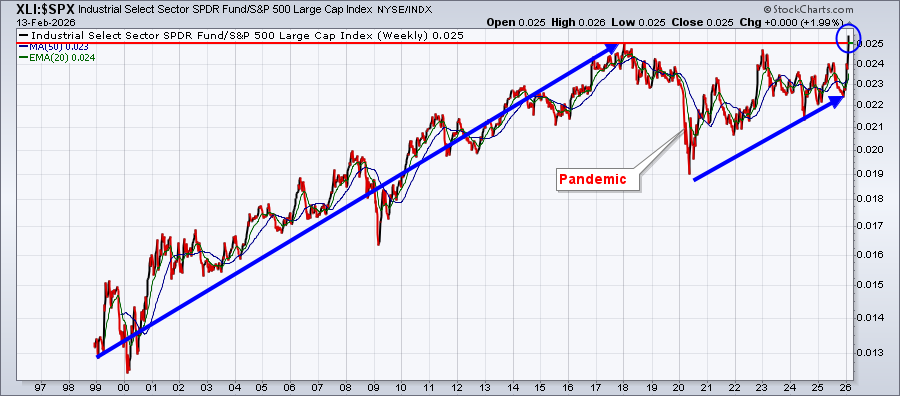
From 1999 through 2018, one sector consistently outperformed the S&P 500 over time, which was none other than the Industrials (XLI). Since 2018, however, Industrials struggled to make another relative breakout vs. the S&P 500 until 2026. Here's a chart that will provide a quick visual of Industrials' relative performance since the turn of the century.
The strength in Industrials is across the board. Nearly every industry group within the sector is screaming higher right now. There are 16 industry groups in the Industrials sector. Below are the 12 strongest, in no particular order, relative to the S&P 500 (2 charts of 6 groups each are shown).
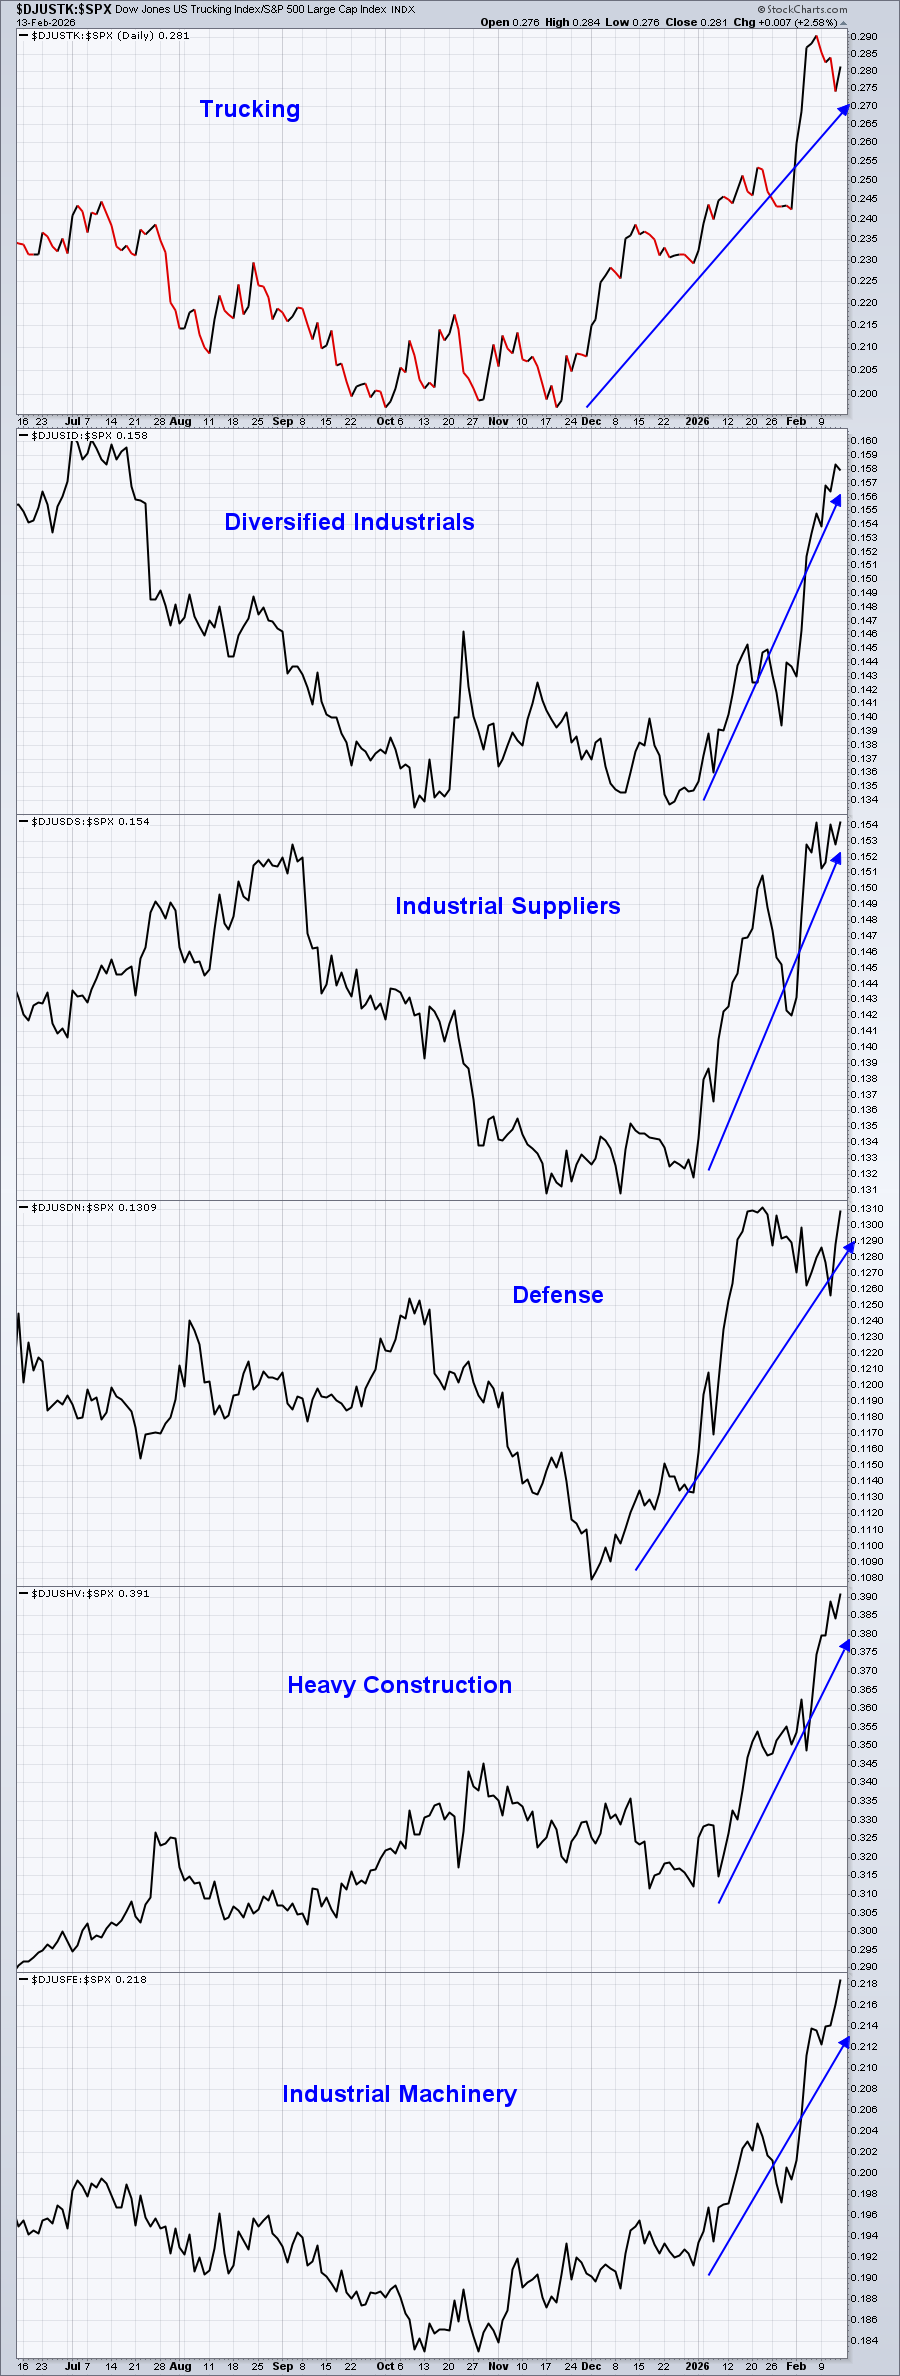
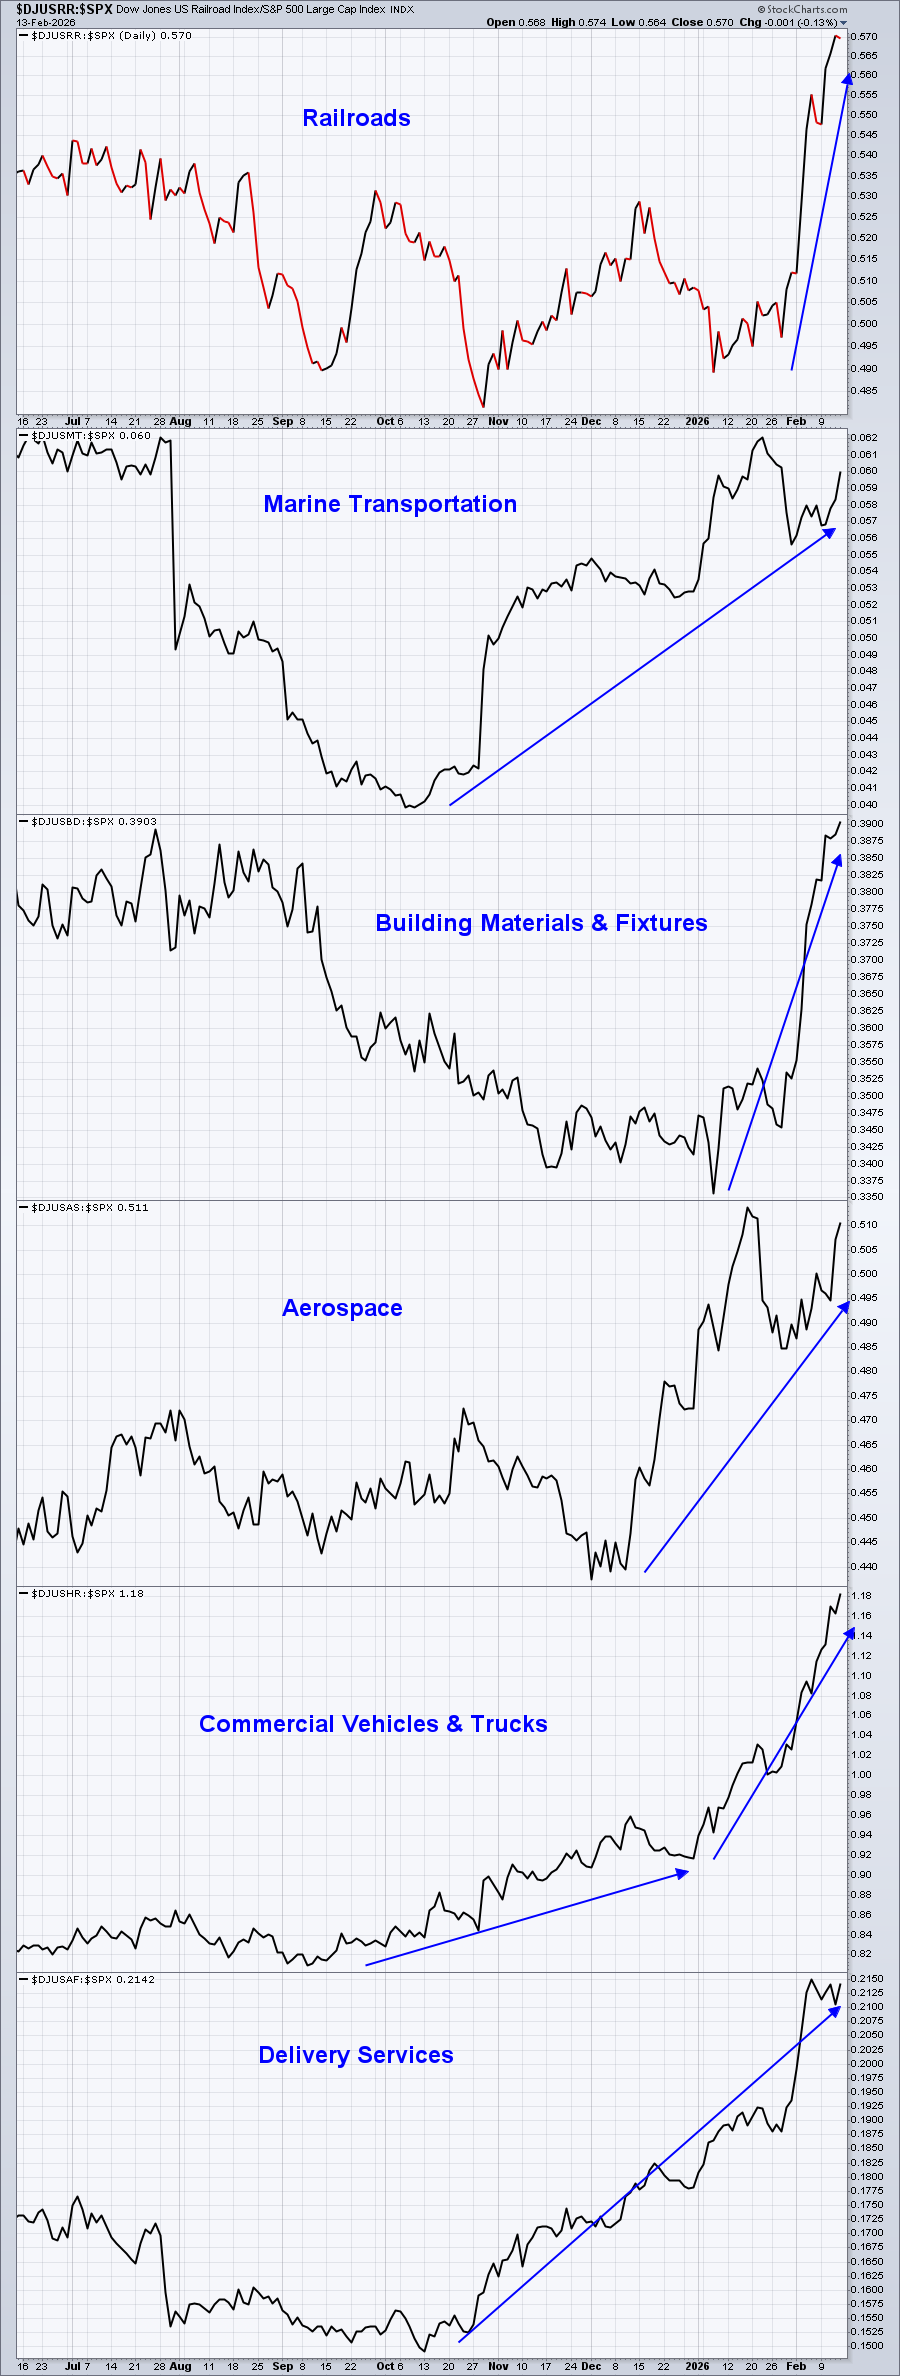
They say a picture is worth a thousand words. Well, these two pictures are worth two thousand words. Industrials are on fire and you don't need to be very picky, because just about every area in the sector is flying. And when we consider that the group is just now making an 8-year relative breakout, there's a good chance that this relative strength won't be ending any time soon.
At EarningsBeats.com, we've been building portfolios to outperform the S&P 500 since 2018. Our Model Portfolio has more than doubled the S&P 500 since 2018 and one of the biggest reasons why is that we stick to what's working, what is showing relative strength. Clearly, Industrials will be closely analyzed.
On Tuesday, I'm providing one of my favorite industrial stocks in our FREE EB Digest newsletter. If you're not already an EB Digest subscriber and would like to check it out, you can CLICK HERE and provide your name and email address to sign up.
Have a great holiday weekend and happy trading!
Tom


