This Week's Scan Reveals Stocks with Massive Potential

The StockCharts platform includes a very powerful scan engine that helps isolate stocks that look technically positive. Since my personal focus is on markets and sectors rather than individual stocks, I must confess that I don't use this invaluable tool as much as I should.
That said, one simple approach is to search for NYSE and NASDAQ stocks whose relative strength against the S&P Composite is at a 52-week high. This is very much a momentum play and often returns candidates experiencing unusually strong overbought conditions. I tend to ignore such situations because the price is typically well above the level at which a realistic stop could be placed. In other words, the risk-reward is unattractive.
Consequently, satisfying the scan’s conditions does not necessarily mean a specific stock should be purchased. Technical analysis, it should be remembered, deals with the weight-of-the-evidence approach. Since scanning criteria only satisfy two or three of those pieces of evidence, executing one is therefore a starting point, warranting further examination.
The Nirvana Template (ChartStyle)
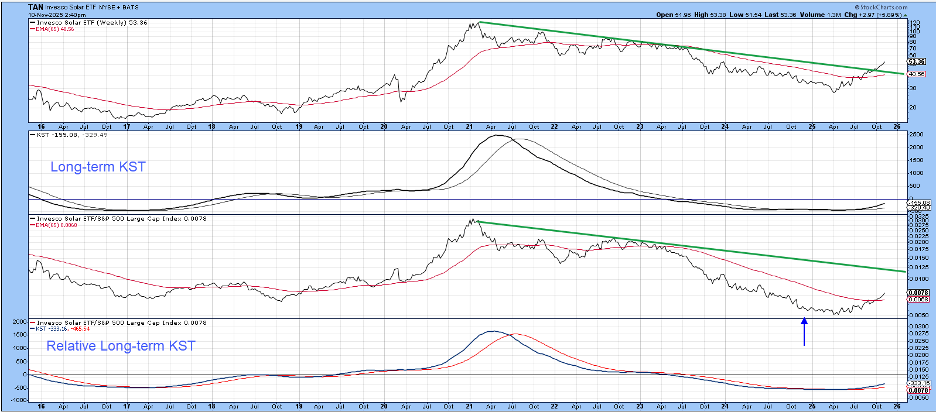
One approach to a deeper dive is to display a chart arrangement reflecting the long-term technical picture of the absolute and relative prices. For that, I use what I term the “Nirvana Template”, as in Chart 1. For a detailed explanation, please see p 681-7 of Technical Analysis Explained. I call it “Nirvana” because it provides the perspective to make an informed decision.
Short-term traders may have a problem with long-term charts, but it’s important to remember that near-term rallies are generally stronger when the primary trend for both the absolute and relative price is bullish. Furthermore, false upside breakouts tend to occur when the primary trend is negative. Having an idea of the direction of the main trend, therefore, gives you an edge.
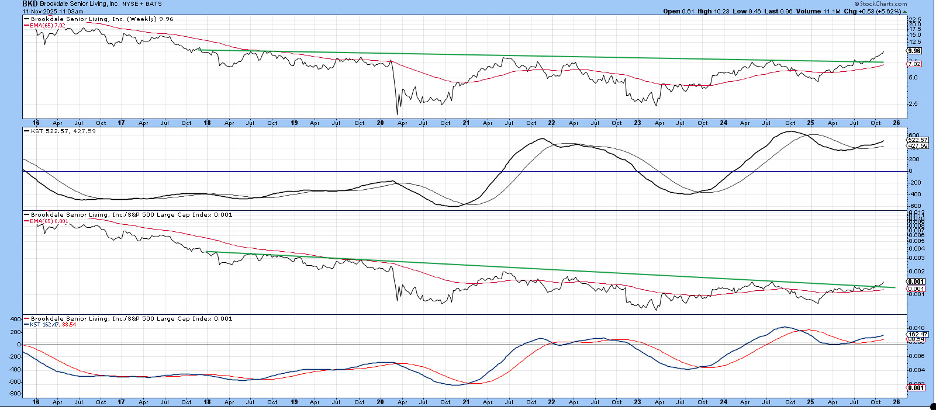
The top panel of this Nirvana ChartStyle contains the weekly price with a 65-week EMA. The third window contains the same information for the RS line. The long-term KST and its 26-week EMA appear in the second panel, and data for its relative counterpart in the bottom clip.
The idea is to carefully consider those charts where all four indicators are trading above their respective EMAs. Since the scan only returns RS lines at a 52-week high, the implication is that the stock has a good chance of outperforming. It’s always nice to see the two KSTs reverse to the upside from a position below zero. That’s what we see in Chart 1 of the Invesco Solar ETF (TAN).
Note also that the absolute price and relative line are both above their EMAs. The RS line has been slowly moving higher, but is well below its late 2021 high. However, TAN meets the scan test because it is comfortably above its level recorded 52 weeks ago by the blue arrow.
Another piece of bullish evidence comes from the violation of the 2021–2025 down trendline. A trendline violation may be missing for the RS line. However, since all four series are above their EMAs, the chart still retains an overall bullish flavor.
The Nirvana Template Checklist
- Weekly price chart with 65-week EMA
- Long-Term KST and its 26-week EMA
- Relative Strength with 65-week EMA
- Relative Long-Term KST
Alphabet Looking Overstretched
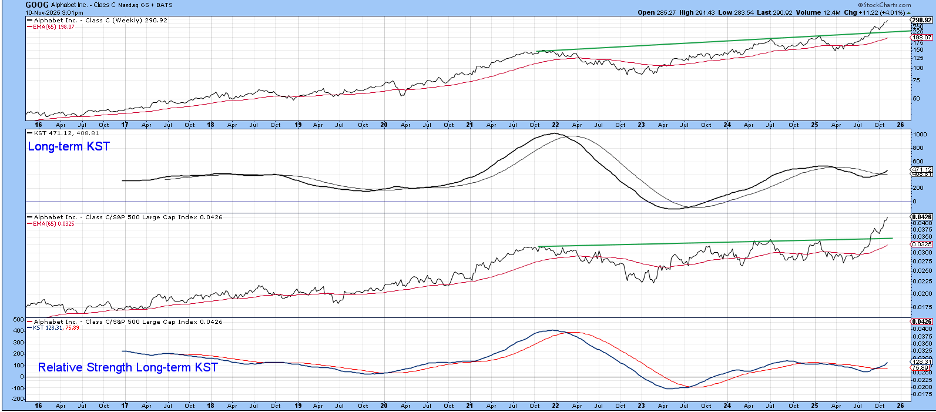
Chart 2 features Alphabet (GOOG). Once again, all four series are north of their EMAs, but it’s an even stronger chart because the RS line also experiences a positive four-year trendline violation. Unfortunately, things are a bit overstretched on the upside, so a near-term correction may be required before significantly higher prices are seen.
Fulgent's Fine Balance
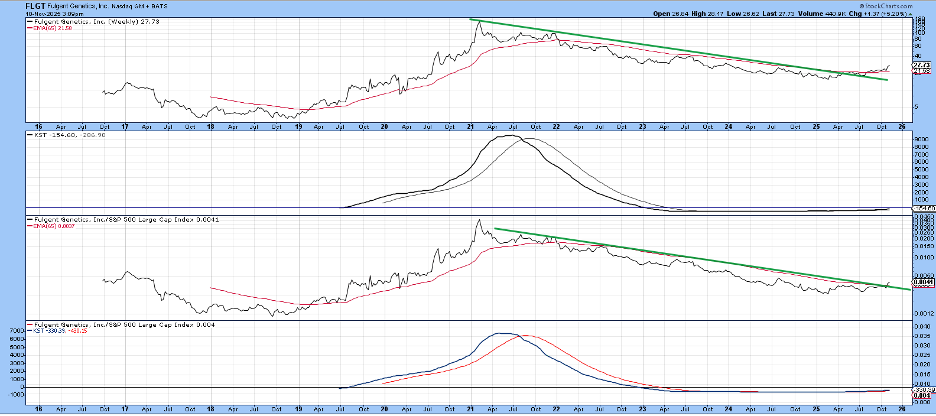
That’s not true for Fulgent Genetics (FLGT) in Chart 3, where we see a recent double trendline breakout. Those breakouts follow two KSTs, which have been completely flat since mid-2023. If they are genuine, and there are few grounds for suspecting otherwise, this should tip an extremely finely balanced technical structure into one very much in favor of the buyers.
Cummins: A Higher Risk Play
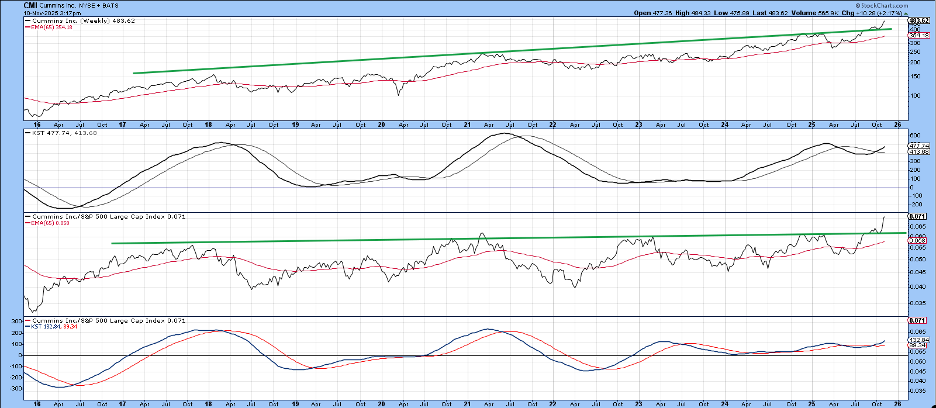
Cummins (CMI), in Chart 4, does not offer a low-risk sub-zero entry point. Instead, the two KSTs have crossed above their EMAs during the course of an ongoing linear uptrend. That kind of opportunity tends to be higher risk than the sub-zero variety. However, putting aside the obvious overstretched near-term condition, the breakout from the 2017–2025 trading range is very compelling. In full disclosure, Pring Turner clients have been exposed to CMI for several years.
Brookdale Breaks Out
Finally, Chart 5 features Brookdale Senior Living (BKD). In this instance, both the price and RS lines have broken out from a seven-year base with accompanying positive long-term smoothed momentum.
The Bottom Line
The scanning engine is a powerful tool used for discovering stocks that meet some of your technical criteria. However, since investors and traders have widely differing objectives, executing a scan is just the first step in a weight-of-the-evidence approach. That’s why the stocks featured in this article are not recommendations, but interesting chart ideas suitable for further investigation.
Good luck and good charting,
Martin J. Pring
The views expressed in this article are those of the author and do not necessarily reflect the position or opinion of Pring Turner Capital Group of Walnut Creek or its affiliates.


