Trend Signals in Agriculture ETF; Wheat and Soybeans Turn Up; A Tribute to John Murphy
Key Takeaways
- The DB Agriculture ETF is showing bullish trend signals and patterns.
- Soybeans, livestock, and wheat are in uptrends.
- A tribute to John Murphy, a pioneer and titan in technical analysis.
The markets turned volatile this week as stocks, bonds, and gold fell, while oil and the U.S. dollar surged. Bonds didn't offer their usual safe-haven, but money moved into agriculture. It is not clear if this was a safe-haven move, but agriculture offers true diversification within a portfolio. Today's report will look at this week's signals within agriculture and then pay tribute to John Murphy.
DB Agriculture ETF Breaks Out
The Invesco DB Agriculture ETF (DBA) came across my radar this week with fresh trend signals as two of my three trend-following indicators turned bullish.
My three trend-following indicators are Bollinger Bands (150,1), CCI-Close (150) and StochClose (150,5). Each covers 150 days, which is a little more than six months. Bollinger Bands signal an uptrend with a break above the upper band, and a downtrend with a break below the lower band. CCI-Close, which is the Commodity Channel Index based on closing prices, signals bullish with a break above +100, and bearish with a break below -100. StochClose, which is the Stochastic Oscillator based on closing prices, triggers bullish with a move above 70 and bearish with a move below 30. The chart below shows DBA with these three indicators.
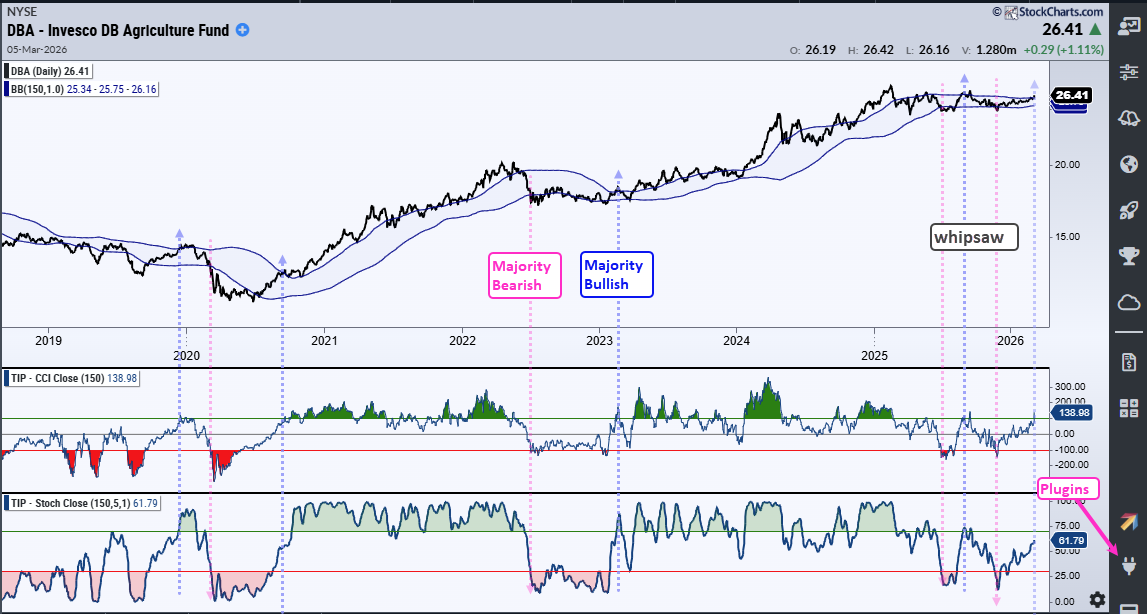
The blue and pink dashed lines show when the majority triggered trend signals. Most recently, price broke the upper Bollinger Band and CCI-Close exceeded +100 for a trend signal this week.
Using three indicators means individual trend signals must be confirmed, not by all three, but by at least two of the three. An uptrend signals when at least two of three are bullish and a downtrend when two of the three are bearish. This confirmation requirement leads to fewer whipsaws and longer trend signals. Note, however, that it's impossible to eliminate whipsaws completely.
Note that CCI-Close and StochClose are part of the TIP Indicator-Edge Plugin for StockCharts ACP. These versions use only closing prices in their calculations. Normally, the Commodity Channel Index and the Stochastic Oscillator use intraday highs and lows in their calculations. Errant price spikes can skew these indicators.
DBA Forms Large Symmetrical Triangle
The next chart shows DBA advancing 30% from August 2024 to February 2025 and then forming a large symmetrical triangle. Prices traded flat as this triangle unfolded and this caused the trend-following indicators to whipsaw. Overall, I view this triangle as a consolidation after a sharp advance. It is a bullish continuation pattern and a breakout at 27 would signal a resumption of the prior advance. Within the triangle, there was a downswing from mid September to late November and a short-term breakout in December.
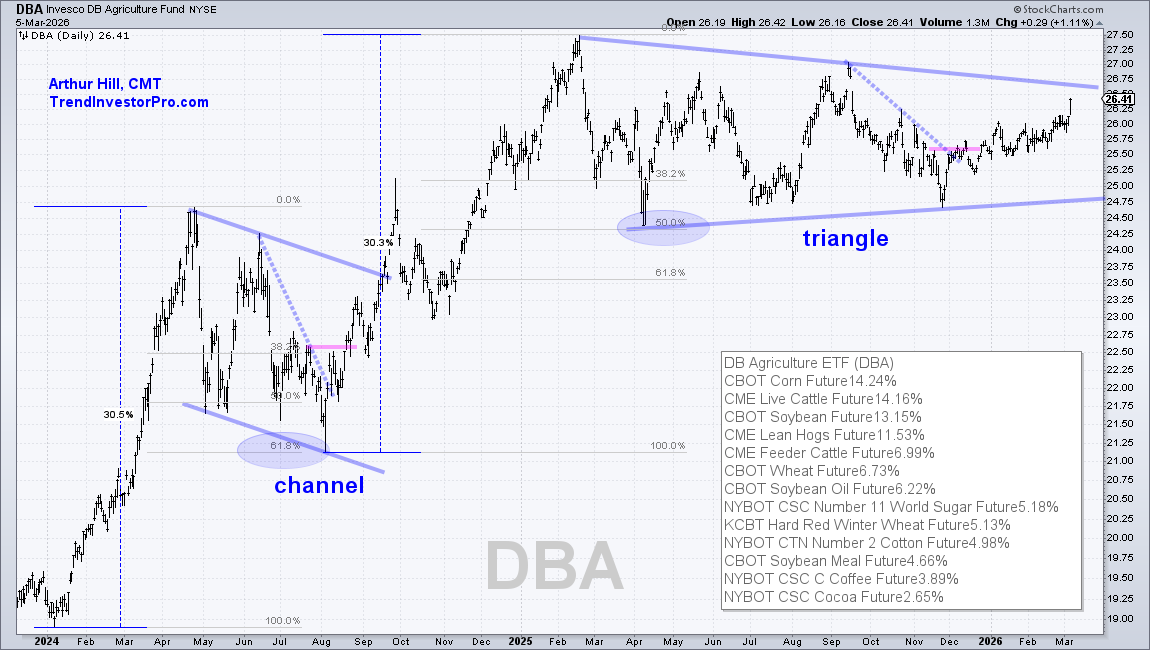
Looking back, we can also see a sharp advance from January to April 2024 and then a falling channel that retraced 61.8% of the prior advance. DBA broke channel resistance with a surge into September. Prior to the breakout, the downswing reversed with a short-term breakout in August.
Recent Reports and Videos on TrendInvestorPro
- Trend Trio150 Signals for Dow 30 Stocks and SPDRs
- Bonds Tests Breakout Zone as Gold Triangulates
- Stock Setups in Healthcare and Defense
- Market Remains Defensive with Bearish Patterns in XLK/QQQ
- Click here to take a trial and gain immediate access.
Soybeans, Livestock, and Wheat in Uptrends
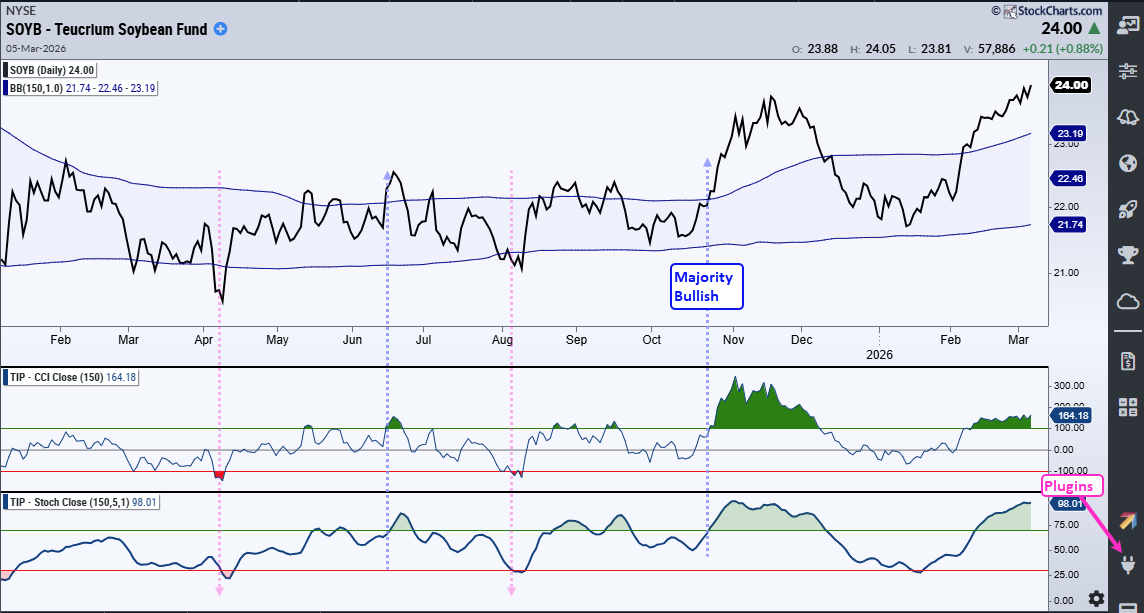
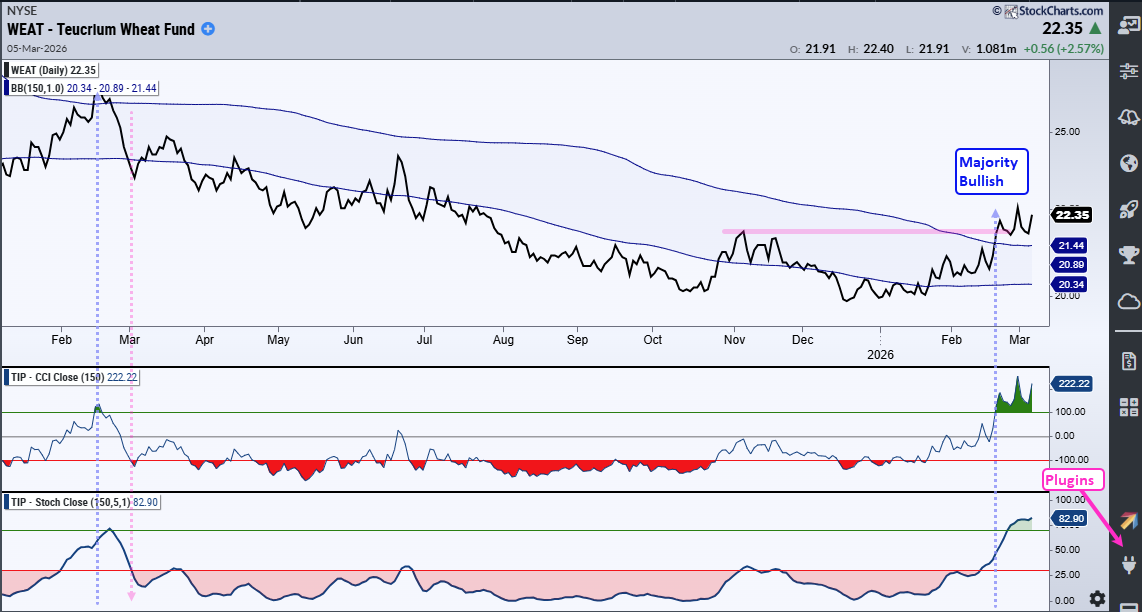
The prior chart shows the holdings for the DB Agriculture ETF. Three groups stand out when combining similar holdings: Soybeans (24.03%), Cattle (21.15%), and Wheat (11.86%). These three groups account for just over 50% of DBA. More importantly, all three are in long-term uptrends.
The next chart shows the Teucrium Soybean ETF (SOYB) with the three trend-following indicators. There were whipsaws from April to August 2025 (bad signals). Most recently, the indicators turned net bullish in late October and remain bullish as SOYB hit new highs this week.
TrendInvestorPro tracks these trend signals for 250+ ETFs and SPX/NDX Stocks. Click here for a free table showing signals for Dow 30 stocks and the Sector SPDRs.
The next chart shows the Teucrium Wheat ETF (WEAT) trending lower from March 2025 to January 2026. The trend-following indicators turned net bullish on February 19th. WEAT also broke its February high in the process.
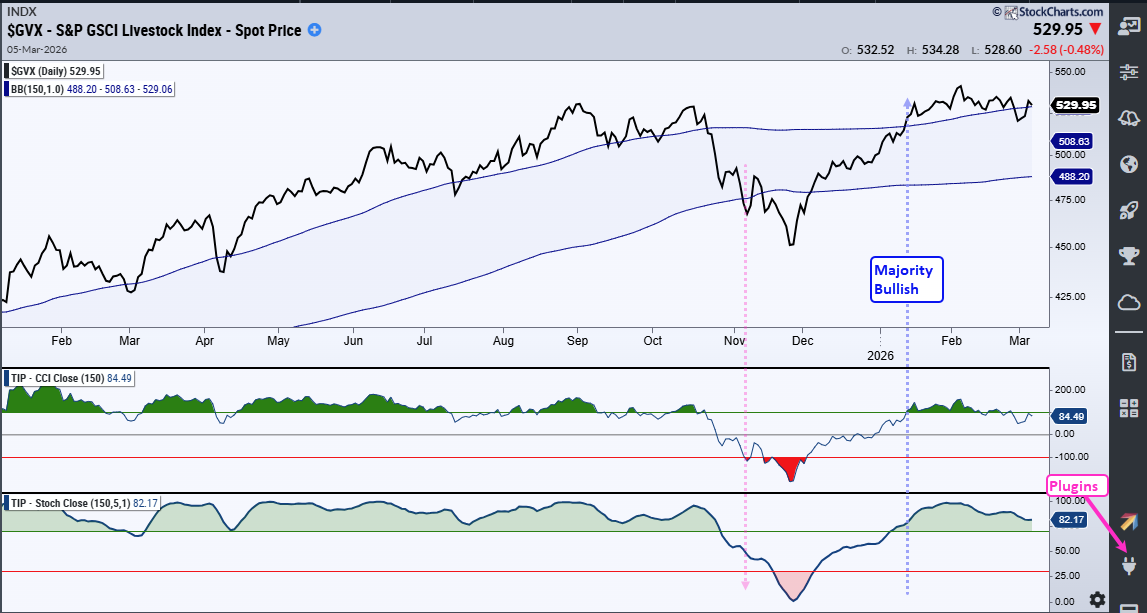
I could not find a livestock ETF, but found the S&P GSCI Livestock Index ($GSX) as a proxy for cattle. The trend-following indicators turned net bullish on January 13th and the index hit a new high a few days later. This index is in a clear uptrend.
John Murphy — A Pioneer and Titan
John J. Murphy, a pioneer and titan in technical analysis, passed away last month. His books, Technical Analysis of the Future Markets and Intermarket Analysis, are classics. I have read these many times and referred to them often over the years. They are as relevant today as they were then.
John was a natural in explaining complex topics in easy-to-understand terms. His teachings, research and reports had an enormous influence on my understanding of technical analysis and my career. John provided a solid base, from which my abilities grew.
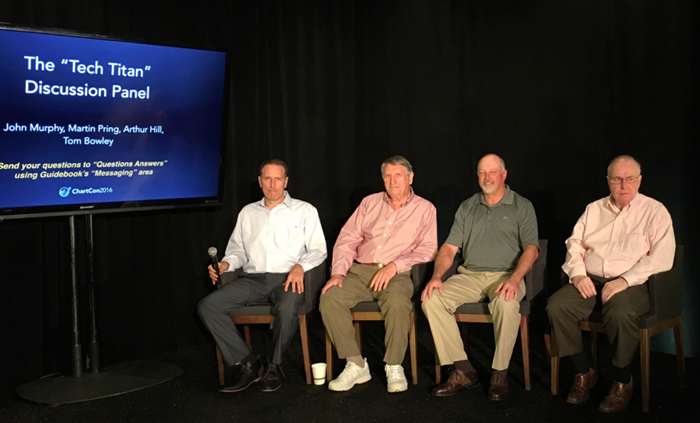
I had the great privilege of working with John at StockCharts. Together, we produced the Market Message for many years. In person, John had a great sense of humor and was very approachable. The photo above is from ChartCon 2016 (with Martin Pring and Tom Bowley).
I would encourage you all to revisit his writings, and especially John's 10 Laws of Technical Trading. In particular, laws 1, 2 and "11" influenced me the most.
- Map the Trends (trade in the direction of the bigger trend)
- Know how far to Backtrack (look for pullbacks within uptrend)
- Keep at It (skill improves with experience and study)
Rest in Peace … John.