Utilities, Staples, and Health Care: Are Defensive Sectors Signaling Market Trouble?

Key Takeaways
- Utilities are outperforming the S&P 500, highlighting rising investor demand for defensive positioning.
- Staples and Health Care show mixed signals as traders assess risk-off sector rotation trends.
- Monitoring absolute and relative sector strength may help investors gauge broader market risk.
It’s March Madness on Wall Street. The VIX hovers in the mid-20s, WTI crude oil has scaled $100 once again, and the bears have scored one jump shot after another. They say defense wins championships, and right now traders may be wondering if preparing for further downside is the smart move.
On that note, eyeing sector trends should be in your playbook. Among the 11 S&P 500 sectors, Utilities, Consumer Staples, Health Care, and Real Estate are generally seen as the less cyclical, lower-growth niches. Those four areas comprise 18.5% of the SPX (less than 10% ex-Health Care). So, from a portfolio management perspective, making major moves into defense can turn into quite the active wager. When the bears turn over the ball, a fast-break rally can hurt.
Still, there’s potential to be gained away from the sexy sectors. Let’s dive in.
Utilities Powering Up
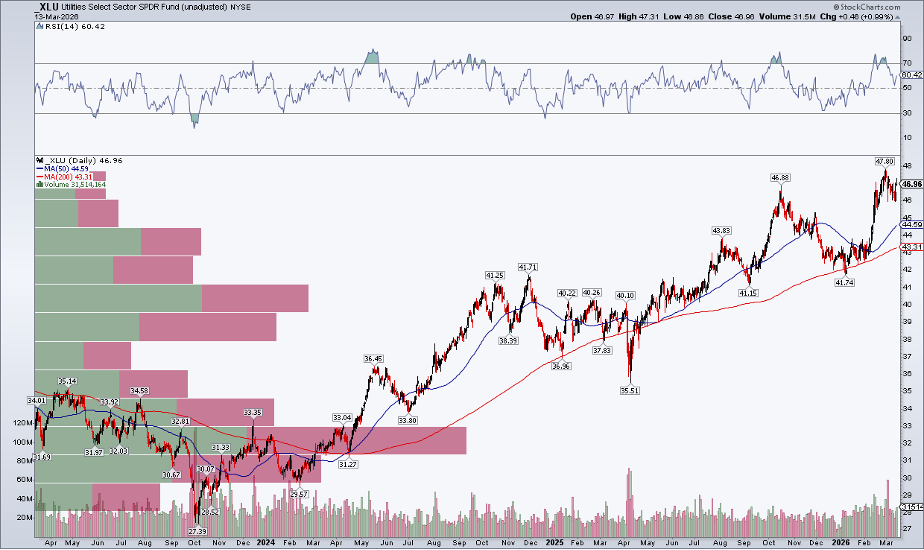
Starting with Utilities (XLU), it’s important to analyze price action from both an absolute and a relative standpoint. The Utilities sector ETF continues to trade within a formidable uptrend.
Notice in the chart below that a series of higher highs and higher lows has been ongoing since September 2023. The long-term 200-day moving average is on the rise, suggesting that the bulls control the primary trend. The RSI momentum oscillator at the top of the chart has routinely tagged technical overbought conditions, which is actually a good thing. In short, XLU is powered up.
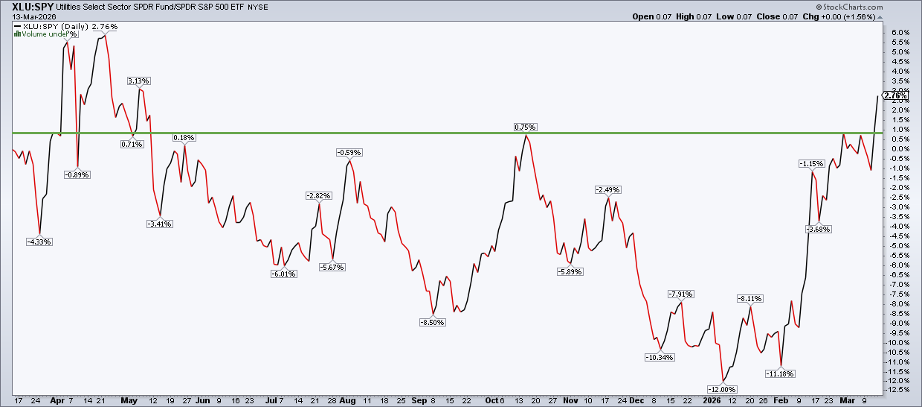
But how does it look compared to the S&P 500 ETF (SPY)?
For this, simply enter “XLU:SPY” in the symbol box on SharpCharts (you can also enter “_XLU:_SPY” for a price-only view). Last Friday’s close was the best going back to May 2025, breaking above apparent resistance.
In short, the possession arrow favors Utilities (and, hence, SPX bears).
Staples Testing Key Support
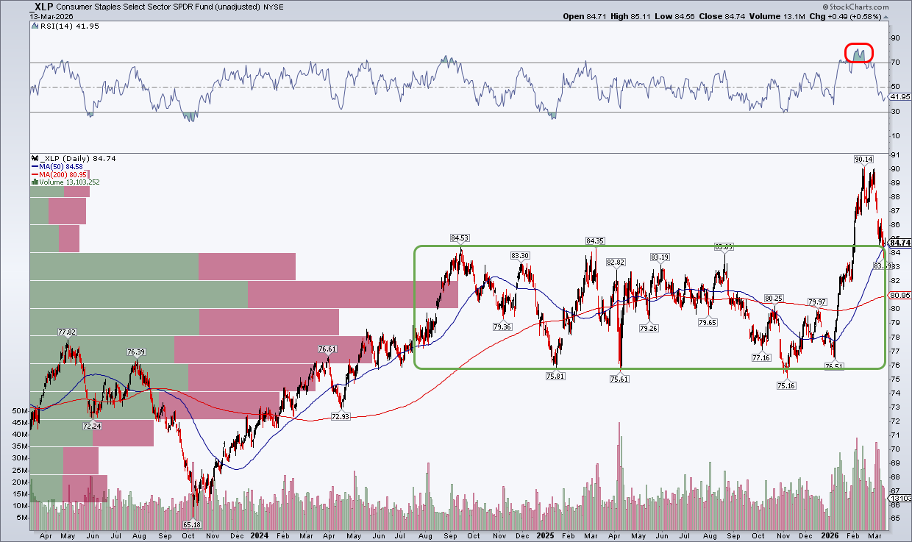
Turning to Consumer Staples (XLP), price action is less clear. On its own, the ETF is not far from correction territory, retreating toward notable support near $84 and the 50-day moving average. The presumption is that with a high amount of volume-by-price entering the scene in the mid-$80s, XLP should catch a bid here. The next few weeks will be critical.
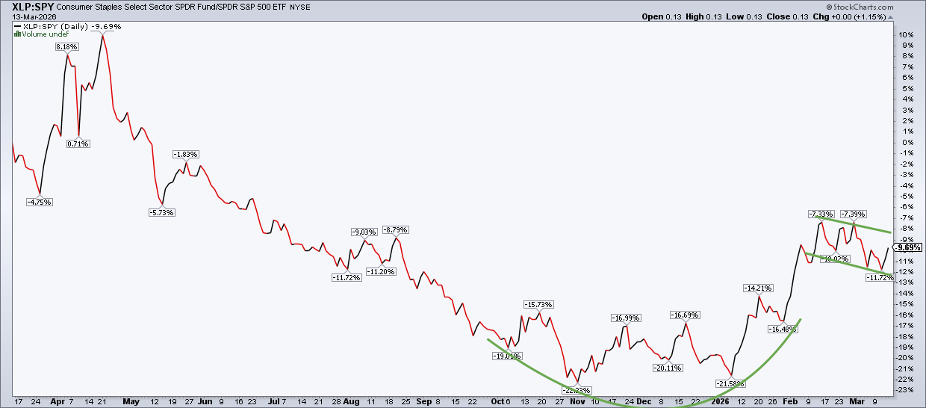
Likewise, XLP:SPY is not as clean as XLU:SPY. There was a rounded bottom put in around the turn of the year, and now a consolidation phase (perhaps a bull flag) is the primary pattern.
Technicians like to say that consolidations resolve in the trend of the larger degree (up, in this case), so it would make sense for XLP to hold $84 support while rallying once more versus the S&P 500 in the weeks and months to come.
Health Care Stuck in the Waiting Room
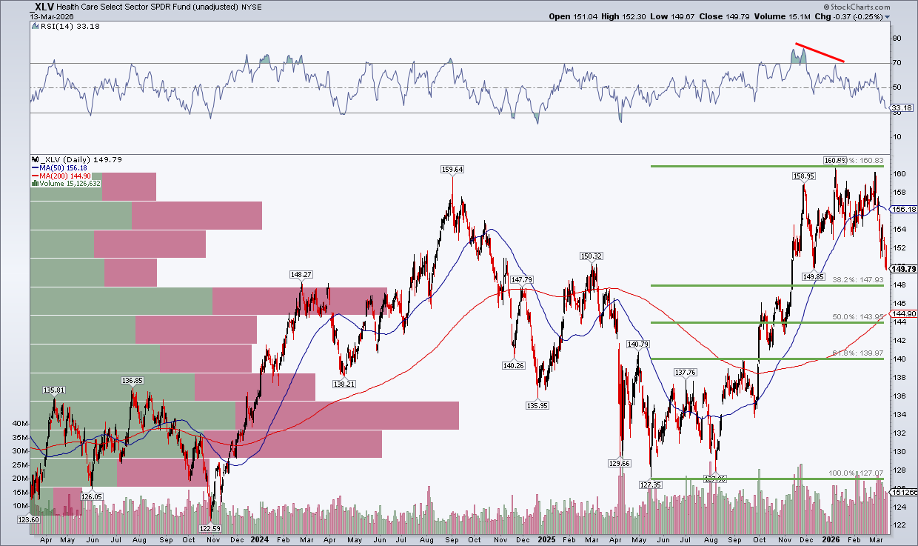
Heading over to Health Care (XLV), a bearish double top jumps out on the absolute chart. Sellers emerged twice at $160: first in Q3 2024, and second over several months just recently.
Health Care, which houses defensive drugmakers, somewhat cyclical medical device companies, and outright risky biotech stocks, scored its worst RSI since immediately after Liberation Day, with the rising 200dma just a few percentage points below today’s price. What’s more, after busting below an uptrend support line, the 38.2% Fibonacci retracement is near $148.
On net, XLV should be benched for now.
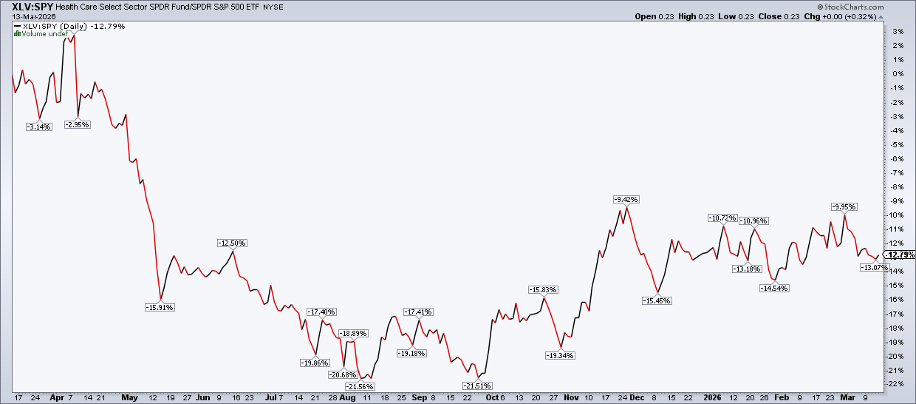
XLV:SPY is uninspiring. The sector bottomed last August, then perked up in November, but has been sideways since December.
Of course, just as Walmart (WMT) and Costco (COST) are the Staples stars, Health Care largely hinges on Eli Lilly (LLY), Johnson & Johnson (JNJ), and UnitedHealth Group (UNH).
For recent thoughts on Real Estate, check out my article from earlier this quarter.
Don’t Overthink the Defensive Play
Big picture, it’s easy to get caught up in parsing relative strength details among defensive, cyclical, and growth sectors. But here’s the thing: It’s okay for risk-off spots such as Utilities, Staples, and Health Care to rally. There have been plenty of decent defensive uptrends throughout this bull market. In fact, names like WMT, COST, and LLY trade more like growth stocks than traditional blue-chip value equities.
The upshot? Sector analysis (including relative strength) should be just one of many top-down and intermarket tools in your arsenal.
When Defensive Strength Becomes a Warning
When does defensive alpha go from Bear Market Watch to Bear Market Warning? If we see XLU, XLP, XLV, and possibly XLRE exhibit relative strength while trending lower on an absolute basis, the S&P 500 is almost by definition behind the eight ball.
There have been inklings of that amid the SPX’s bearish rounded top pattern, but I’d describe it as fits and starts at best. It’s not ideal for non-cyclicals or non-growth spots to lead, though it can happen for extended periods.
Bottom Line
Most eyes are on Energy and Information Technology right now, with $100 WTI crude oil and NVIDIA (NVDA) in the spotlight out west. Financials have also been in the bears’ crosshairs, given all the private credit cockroaches creeping through banking walls. But I assert that traders should also monitor absolute and relative price action in the defense areas as the S&P 500 struggles. Sector analysis helps you box out the noise when volatility is on a fast break.
Disclaimer: This blog is for educational purposes only and should not be construed as financial advice. The ideas and strategies should never be used without first assessing your own personal and financial situation, or without consulting a financial professional.