VIX Near 20: Is the Stock Market Entering the Danger Zone?
Key Takeaways
- The S&P 500 sometimes struggles when the Volatility Index climbs into the low-mid-20s.
- Several event catalysts are now within the 30-day VIX window.
- Equity breadth and global strength are supportive, but the SPX remains below key resistance at the 7,000 mark.
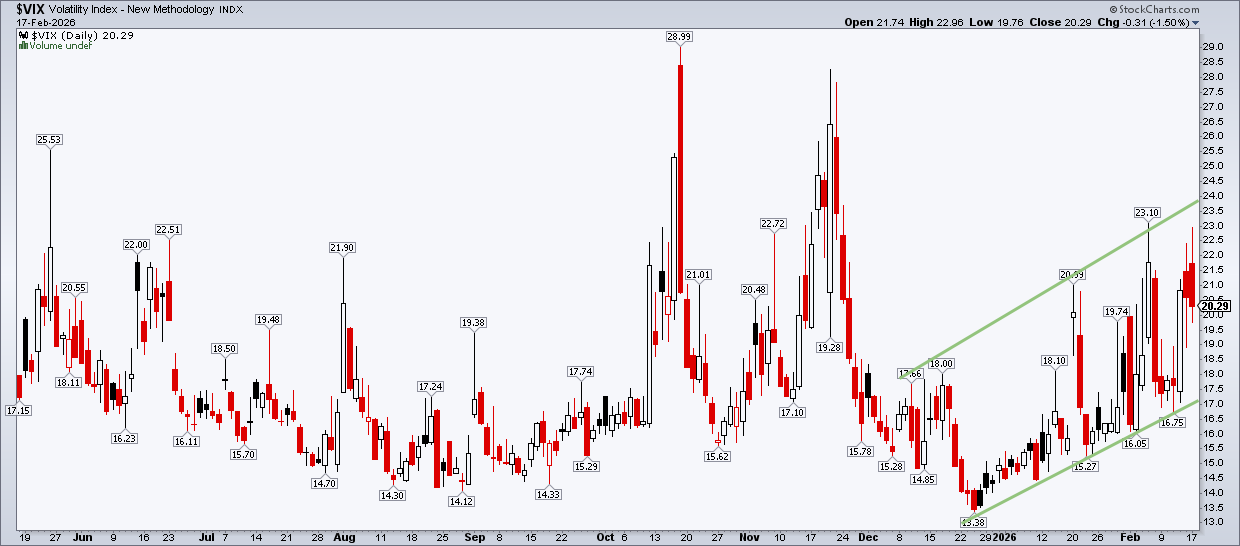
Does the stock market have a volatility problem? On Tuesday, the Cboe Volatility Index (VIX) snuck a peek above 23, nearly scaling its February 5 high. Zoom out the chart to late December, and it’s clear that a series of higher highs and higher lows has been the general theme.
To level-set, “complacency” is sometimes warned against when the VIX ventures too low—under 15. But it’s really when Wall Street’s fear gauge hangs out in the low-to-mid 20s that the bears prime for an attack.
Historical data reveal that this uncomfortably elevated, but not extremely high, VIX range makes the S&P 500 more susceptible to corrections. Are we there yet? Not quite, as the uptrend support line implies that a few more dips into the mid-to-high teens could be in the offing.
**VIX Technical Analysis ALERT**
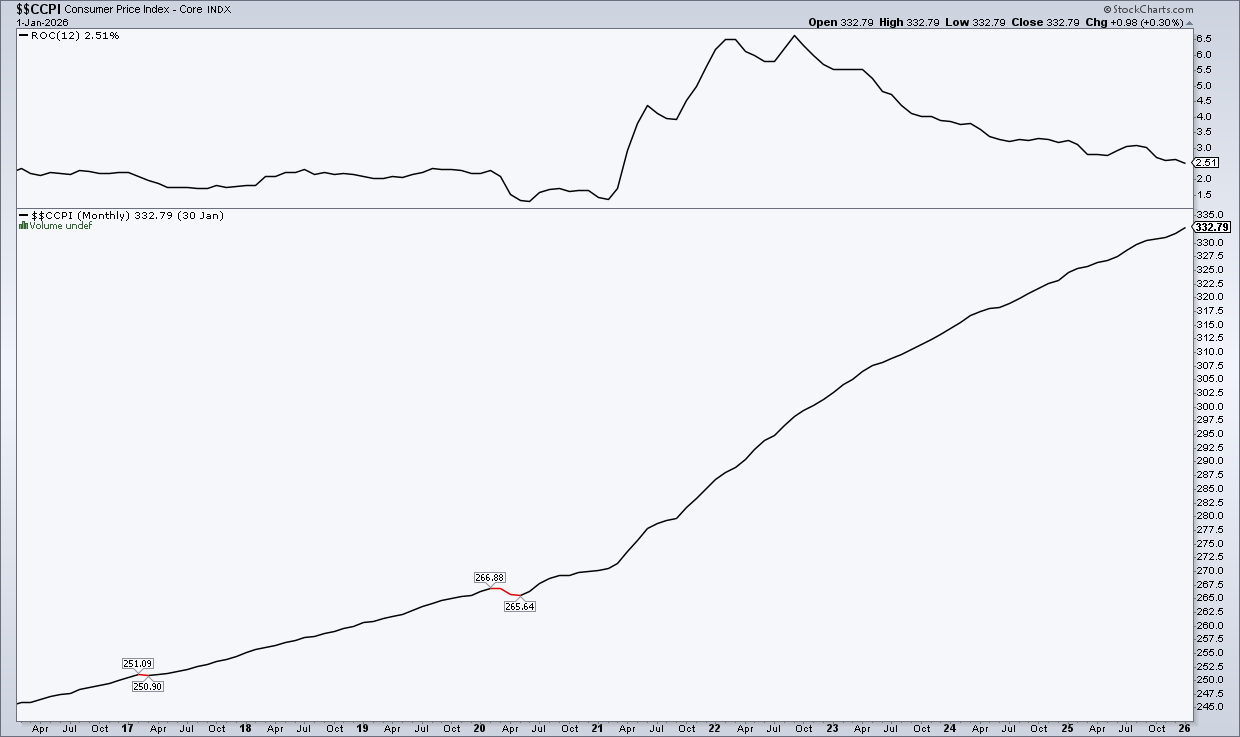
What makes the current implied volatility ascent curious is that it comes without a ton of major data points over the immediate horizon. Last week, generally sanguine December jobs and January CPI were met with mixed reactions between stocks and bonds, while December’s soft Retail Sales underscored a potentially weakening consumer backdrop.
The balance of this week features economic data of mid-tier importance, which would typically not pressure the VIX upward all that much.
In an alternate universe—one without government shutdowns—the U.S. Census Bureau would have published the January Retail Sales report this week. Additionally, the PCE Price Index for January normally hits on the final Friday of February... that may not arrive until mid-March (still within the VIX’s 30-day window).
It’s possible that we hear from the Supreme Court on Friday regarding President Trump’s IEEPA tariffs, which may serve as a volatility catalyst. Expectations are that the high court will strike down the current version of import duties, but the administration will have other avenues to continue collecting tariff revenue.
Volatility Driver? NVIDIA Earnings.
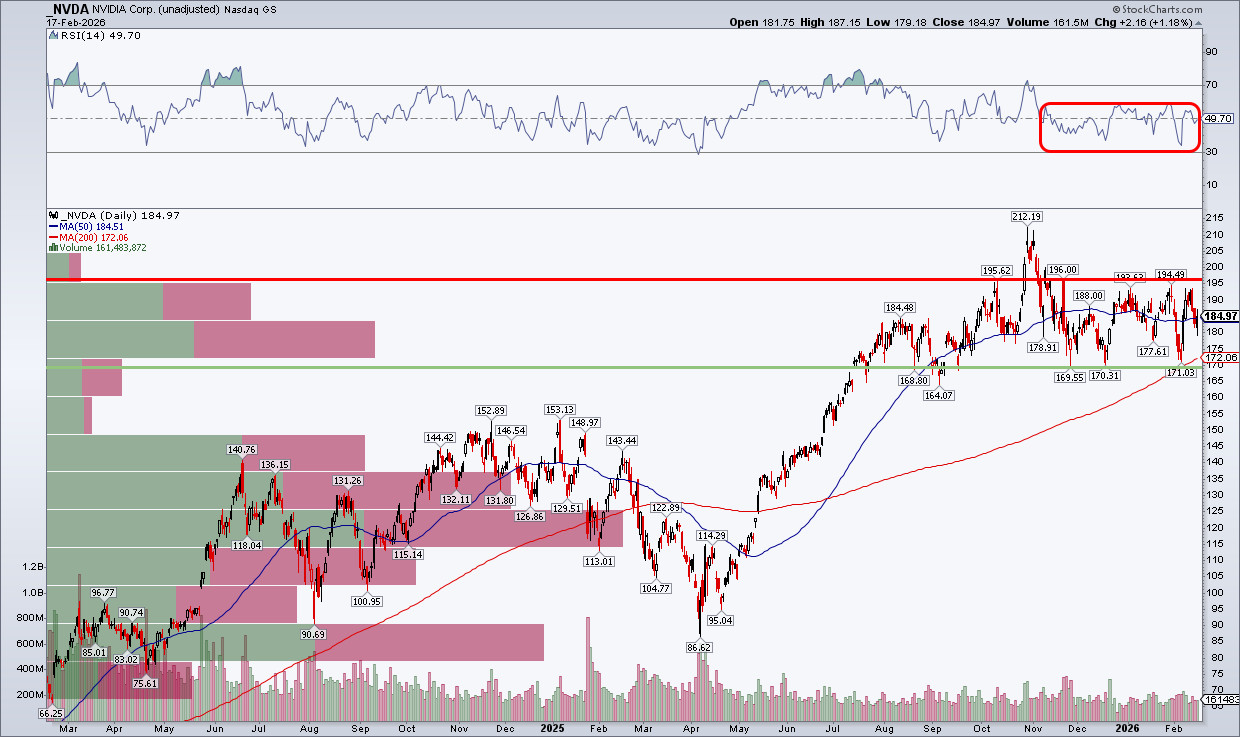
More familiar uncertainty comes next Wednesday night when NVIDIA (NVDA) reports Q4 earnings. The options market currently prices in a somewhat low 6.3% earnings-related stock price swing based on the at-the-money straddle expiring soonest after the February 25th event. Its three-year historical implied move is 7.6%, while the actual change has averaged 7.4%. Recall that the previous trio of reactions has been well within the straddle.
What’s more, with NVDA seemingly range-bound between $170 and $195, implied volatility is in check. The world’s most valuable company hosts its annual GTC AI conference beginning March 16.
Eyes on the Fed
And then there’s the Fed meeting. Just now creeping into the 30-day VIX horizon, the March 18 FOMC decision likely won’t be a live one. With a 92% implied chance of no change to the policy rate, investors will get a fresh look at the FOMC’s Summary of Economic Projections (SEP), or the dot plot.
Assuming Powell retires in May, this will be the final time he presides over an SEP meeting.
Do You Know the 9-day VIX?
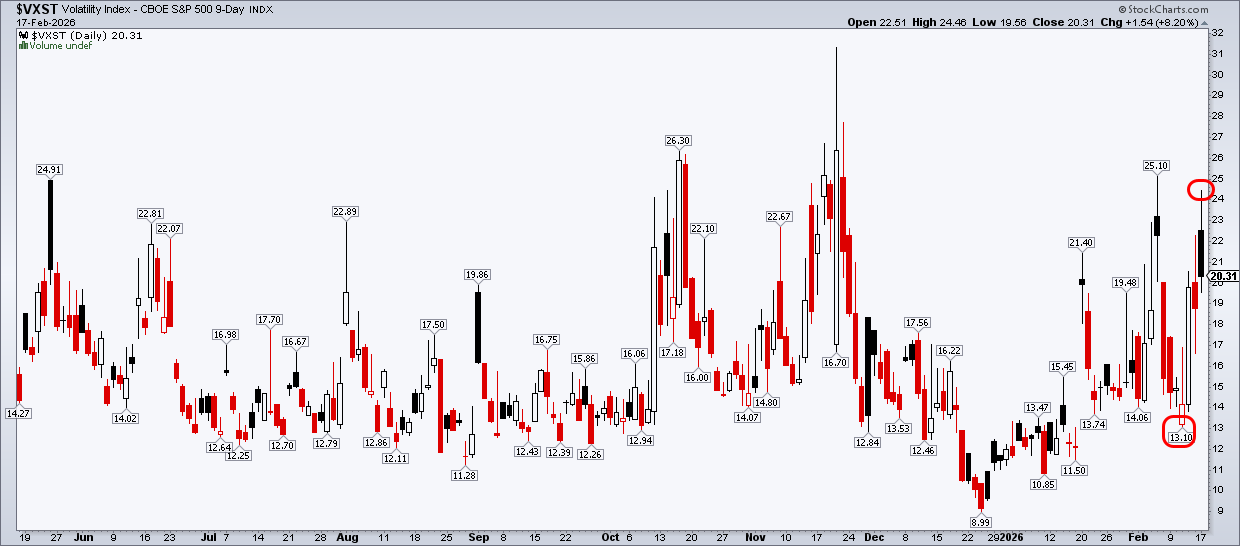
For a nearer-term view of volatility, I often pull up the Cboe S&P 500 9-Day Volatility Index ($VXST). As the name suggests, it uses S&P 500 option prices to gauge price action over the next nine calendar days. It tagged 25 during the throes of the SaaSpocalypse (I prefer “Claude Crash”), dumped to 13 as the Dow crossed 50,000, but is now back in the 20 neighborhood.
VXST will likely be pressured higher until NVDA reports next Wednesday night. Again, though, the broader trend is up. If we were to split hairs, there’s a chance that rise is cooling—a lower low was notched last week, and a lower high was made this past Tuesday.
Spooky Seasonality
No VIX study is appropriate without opening a history chartbook. We don’t have to go back far to find that fear sometimes begins right about now. Mid-February 2020, 2023, and 2025 marked the start of corrective price action for U.S. large caps—declines that were short-lived but impactful.
The 34% plunge in 2020 bottomed in late March, 2023’s regional banking crisis took the S&P 500 from 4,195 to 3,809, and last year’s tariff tantrum was a classic “19%” near-bear market. Who knows what the next handful of weeks have in store but, with the VIX close to that 20+ danger zone and clear S&P 500 resistance in play, guards should be up. Hindenburg Omens don’t help the bulls’ psyche either!
New Highs at Home and Abroad
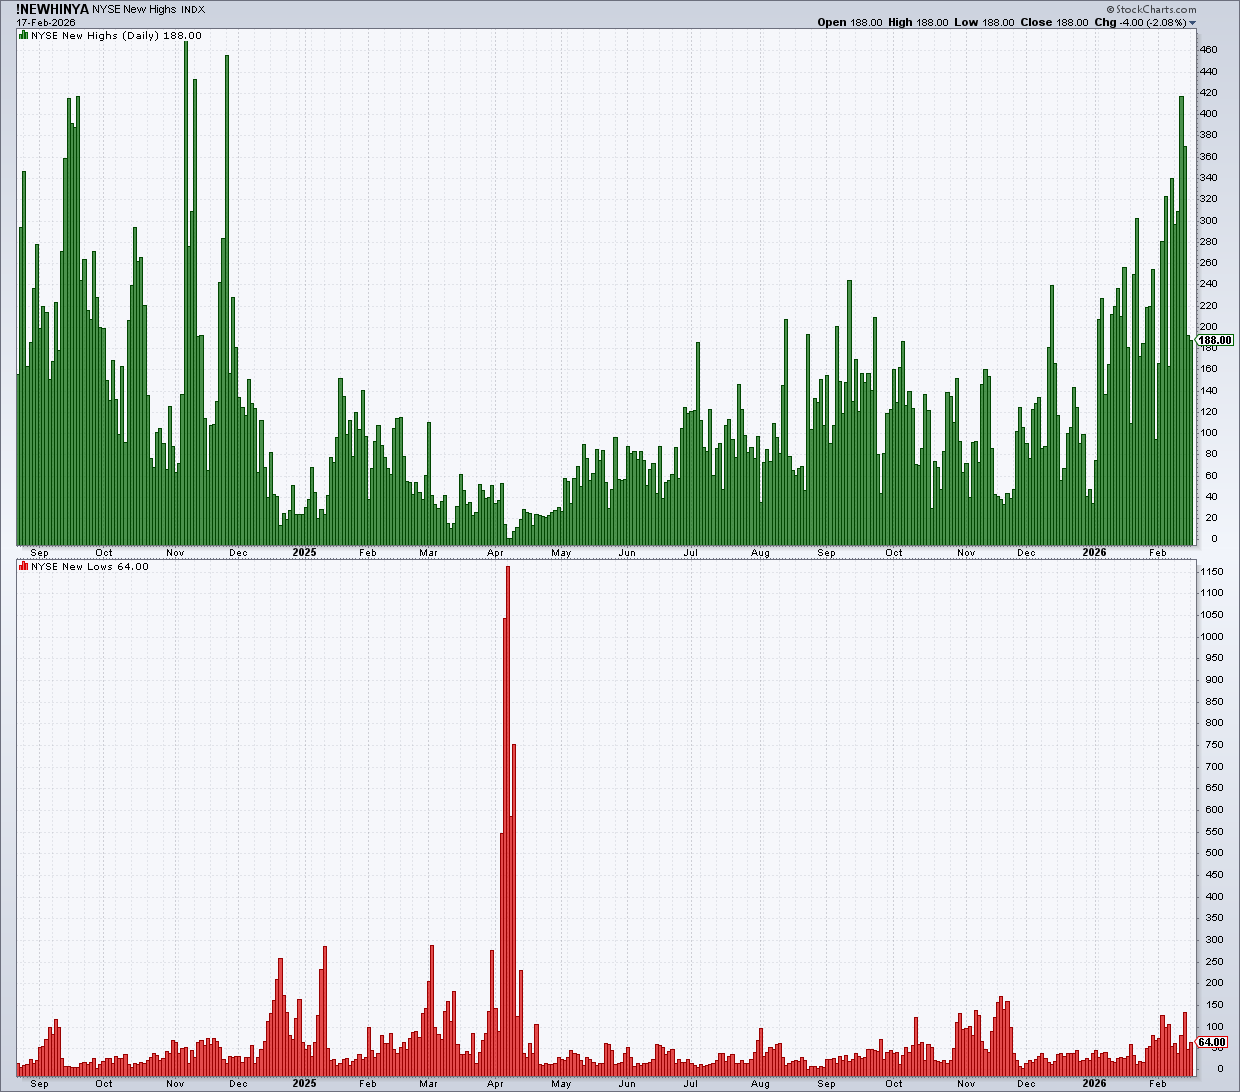
The good news is that breadth remains generally solid (NYSE new highs climbed to the most since November 2024 last week), global equities are strong (the Europe STOXX 600 hit a record on Wednesday, EM is hot), and even the Dow Jones Transportation Average may be making its way back to its all-time high after last Friday’s drubbing.
The Bottom Line
The VIX does not signal complacency or extreme fear heading into the back half of the first quarter. The low-to-mid-20s danger zone must be watched closely, with a few macro catalysts on tap, along with NVIDIA earnings next week. Bulls want to see lower highs and lower lows on the fear gauge, while other intermarket clues can help all traders manage risk.
Disclaimer: This blog is for educational purposes only and should not be construed as financial advice. The ideas and strategies should never be used without first assessing your own personal and financial situation, or without consulting a financial professional.