Week Ahead: NIFTY Near To Its Inflection Point; Minor Rebounds Likely, Though Overall Structure Stays Bearish
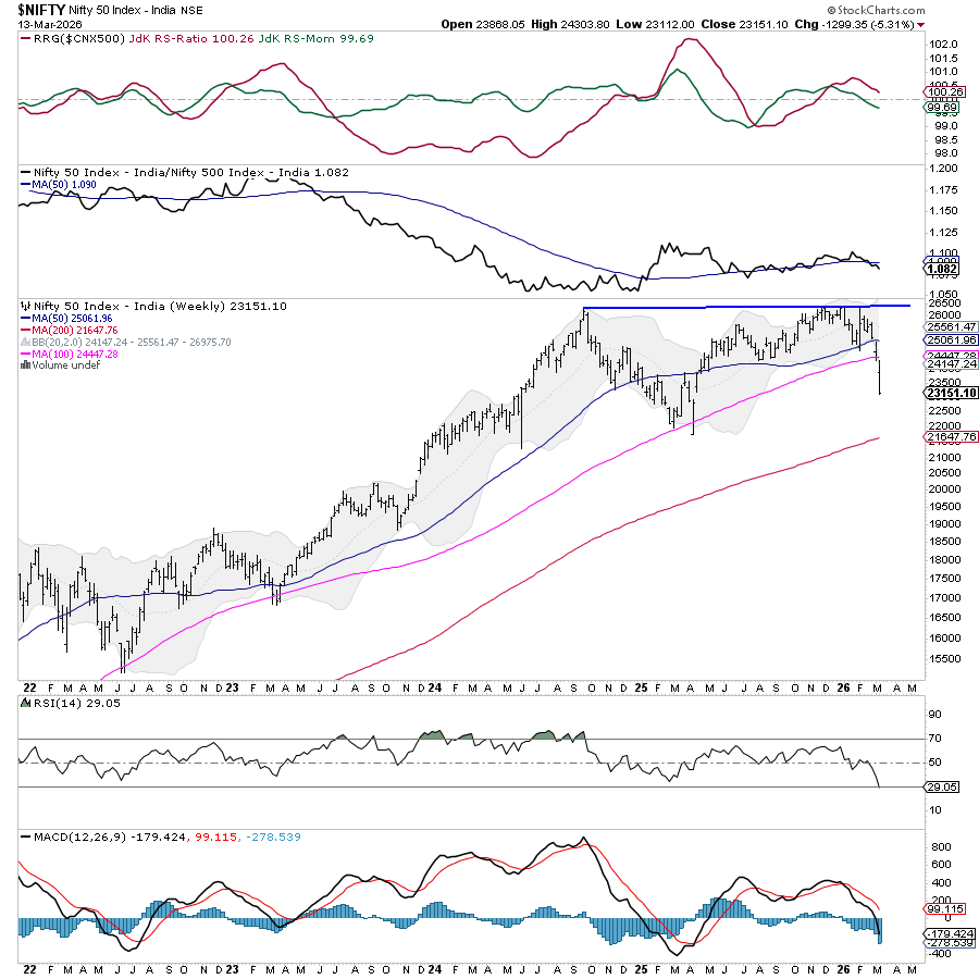
The markets witnessed a sharp and persistent decline through the week, ending decisively in the negative. After attempting to stabilize early in the week, the Nifty faced sustained selling pressure that intensified toward the latter half of the period. The index traded in a wide range of 1,191.80 points, oscillating between 24,303.80 and 23,112.00. Volatility remained elevated; India VIX surged another 13.91% during the week after rising nearly 45% in the previous week, reflecting heightened risk perception amid escalating geopolitical tensions. By the end of the week, the Nifty registered a net loss of 1,299.35 points (-5.31%).
From a structural perspective, the market has entered a technically vulnerable phase. The Nifty has decisively violated its 100-week moving average, 24,448, which had earlier acted as a strong intermediate support. This breakdown has altered the medium-term structure, shifting the bias toward the downside unless the index quickly reclaims this level. With volatility rising sharply and geopolitical developments remaining the central trigger, any rebound attempts are now likely to encounter strong resistance near the 24,400–24,500 zone, which coincides with the breached 100-week MA. A sustained move back above this area is required to stabilize sentiment, failing which the markets may remain prone to continued corrective pressure.
For the coming week, the markets may begin on a cautious note as participants continue to react to global developments and elevated volatility. The immediate resistance levels are at 23,500 and 23,750, while supports are at 23,000 and 22,710.
The weekly RSI stands at 29.06, having slipped into the oversold territory. The RSI has formed a fresh 14-period low, but it is presently neutral against price with no visible divergence. However, the oversold reading suggests that intermittent technical pullbacks cannot be ruled out. The weekly MACD remains below its signal line and continues to stay in negative territory, reflecting persistent bearish momentum. The week has also resulted in the formation of a large bearish candle, confirming strong selling pressure.
Pattern analysis of the weekly chart shows that the index has broken down from a broad consolidation pattern that had been developing near the highs, followed by a failure to hold above the 50- and the 100-week moving average. The Nifty has closed below the lower Bollinger band. A temporary pullback inside the band is likely; the current price action keeps the technical structure weak.
Given the sharp rise in volatility and the violation of key supports, market participants should adopt a cautious and defensive approach in the coming week. Fresh aggressive buying should be avoided until the index shows signs of stabilizing above the recently broken support levels. Traders should focus on protecting gains, maintaining disciplined stops, and adopting a highly stock-specific approach rather than aggressive index-based positioning. Until volatility cools off and the Nifty reclaims the 100-week moving average, risk management and selective participation remains the preferred strategy for the week ahead.
Sector Analysis for the Coming Week
In our look at Relative Rotation Graphs®, we compared various sectors against the CNX500 (NIFTY 500 Index), representing over 95% of the free-float market cap of all the listed stocks.
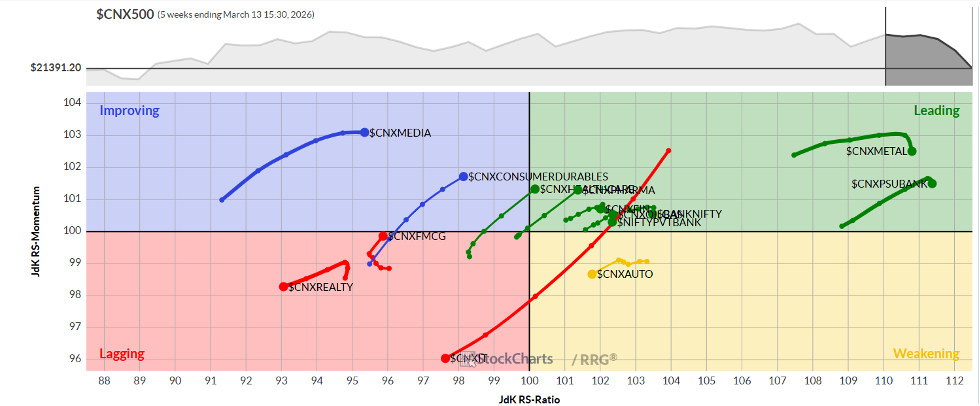
Relative Rotation Graphs (RRG) show that the Energy, Financial Services, PSE, Pharma, Nifty Bank, PSU Bank, Infrastructure, and Metal Indices are inside the leading quadrant. Though all these groups may still relatively outperform the broader markets, all indices except Pharma, PSE, and Energy are slowing down on their relative momentum.
The Nifty Services Sector Index, Midcap 100, and the Auto Index are inside the weakening quadrant. They may see individual stock-specific showings, but could collectively take a back seat when it comes to relative performance.
The Nifty IT and Realty Indices continue to languish inside the lagging quadrant. They may relatively underperform the broader markets. The FMCG Index is also inside the lagging quadrant, but it looks to be sharply improving its relative momentum against the broader markets.
The Nifty Media Index is the only one inside the improving quadrant. It is rotating strongly, indicating a continued improvement in its relative momentum against the broader Nifty 500 Index.
Important Note: RRG™ charts show the relative strength and momentum of a group of stocks. In the above Chart, they show relative performance against the NIFTY500 Index (Broader Markets) and should not be used directly as buy or sell signals.
Milan Vaishnav, CMT, MSTA
Consulting Technical Analyst
www.EquityResearch.asia | www.ChartWizard.ae