Week Ahead: NIFTY Stays On the Edge; This Zone Emerges As an Important Support Area

The markets traded with a distinctly weak bias throughout the week, witnessing a steady decline after an initial attempt to stabilize, before eventually ending marginally in the red. The Nifty oscillated in a defined range of 931 points before settling near the lower end of the range. Volatility remained firm; the India VIX edged higher by 0.74% to 22.81, reflecting rising nervousness in the market. The benchmark index closed the week with a modest loss of 36.60 points (-0.16%).
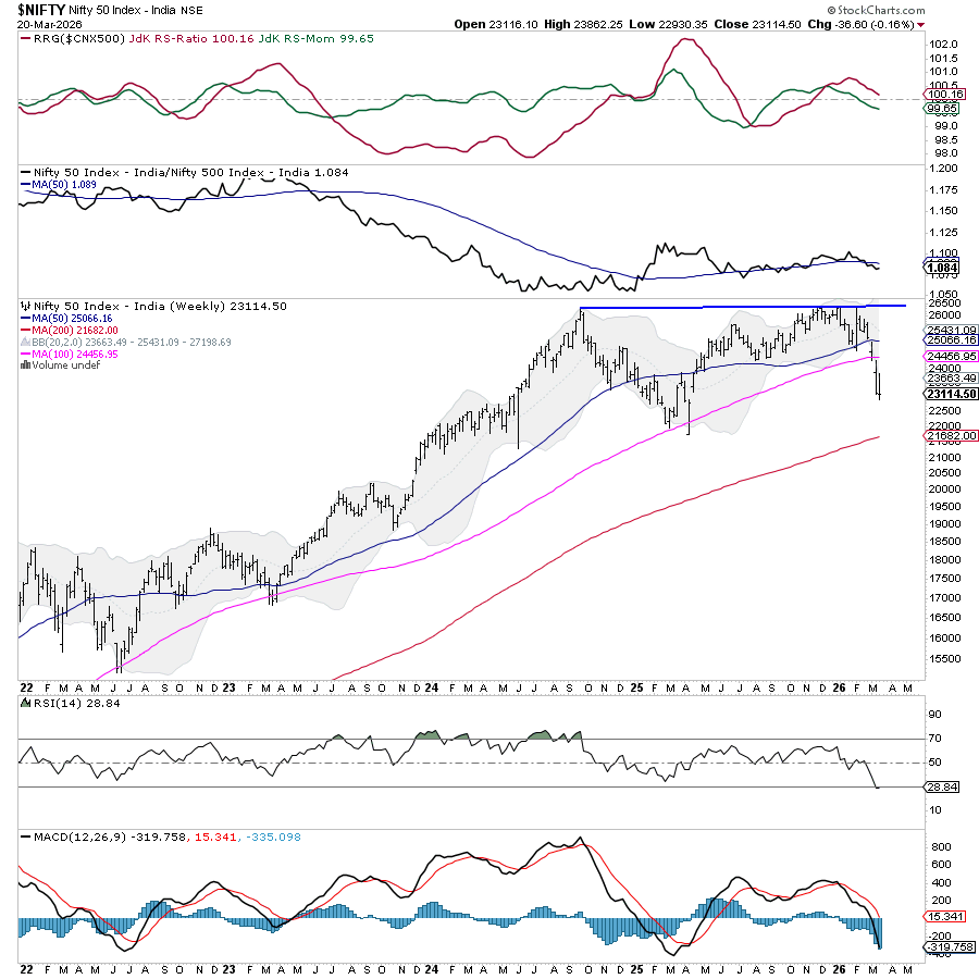
The broader technical structure has deteriorated further, with the Nifty decisively breaching its intermediate support zone and slipping below key moving averages. The index is now trading below its 50-week and 100-week moving averages, indicating a weakening trend. As long as the Nifty remains below the 23,450–23,600 zone, it is likely to stay under pressure. Any pullback toward this region may face supply. Conversely, a sustained move above this band would be required to negate the immediate bearish setup and trigger a short-covering move.
Given the current setup and the truncated trading week due to the Ram Navami holiday on Thursday, the markets are likely to see a cautious and possibly gap-driven start. The key resistance levels are placed at 23,450 and 23,650, while supports come in at 22,900 and 22,650.
The weekly RSI stands at 28.84, slipping into the oversold territory, and remains aligned with the price trend without showing any meaningful divergence, indicating continued weakness. It has formed a fresh 14-period low. The MACD remains bearish and below its signal line, with an expanding negative histogram, reinforcing the ongoing downside momentum.
From a pattern perspective, the Nifty has confirmed a bearish structure by staying well below two of its three key averages, which typically carry bearish implications. The index is also closed below its lower Bollinger Band, suggesting an overstretched condition in the near term, but not necessarily an immediate reversal. The 200-week moving average near 21,680 now emerges as a crucial long-term support zone if the decline extends further. However, a temporary pullback inside the band cannot be ruled out.
For the coming week, a cautious and defensive approach is strongly recommended. While oversold readings may lead to intermittent pullbacks, these are likely to face resistance at higher levels. Fresh aggressive buying should be avoided until clear signs of stabilization emerge. Traders should focus on protecting capital, maintaining lighter positions, and adopting a highly stock-specific approach. Any rebound should be used to reduce exposure rather than initiate fresh longs.
Sector Analysis for the Coming Week
In our look at Relative Rotation Graphs®, we compared various sectors against the CNX500 (NIFTY 500 Index), representing over 95% of the free-float market cap of all the listed stocks.
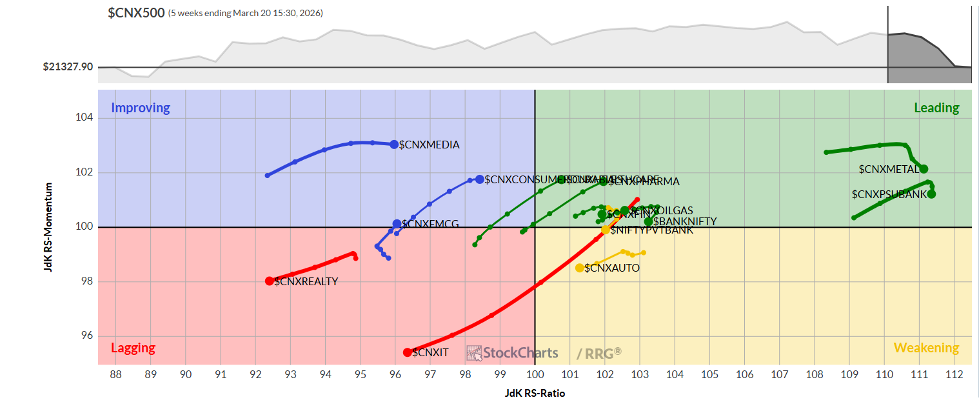
Relative Rotation Graphs (RRG) show that the Nifty Energy Sector has stayed firmly placed inside the leading quadrant. Along with that, the PSE, Pharma, and Infrastructure Indices are also firmly rotating inside this quadrant. These groups may relatively outperform the broader markets. The Metal, PSU Bank, Banknifty, and Financial Services Indices are also inside this quadrant; however, they are seen giving up on their relative momentum. While they may not decline much, their pace of outperformance can be seen taking a breather.
The Nifty Auto and the Midcap 100 Indices continue to stay inside the weakening quadrant. Their relative performance, too, may take a back seat while individual stock-specific shows may not be ruled out.
The Nifty Services Sector Index has rolled inside the lagging quadrant. The Realty and the IT groups are also seen languishing inside this quadrant; they may relatively underperform the broader markets.
The Nifty FMCG Index has rolled inside the improving quadrant. The Media Index is also inside this quadrant. These two groups may see improved relative performance going ahead from here.
Important Note: RRG™ charts show the relative strength and momentum of a group of stocks. In the above chart, they show relative performance against the NIFTY500 Index (Broader Markets) and should not be used directly as buy or sell signals.
Milan Vaishnav, CMT, MSTA
Consulting Technical Analyst
www.EquityResearch.asia | www.ChartWizard.ae