What are These Two Reliable Indicators Saying About a Top in Gold and Silver?
Throughout history, people have searched for that "holy grail" of indicators able to spot major turning points in markets within a few ticks of the final high or low. I have always said the holy grail of investing is knowing that the holy grail does not exist! That said, there are a couple of techniques we can apply to gold and silver, which have consistently warned of an impending intermediate correction or primary bear market. They are not the holy grail by any means, but I would certainly like to have them with me if I ever get stranded on a desert island.
In that respect, Chart 1 features the monthly gold price back to 1976. A PPO using the 6- and 15-month parameters is also featured. What we can see is that an important peak is likely when the oscillator first exceeds or touches its red horizontal overbought line at 7.5 and then decisively re-crosses it on its way back towards equilibrium.
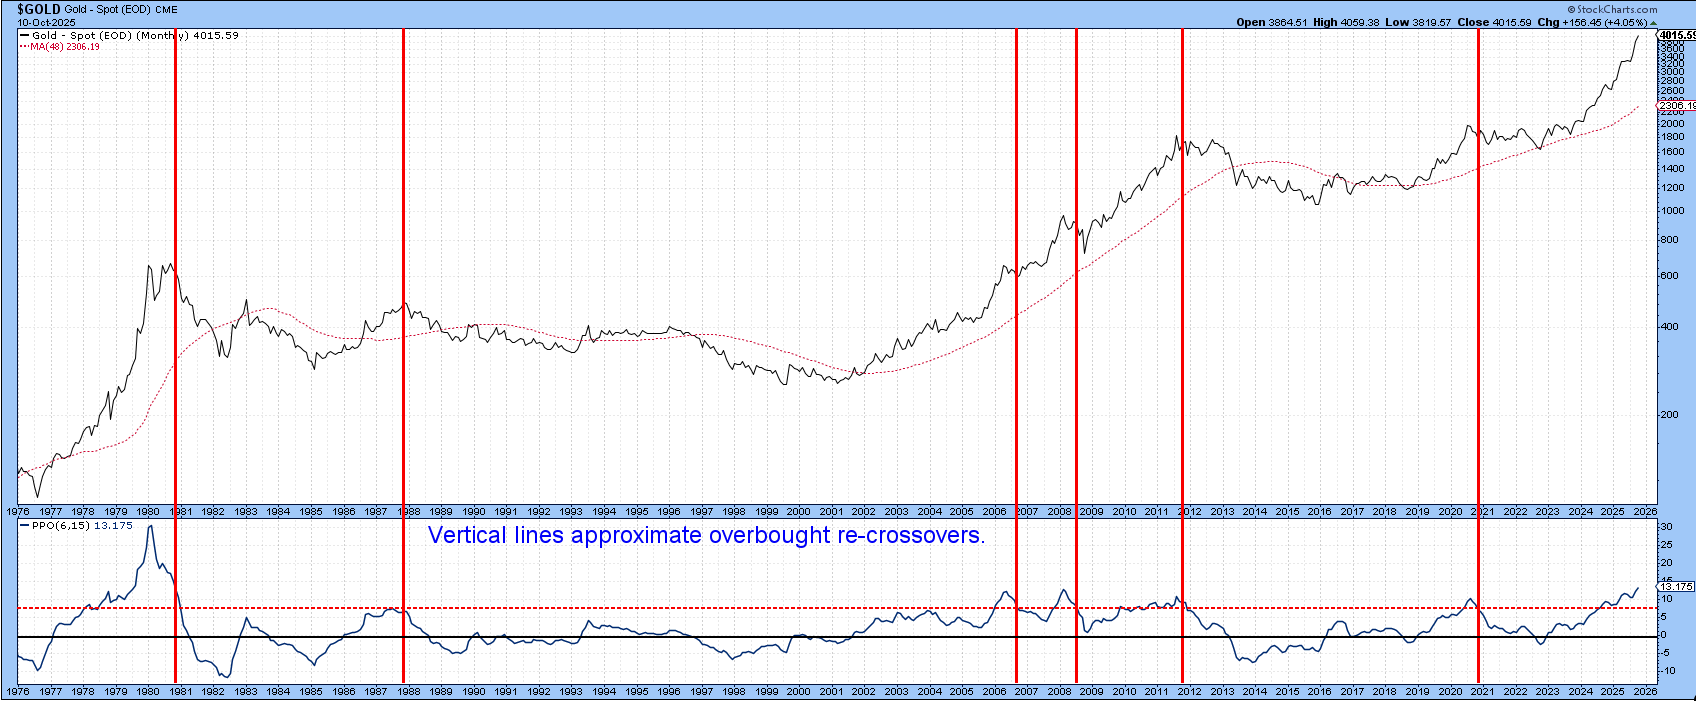
The vertical lines indicate the 1980 and 2011 secular peaks were signaled this way, as were the 1988 and 2020 primary turning points. The 2006 and 2008 intermediate reactions complete this picture.
Chart 1 reveals that the oscillator remains in an upward trajectory and has not therefore triggered its seventh sell signal since1976. It’s important to remember, though, this is a monthly chart, and a final October reading requires a couple more weeks of data.
In the meantime, a short-term “fix” is available. It takes the form of the Special K crossing decisively below its signal line at an extreme level, shown in Chart 2. You can read about the Special K (SPK) here. The vertical lines again identify the sell signals. Since this chart is constructed from daily data, it has the advantage of not having to wait for the monthly closing.
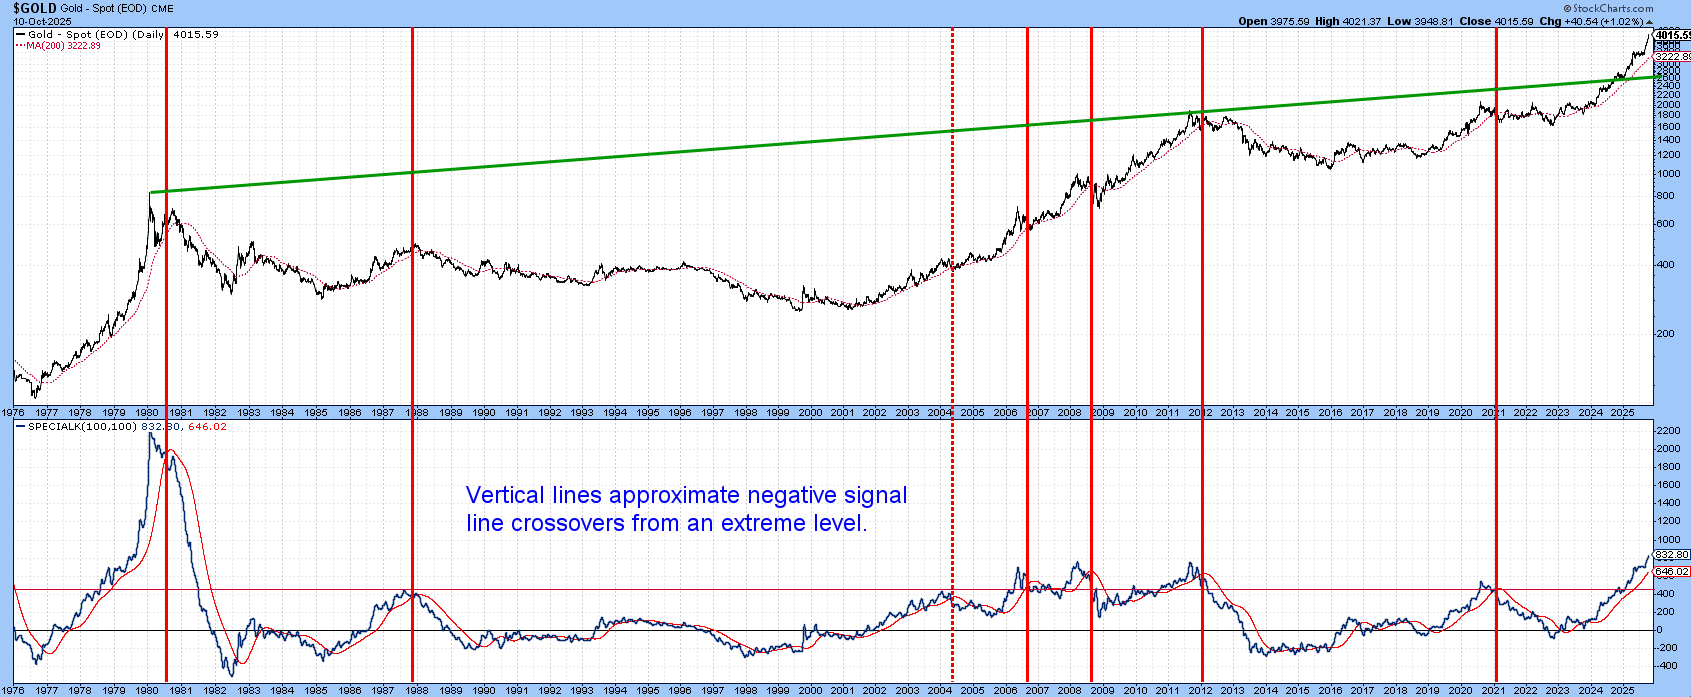
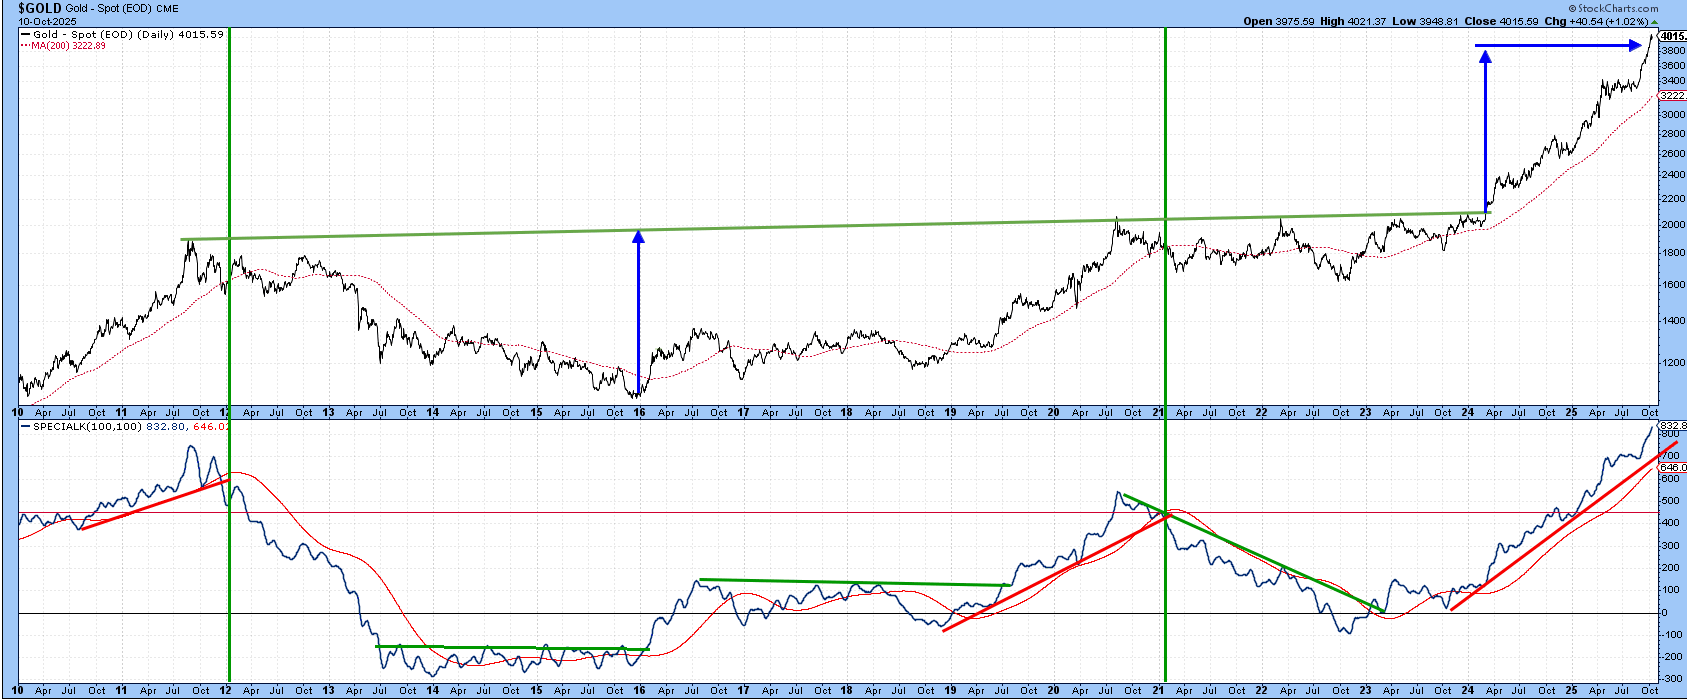
Chart 3 focuses on the last few years. The SPK is obviously moving up sharply with no indication of a peak at this point.
The chart also indicates when it is possible to construct trendlines on the SPK and their violation has been followed by worthwhile price moves. Fortunately, price action since the beginning of 2024 has allowed the construction of another trendline, whose violation will likely act as an early bird signal of a negative signal line crossover and subsequent correction.
Hail Silver
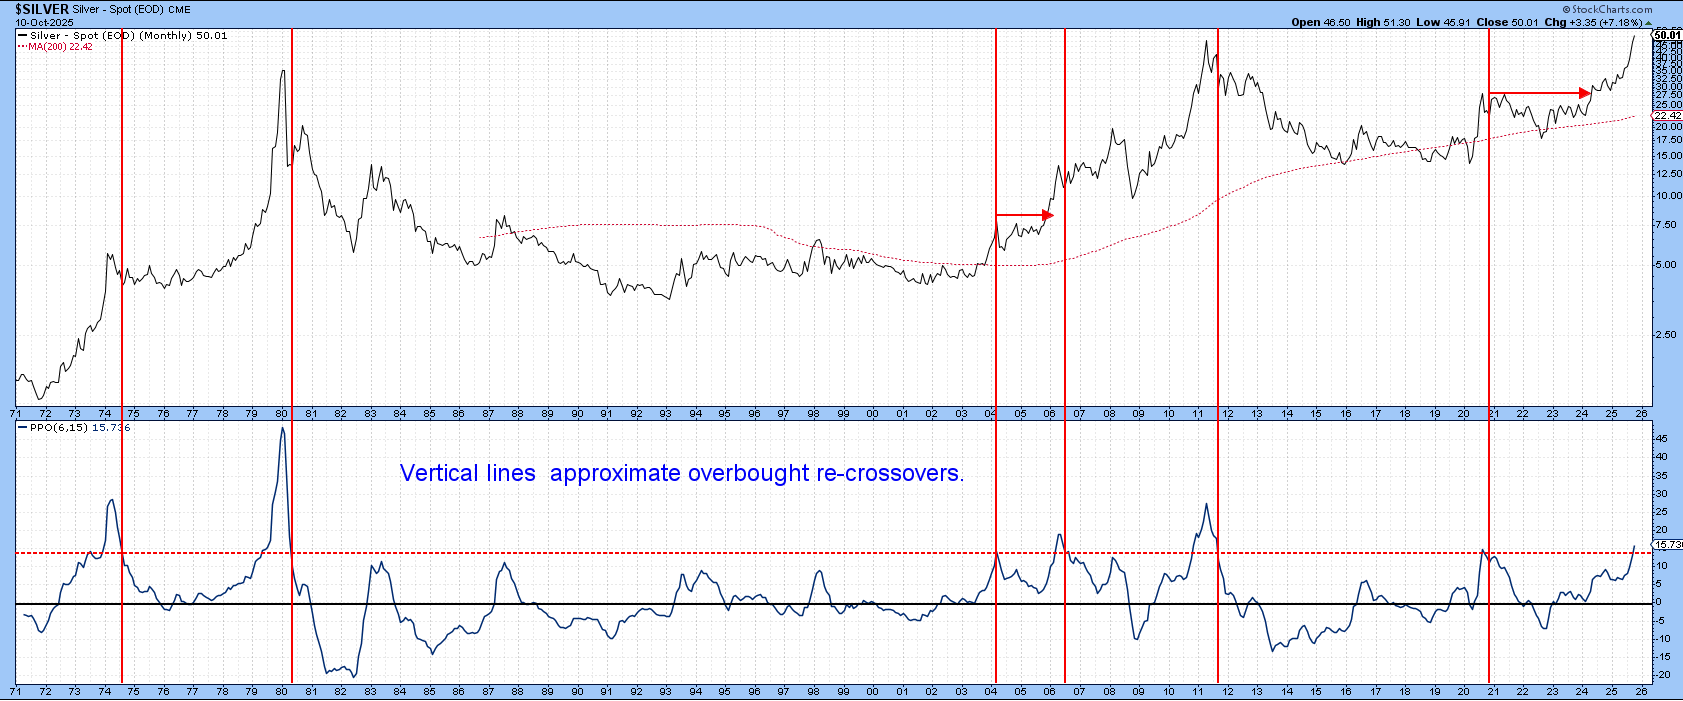
The same techniques can be applied to silver, which is helpful as corroborating evidence since gold and silver often experience major peaks around the same time. Chart 4 displays the PPO approach, where we see that every signal was followed by a correction. The bad news is that there is no known technique that consistently forecasts the magnitude or duration of a forthcoming move. Silver’s PPO, just like gold, remains on its upward trajectory, which suggests in terms of time a peak is not far off. Magnitude is another matter, as substantial, dare I say high-risk, gains are often booked in the final push to the summit.
Extending the Special K treatment to silver returns eleven sell signals, as flagged by the vertical lines in Chart 5. The two dotted ones identify the two that could legitimately be classified as failures. As with gold, the SPK for silver continues to barrel ahead.
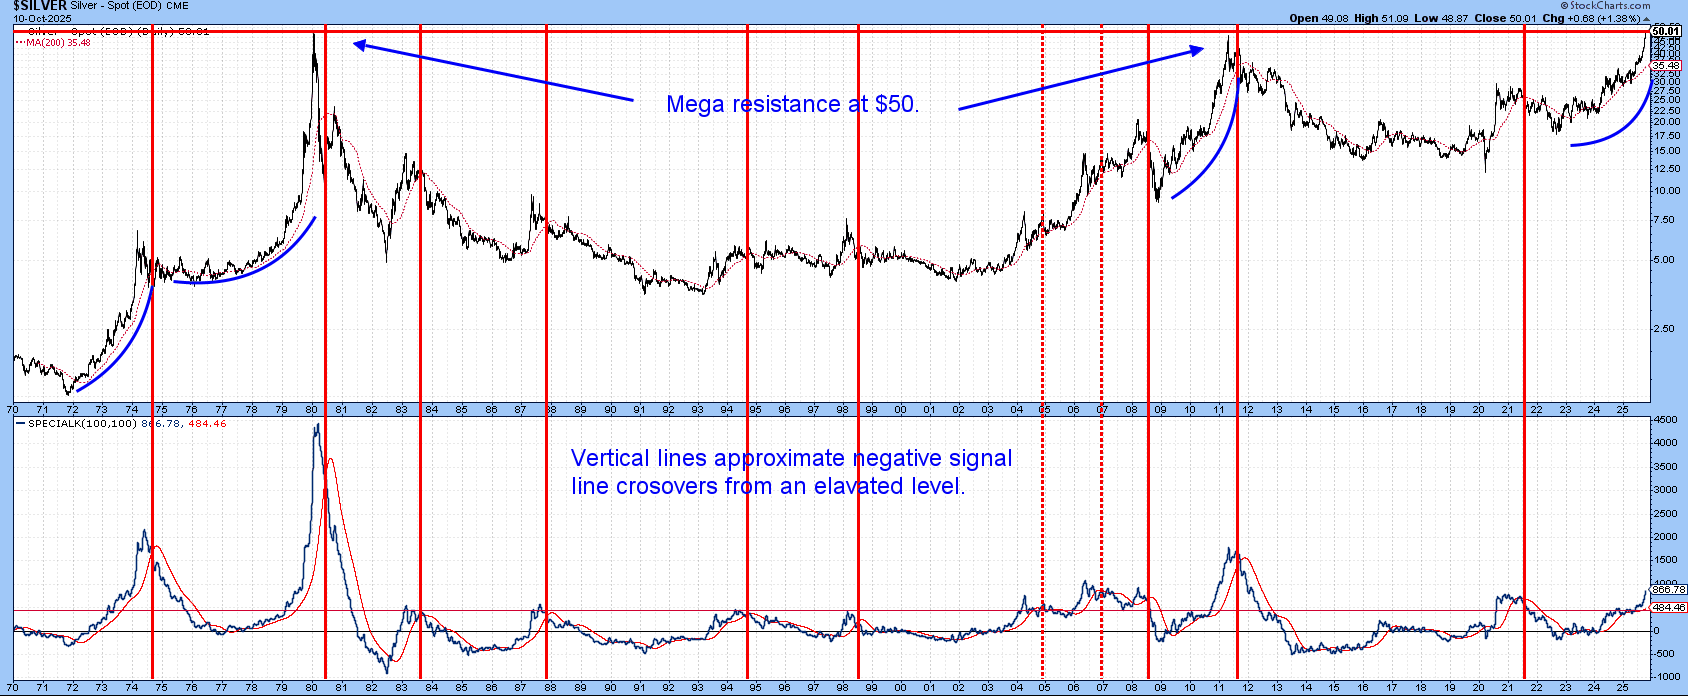
The chart reveals two additional key points. First, the price has rallied back to $50, where it was turned back in 1980 and 2011. Fifty dollars is clearly an important resistance barrier for further gains. Second, silver has experienced three parabolic bull markets since 1970. A fourth could be underway.
I think the next couple of weeks or so will be critical for these metals. On the one hand, overhead resistance could prove to be an overwhelming barrier, subsequently presenting us with a PPO and SPK sell signal. On the other, the price continues on its exponential rise and barrels through that resistance and, like its 1974, 1980 and 2011 experiences, records huge (high risk) gains over a relatively brief period. Until those two signals are generated, it is premature to take a bearish stance.
Good luck and good charting,
Martin J. Pring
The views expressed in this article are those of the author and do not necessarily reflect the position or opinion of Pring Turner Capital Group of Walnut Creek or its affiliates.


