When the Rally Stops Working: How to Know If Your AI Stock Is Rolling Over

It's a Familiar Feeling!
Last Thursday’s sharp selloff in AI stocks, which was sparked after NVIDIA traded lower despite posting another powerful earnings report, brought back memories of the dot-com era. That reaction is understandable. When a market leader stops responding positively to strong results, investors pay attention.
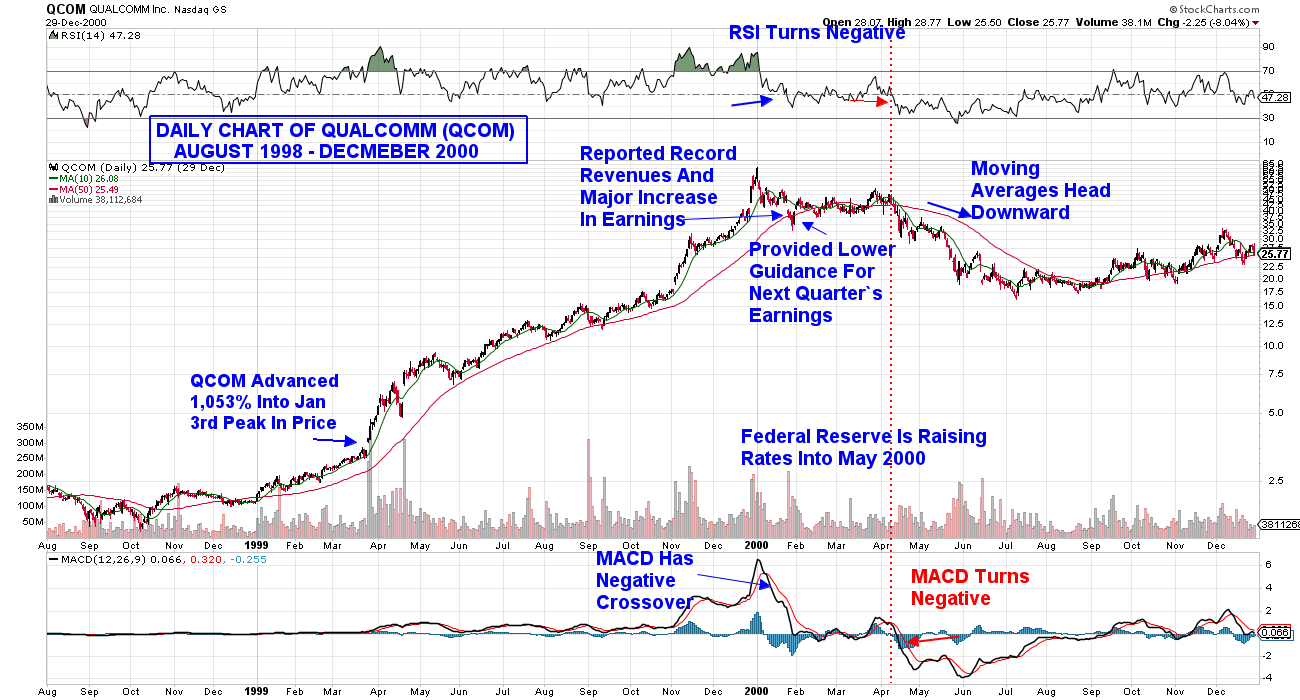
In 2000, companies like Cisco Systems and Qualcomm continued reporting solid growth even as their stocks began to roll over. Take a look at the chart for Qualcomm below. In Q1 of 2000, the company posted record revenues and a dramatic surge in earnings, yet the stock topped. The fundamentals held up longer than the stock price did.
The lesson was clear: when great earnings stop producing great price action, something has changed.
Why NVIDIA’s Reaction Matters, but Differently
NVIDIA’s muted response wasn’t isolated. It was the third consecutive quarter in which strong results failed to spark upside momentum. That pattern deserves attention.
From my years working directly with William O’Neil, one principle stood above all others: leadership is defined by price performance, not just fundamentals. A company can report exceptional growth and still fail to qualify as a leader. If it’s not outperforming the broader market, it’s a laggard.
True leaders demonstrate powerful relative strength, typically reflected in an RS Rating of 80 or higher. When a fundamentally strong stock begins to underperform, it often means expectations are fully priced in, or institutional sponsorship is rotating elsewhere. That doesn’t automatically signal a bubble, but it does signal a possible shift in leadership.
This Is Not 2000
It’s important to keep perspective. At the peak of the dot-com era, much of the Nasdaq’s advance was driven by companies with little or no earnings. Valuations were detached from cash flow because profits often didn’t exist.
By comparison, today’s AI leaders are generating real earnings, real cash flow, and benefiting from visible enterprise demand. The foundation is materially stronger. That difference matters.
The Chart Will Tell You First
When a fast-moving stock begins to roll over, the chart changes before the fundamentals.
Healthy leaders make higher highs after orderly pullbacks. When that pattern shifts to a sharp decline followed by rallies that stall below prior highs, buyers are losing control. Heavy volume in down weeks adds evidence of institutional distribution.
For longer-term investors, the weekly chart is the most reliable guide. A sustained break below the 10-week moving average, together with deteriorating momentum and relative strength, is often the earliest confirmation that a primary trend is shifting.
The Bottom Line?
AI stocks are likely to continue moving faster than many investors expect.
If you’d like to be alerted to leading stocks poised to outperform, use this link here for a no-cost trial of my twice weekly MEM Edge Report.)