Will These Three Promising Charts Hold Key Support?

As we’ve now hit the six-month mark in the Great Bull Market of 2025, weakening market breadth conditions speak to the fact that not all stocks are trending steadily higher. In fact, some of the leading growth stocks are testing key support levels, providing a clear “line in the sand” where the sustainability of this bullish phase may need to be questioned.
Today, we’ll break down three key stocks where support is in play, where holding that support will be vital for confirming an ongoing bull market, and where a breakdown could imply the end of the uptrend for the S&P 500.
Broadcom Inc. (AVGO)
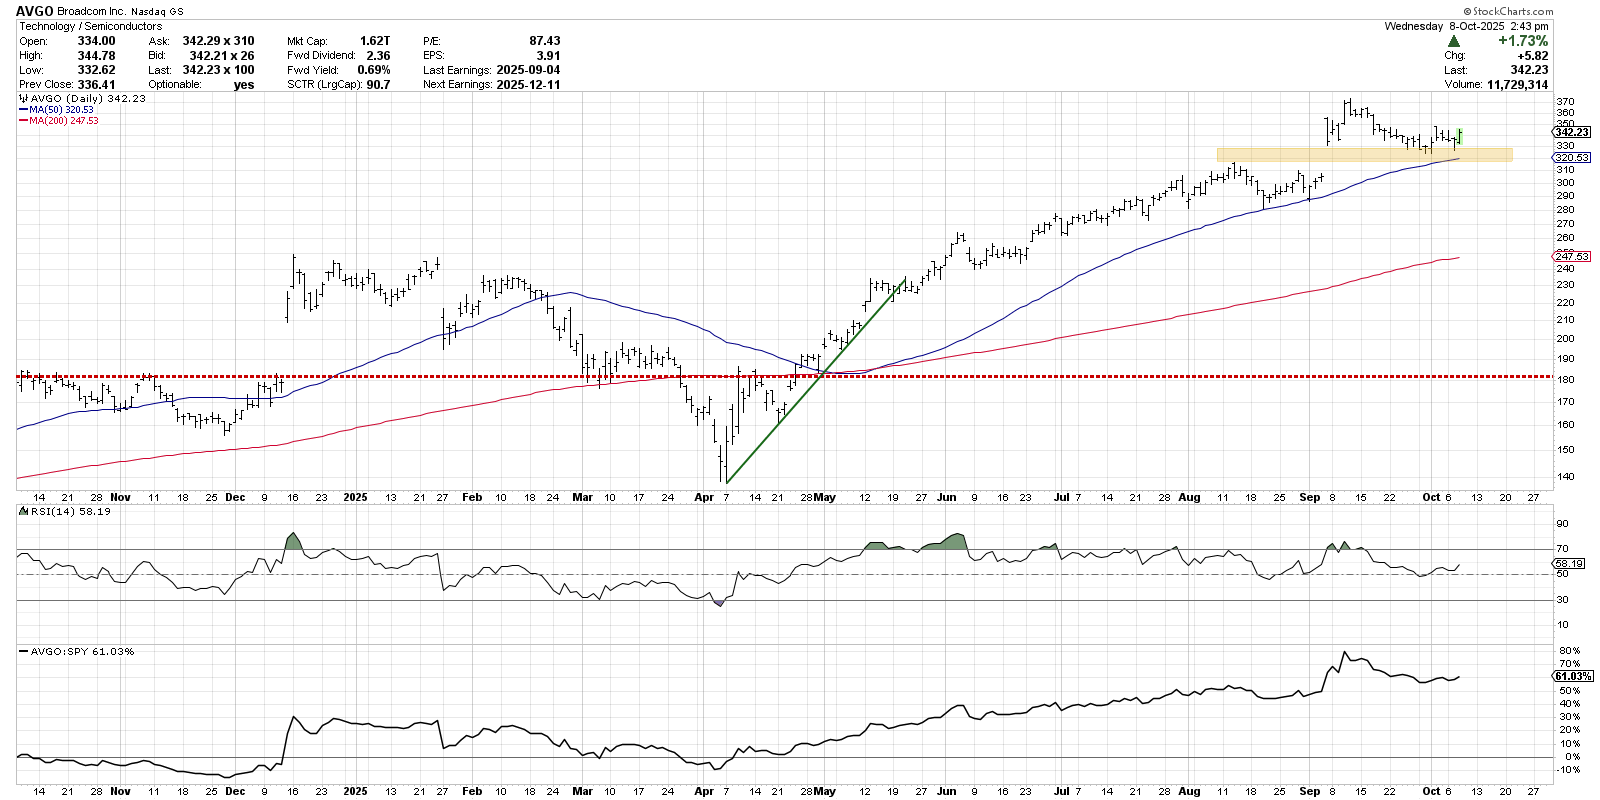
The Magnificent 7 have evolved into more of a “Mixed 7” as leading names like Meta Platforms (META) and Amazon.com (AMZN) have pulled back to test support. I consider Broadcom (AVGO) as part of a larger “Magnificent 7 and Friends” group of leading growth stocks, and this chart has perhaps the most obvious pivot point of all.

Broadcom gapped higher after its September earnings report, driving above its previous all-time high of around $320. After briefly pushing above $370 about a week later, AVGO has since dropped down to retest that gap range. If Broadcom would break below crucial support at $320, that would mean a break below that August all-time high and also involve a breakdown of the 50-day moving average.
If the stock were to eventually drop below this floor, the chart implies further downside support at the August swing lows around $280, as well as the 200-day moving average down around $250.
Welltower Inc. (WELL)
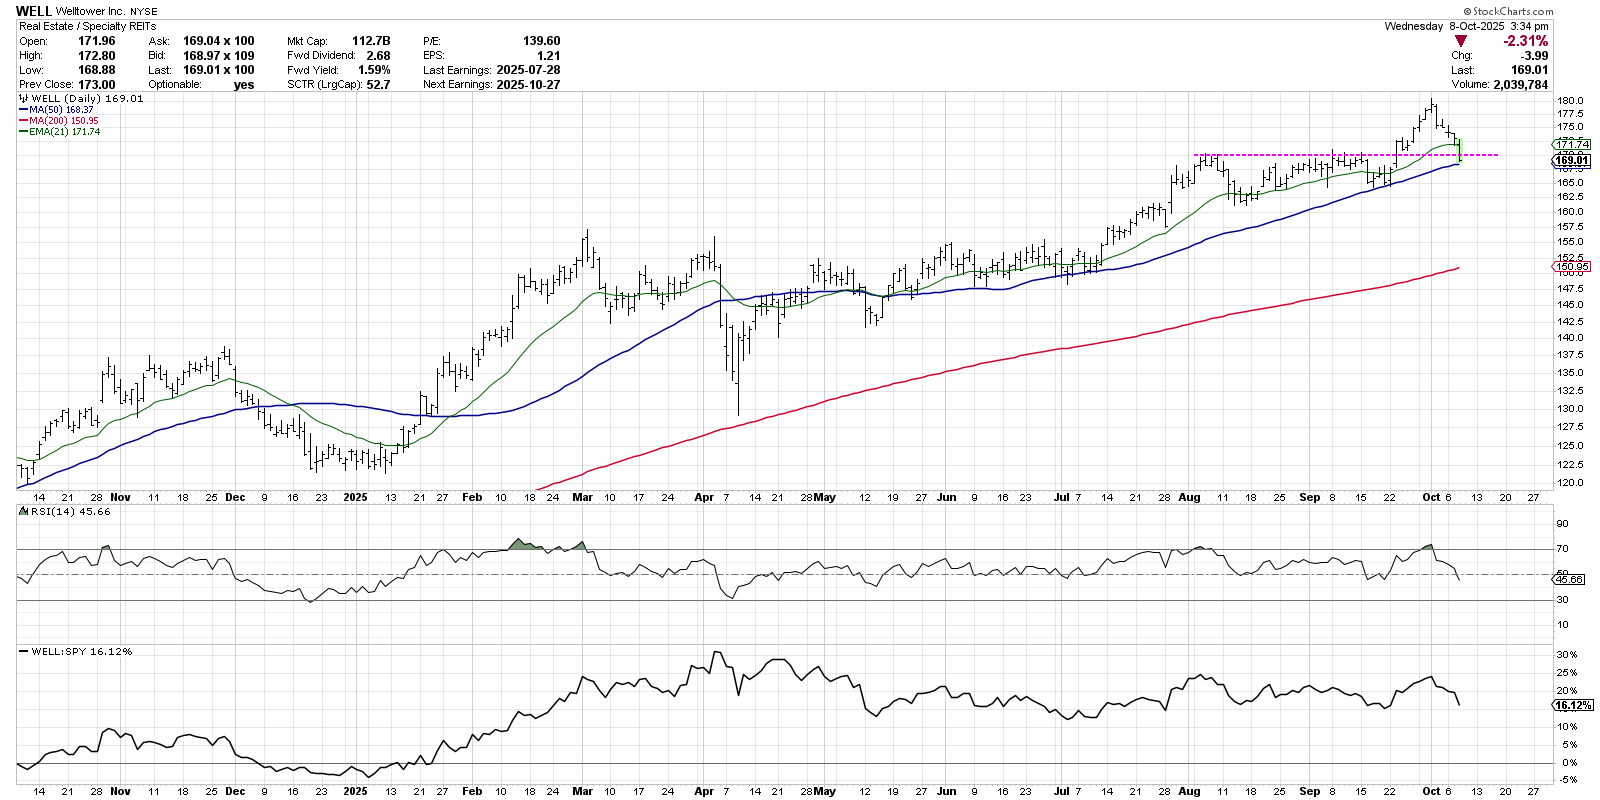
While Welltower (WELL) is part of one of the more defensive sectors, Real Estate, this stock provides a play on a significant secular growth theme.
WELL is in the business of senior living and medical facilities. As a huge cohort of Americans will be needing these services in the coming years, companies like Welltower stand to benefit.

In a similar fashion to the chart of Broadcom, WELL recently broke above a major resistance level based on the swing highs in August and September. After driving higher to around $180, Welltower has now pulled back to test the previous breakout level around $170. Now, the question is whether WELL can hold support at the $170 level, which also lines up with the 50-day moving average.
In this sort of situation, besides monitoring price support to see if it holds, I also like to focus on the momentum configuration. If WELL can establish a swing low with the RSI holding the 40 level, that would suggest a larger bullish trend is still intact. If, however, Welltower fails to hold support, and that breakdown is validated by the RSI pushing below 40, then we’re more likely into a new distribution phase for this senior housing play.
APA Corporation (APA)
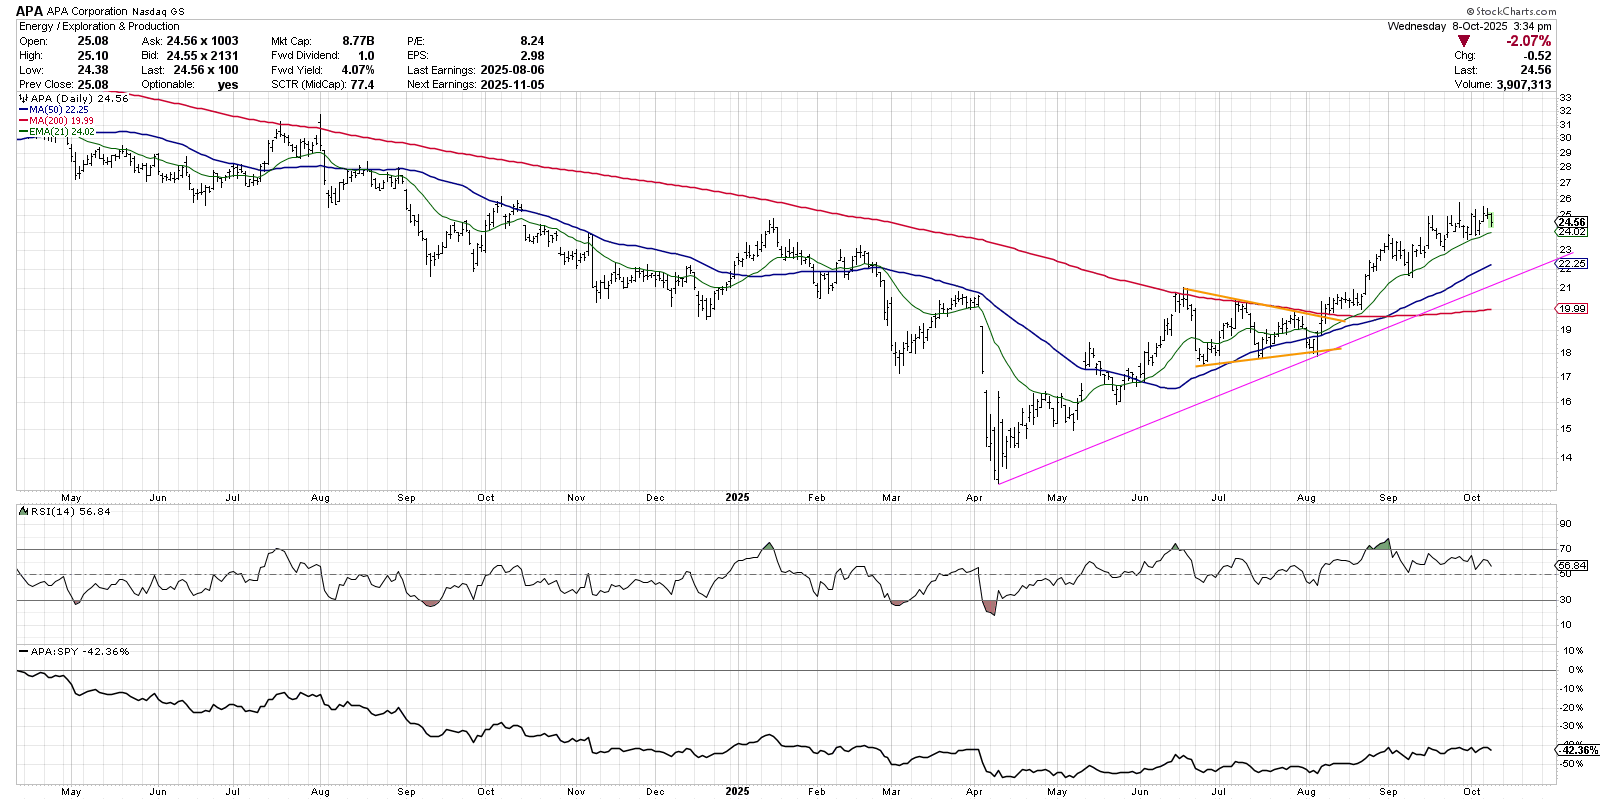
Despite the generally underwhelming price action for crude oil of late, certain stocks within the energy sector have demonstrated impressive gains into Q4. One of these names, APA Corporation (APA), broke above resistance in August and has not looked back.

Note the symmetrical triangle or “coil” pattern starting in June, with the upper boundary of that pattern tracking the 200-day moving average. When APA finally resolved this chart pattern to the upside in early August, that also meant the stock was above the 200-day moving average for the first time since 2023!
Over the last two months, APA has followed through with further upside, with a number of brief pullbacks finding support at the 21-day exponential moving average. Here, we’re noting a bearish momentum divergence, with new highs in September marked by weaker RSI readings. As long as APA holds an ascending 21-day EMA, though, this stock remains in a primary uptrend phase.
For more on these three charts, along with the rest of the Top Ten Charts to Watch in October 2025, head over to the StockChartsTV YouTube channel!
RR#6,
Dave
P.S. Ready to upgrade your investment process? Check out my free behavioral investing course!
David Keller, CMT
President and Chief Strategist
Sierra Alpha Research
marketmisbehavior.com
https://www.youtube.com/c/MarketMisbehavior
Disclaimer: This blog is for educational purposes only and should not be construed as financial advice. The ideas and strategies should never be used without first assessing your own personal and financial situation, or without consulting a financial professional.
The author does not have a position in mentioned securities at the time of publication. Any opinions expressed herein are solely those of the author and do not in any way represent the views or opinions of any other person or entity.


