MEMBERS ONLY
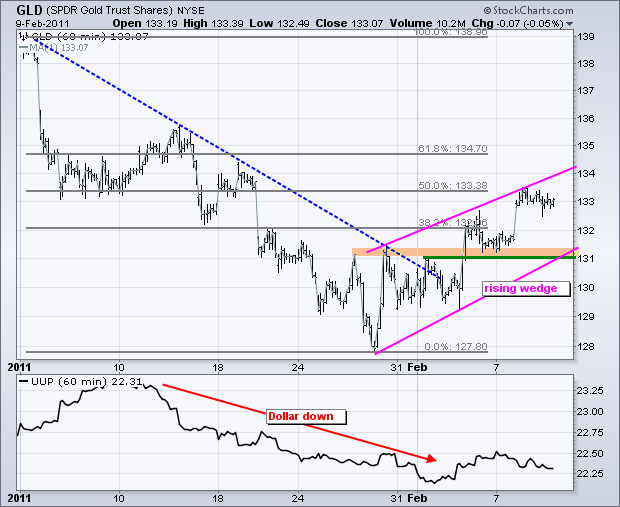
Gold and Euro Form Rising Wedges as SPY Holds Gap
by Arthur Hill,
Chief Technical Strategist, TrendInvestorPro.com
The Gold SPDR (GLD) remains in an uptrend, but this bullion ETF warrants a close watch as it trades near the 50% retracement with a rising wedge. I identified the inverse head-and-shoulders and breakout last week and GLD remains in an uptrend as long as the wedge rises. Typically, a...
READ MORE
MEMBERS ONLY
Charts of Interest: ABX, FCX, HRB, MHP, SWY, X
by Arthur Hill,
Chief Technical Strategist, TrendInvestorPro.com
ABX forms rising flag. SWY breaks P&F trendline. X forges bearish engulfing at resistance. Plus FCX,HRB,MHP.
This commentary and charts-of-interest are designed to stimulate thinking. This analysis is not a recommendation to buy, sell, hold or sell short any security (stock ETF or otherwise). We all...
READ MORE
MEMBERS ONLY
A Buying Climax or New Leg Higher for XLY
by Arthur Hill,
Chief Technical Strategist, TrendInvestorPro.com
After taking a big hit at the end of January, the Consumer Discretionary SPDR (XLY) firmed and surged to a new 52-week high this month. The ETF is up seven of the last eight days with a 5.3% advance. This is the sharpest advance since early September. This is...
READ MORE
MEMBERS ONLY
Money Fleeing Bonds Finds its Way into Stocks and Gold
by Arthur Hill,
Chief Technical Strategist, TrendInvestorPro.com
A virtual free fall in bonds is fueling a rally in stocks, and possibly gold. The first chart shows the 10-year Treasury Yield ($TNX) surging from 33.25 to 37.25 (3.325% to 3.725%) over the last seven days. The corresponding bond ETF (IEF) has fallen from around...
READ MORE
MEMBERS ONLY
Oil ETF and Gasoline ETF Disconnect
by Arthur Hill,
Chief Technical Strategist, TrendInvestorPro.com
The USO Oil Fund (USO) and the US Gasoline Fund (UGA) normally track each other pretty well, but these two have gone their separate ways over the last four weeks. UGA (red) is up around 1% and USO (black) is down around 4% since January 11th. This is unlikely to...
READ MORE
MEMBERS ONLY
A Buying Climax for SPY?
by Arthur Hill,
Chief Technical Strategist, TrendInvestorPro.com
The S&P 500 ETF (SPY) is up 3.3% in the last six trading days or month-to-date. This is the sharpest 6-day advance since early December. There is, however, a big difference between the early December surge and the current surge. Looking back, I identified four times when...
READ MORE
MEMBERS ONLY
Charts: AKAM,APD,CAKE,FDX, GTIV,MHP,S,URBN,USG
by Arthur Hill,
Chief Technical Strategist, TrendInvestorPro.com
AKAM shows relative weakness. APD breaks flag resistance with gap. S consolidates with triangle. Plus CAKE, FDX, GTIV, MHP, URBN, USG
This commentary and charts-of-interest are designed to stimulate thinking. This analysis is not a recommendation to buy, sell, hold or sell short any security (stock ETF or otherwise). We...
READ MORE
MEMBERS ONLY
Pockets of Red in the Year-to-date Sector Market Carpet
by Arthur Hill,
Chief Technical Strategist, TrendInvestorPro.com
The S&P Sector Market Carpet provide a nice color-coded means to view performance over a given period of time. This chart shows performance since December 31st. All sectors are up, but there are rather significant pockets of weakness (red) within these sectors.
Click this image for a live...
READ MORE
MEMBERS ONLY
Gold Breakout, Euro Resistance, Market Breadth Remains Bullish
by Arthur Hill,
Chief Technical Strategist, TrendInvestorPro.com
The Dollar/Gold relationship is a tough one to figure out these days. 2011 has seen both decline in January and bounce in February. The correlation this year appears to be largely positive, which is counter to the historically negative correlation. At times like these, it is often best to...
READ MORE
MEMBERS ONLY
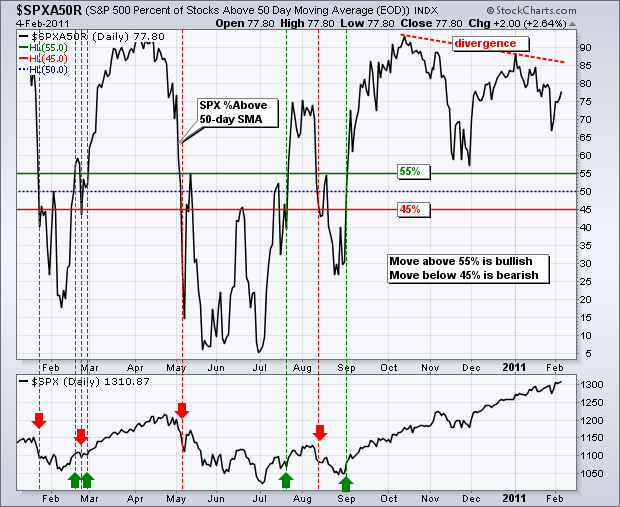
PERCENT OF $SPX STOCKS ABOVE 50-DAY REMAINS BULLISH
by Arthur Hill,
Chief Technical Strategist, TrendInvestorPro.com
The S&P 500 %Above 50-day SMA ($SPXA50R) indicator is a breath gauge that measures the degree of participation. In this instance, the indicator tells us the percentage of S&P 500 stocks that are above their 50-day SMAs. In general, a bullish bias exists when more than...
READ MORE
MEMBERS ONLY
A Bandwidth Contraction and Breakout for Garmin
by Arthur Hill,
Chief Technical Strategist, TrendInvestorPro.com
Bollinger Bands narrow as volatility falls and widen as volatility rises. The theory is that a volatility contraction is often followed by a volatility expansion. The directional clue depends on the break. Garmin (GRMN) has a classic contraction breakout working with a surge above the upper band on Friday. Notice...
READ MORE
MEMBERS ONLY
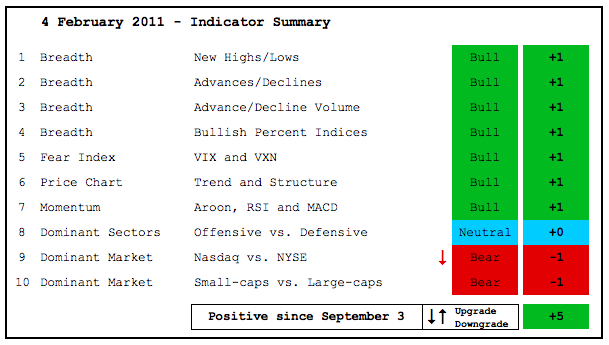
Indicator Summary Completes Fifth Bullish Month
by Arthur Hill,
Chief Technical Strategist, TrendInvestorPro.com
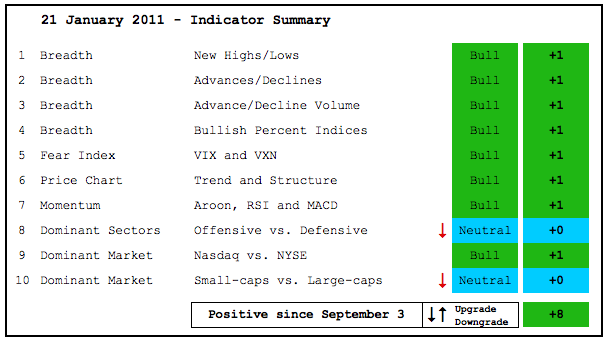
Despite relative weakness in small-caps, the consumer discretionary sector and the Nasdaq, the bulk of the evidence remains bullish for stocks. Moreover, this indicator summary has been positive since 3-September, five months now. The NYSE AD Line hit a new high this week. The S&P 500 ETF, S&...
READ MORE
MEMBERS ONLY
SPY Holds Gains as Short-term Nasdaq Breadth Turns Up
by Arthur Hill,
Chief Technical Strategist, TrendInvestorPro.com
There is not much change on the charts as we head into the employment report. This is kind of like a Fed announcement, expect most action occurs before the NYSE and Nasdaq actually open. The report is issued at 8:30 AM ET and the stock exchanges open an hour...
READ MORE
MEMBERS ONLY
Charts of Interest: AZO, CHS, BBBY, EXP, FFIV, SOL, SPWRB
by Arthur Hill,
Chief Technical Strategist, TrendInvestorPro.com
CHS forms bearish flag. FFIV firms in gap zone. SPWRB forms continuation HS pattern. Plus AZO, BBBY, EXP, SOL
This commentary and charts-of-interest are designed to stimulate thinking. This analysis is not a recommendation to buy, sell, hold or sell short any security (stock ETF or otherwise). We all need...
READ MORE
MEMBERS ONLY
SunPower Traces out a Bullish Continuation Pattern
by Arthur Hill,
Chief Technical Strategist, TrendInvestorPro.com
There are two types of head-and-shoulders patterns: reversal and continuation. A reversal pattern changes the trend, while A continuation pattern resumes the trend. SunPower surged in September and then consolidated with an inverse head-and-shoulders. Neckline resistance resides in the 14.90-15.10 zone. A breakout would suggest a continuation of...
READ MORE
MEMBERS ONLY
GLD Firms in Downtrend as SPY Stalls Near New High
by Arthur Hill,
Chief Technical Strategist, TrendInvestorPro.com
The Gold SPDR (GLD) is trying to stabilize with a small inverse head-and-shoulders pattern. Gold has been one of the weakest instruments in 2011. The chart below shows GLD peaking around 139 and moving below 129 last week for a ±7.1% decline. Even though the short-term trend is clearly...
READ MORE
MEMBERS ONLY
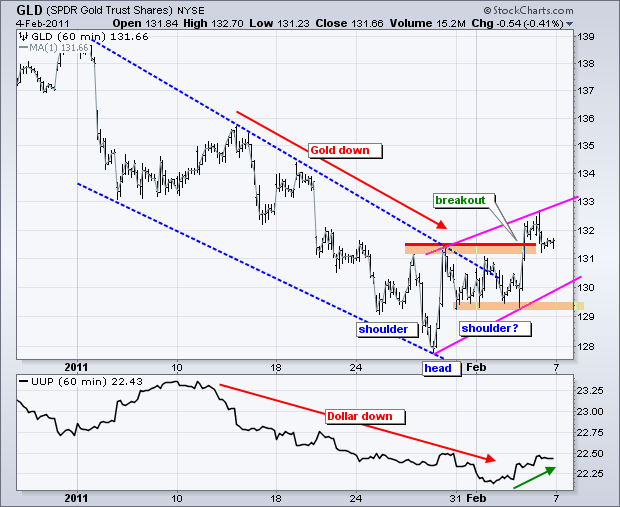
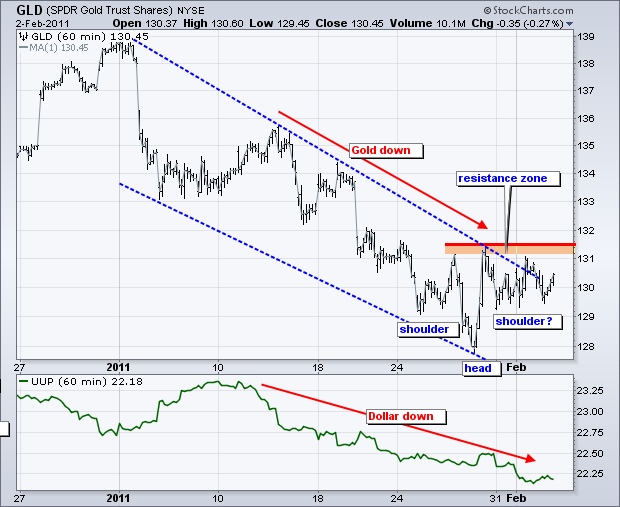
Gold ETF Forms Small Inverse Head-and-shoulders Pattern
by Arthur Hill,
Chief Technical Strategist, TrendInvestorPro.com
The Gold SPDR (GLD) remains in a clear downtrend, but a small inverse head-and-shoulders pattern is taking shape the last 10 days. Neckline resistance resides in the 131-131.5 area and a break above this level would reverse the 4-5 week slide. Also notice that the Dollar and gold have...
READ MORE
MEMBERS ONLY
$SPY Surges Above January High on First Day of Month
by Arthur Hill,
Chief Technical Strategist, TrendInvestorPro.com
A downtrend is impossible when an index hits a new high. Monday's short-term trend reversal has become a whipsaw or simply a bad call. With a gap up and break above 130, SPY re-established its short-term uptrend. A postmortem reveals four reasons for the errant trend reversal. First,...
READ MORE
MEMBERS ONLY
Euro Top 100 Index Stays Above April High $EUR
by Arthur Hill,
Chief Technical Strategist, TrendInvestorPro.com
The Euro Top 100 Index ($EUR) may be underperforming the S&P 100, but the index is clearly in an uptrend. $EUR broke its April high in December and recorded a 52-week high in January. There is nothing but uptrend as long as the May trendline holds. This index...
READ MORE
MEMBERS ONLY
Watching Bonds for a Break as Euro Establishes Support
by Arthur Hill,
Chief Technical Strategist, TrendInvestorPro.com
Interest rates and bonds remain stuck in a never-ending trading range. Calling it "never-ending" will hopefully bring a quicker end to this consolidation. Bonds have been weighed down by rising commodity prices and strength in the economy. Oil surged over 7% the last two days and the Chicago...
READ MORE
MEMBERS ONLY
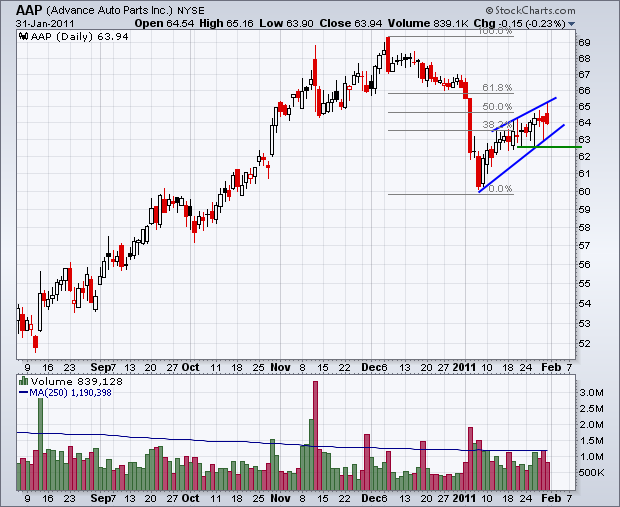
Charts of Interest: AAP, ERTS, INTU, M, MMM, PBR
by Arthur Hill,
Chief Technical Strategist, TrendInvestorPro.com
AAP forms rising wedge, ERTS surges off support. INTU forms small triangle. Plus INTU,M,MMM,PBR.
This commentary and charts-of-interest are designed to stimulate thinking. This analysis is not a recommendation to buy, sell, hold or sell short any security (stock ETF or otherwise). We all need to think...
READ MORE
MEMBERS ONLY
Channel Support Break in Egypt ETF Preceded Upheaval
by Arthur Hill,
Chief Technical Strategist, TrendInvestorPro.com
Last week's upheaval in Eqypt contributed to a sharp decline in US stocks on Friday. Even though the upheaval began early last week (Tuesday), the Egypt ETF (EGPT) gave fair warning with a support break a week earlier (January 18th). This looks like a classic case of the...
READ MORE
MEMBERS ONLY
Short-term Evidence Turns Bearish for Stocks
by Arthur Hill,
Chief Technical Strategist, TrendInvestorPro.com
After grinding higher for several weeks to keep the uptrend in place, stocks turned sharply lower on Friday and the bulk of the short-term evidence is now bearish. Media suggests that the turmoil in Egypt is the culprit for the sharp decline in stocks and the bounce in the Dollar,...
READ MORE
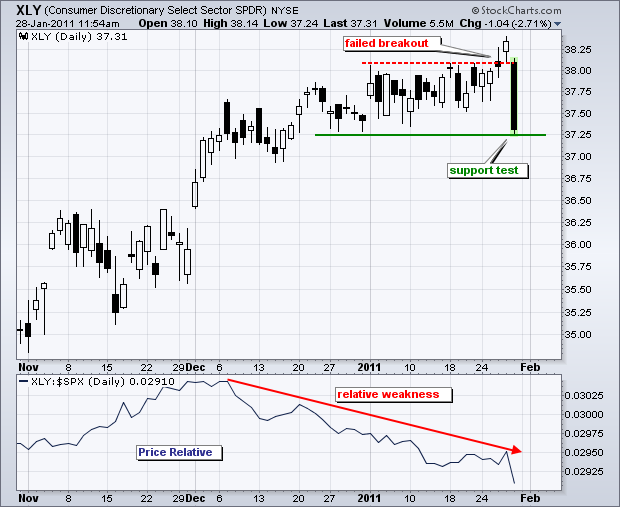
MEMBERS ONLY
Consumer Discretionary SDDR Fails to Hold Breakout
by Arthur Hill,
Chief Technical Strategist, TrendInvestorPro.com
The Consumer Discretionary SPDR (XLY) broke above consolidation resistance on Thursday, but failed to hold this breakout after a sharp decline early Friday. XLY formed a long black candlestick that pushed the ETF to its lowest level since late December. An important support test is at hand.
Click this image...
READ MORE
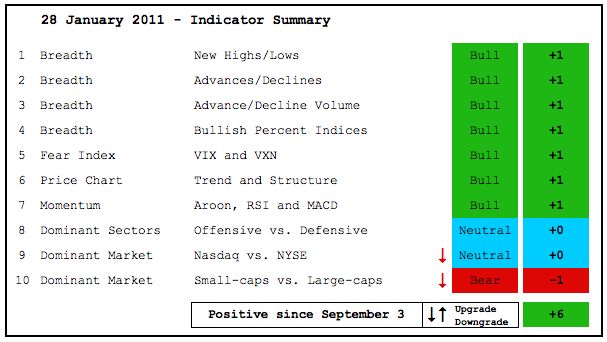
MEMBERS ONLY
Cracks Appearing in the Bullish Case
by Arthur Hill,
Chief Technical Strategist, TrendInvestorPro.com
The indicator summary remains positive, but cracks in the bullish case are starting to appear. It all started with relative weakness in small-caps and the consumer discretionary sector, two important areas of the market. This week we saw DIA, QQQQ and SPY eke out new 52-week highs, but MDY and...
READ MORE
MEMBERS ONLY
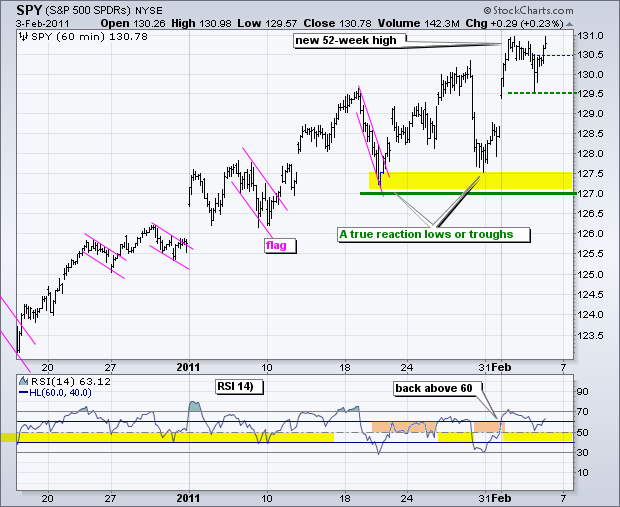
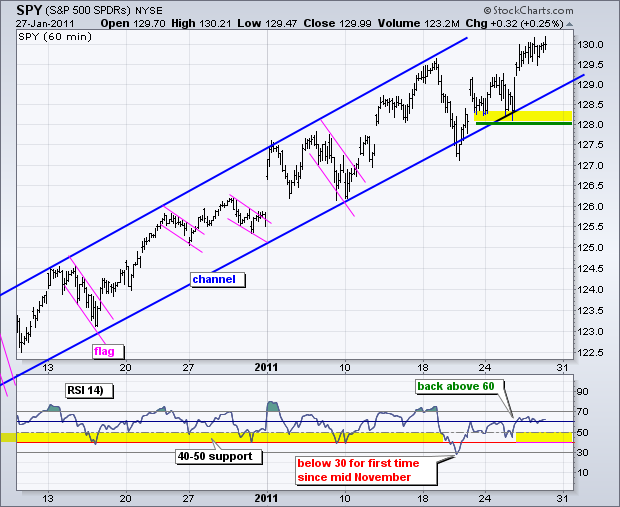
SPY Hits Another New 52-week High
by Arthur Hill,
Chief Technical Strategist, TrendInvestorPro.com
There is no change in the short-term trend or key indicators. Price-wise, the SPY trend is up as the ETF holds its rising price channel. Key support on the 60-minute chart remains at 128. A move below this level would reverse the current uptrend and call for a retracement of...
READ MORE
MEMBERS ONLY
Steel ETF Hits Resistance with Bearish Engulfing and Harami
by Arthur Hill,
Chief Technical Strategist, TrendInvestorPro.com
The Steel ETF (SLX) is running into stiff resistance just above 75 with a bearish engulfing two weeks ago and a potentially bearish harami today. After a gap and long white candlestick on Tuesday, the stock moved sharply lower today with a long black candlestick. Today's body (open-close)...
READ MORE
MEMBERS ONLY
Clint Eastwood Gives Advice to the Bears
by Arthur Hill,
Chief Technical Strategist, TrendInvestorPro.com
It is certainly tempting to pick a top and turn bearish now, but such thoughts bring me back to a quote from Dirty Harry. You've got to ask yourself one question: "Do I feel lucky?" Well, do ya punk bear? As noted before, sentiment is excessively...
READ MORE
MEMBERS ONLY
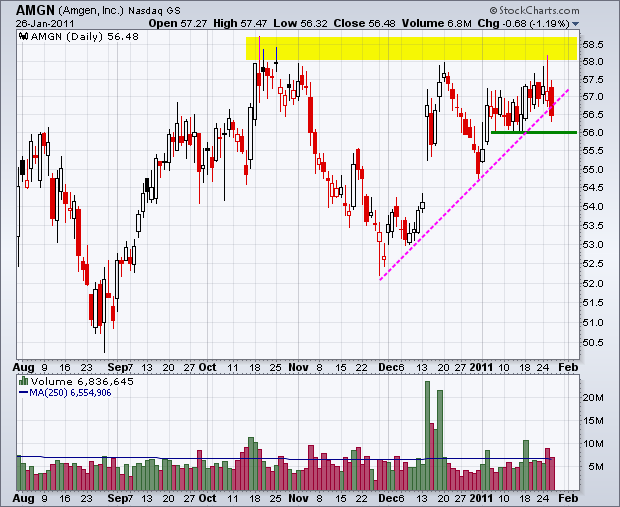
Charts of Interest: AMGN,BOOM, FLO,GME,LEAP,LOGI,WDC
by Arthur Hill,
Chief Technical Strategist, TrendInvestorPro.com
Don't forget that it is earnings season! AMGN falls after shooting star. BOOM forms bull flag. GMS hits resistance at gap. Plus FLO, LEAP, LOGI and WDC.
This commentary and charts-of-interest are designed to stimulate thinking. This analysis is not a recommendation to buy, sell, hold or sell...
READ MORE
MEMBERS ONLY
New Highs Still Outpacing New Lows
by Arthur Hill,
Chief Technical Strategist, TrendInvestorPro.com
From the pre-defined scans page, the number of new 52-week highs continues to outpace the number of new 52-week lows. This is true for the Nasdaq, NYSE, Amex, TSE and CDNX. The latter two are Canadian exchanges. New highs are a show of strength, not weakness.
Click this image for...
READ MORE
MEMBERS ONLY
SPY Stalls as Fed Announcement Looms
by Arthur Hill,
Chief Technical Strategist, TrendInvestorPro.com
Stocks have traded flat the last few days, but the fireworks could start soon. The State of the Union address is out of the way with no major surprises and the Fed makes its policy statement today. Fed days are dangerous because of their volatility, which usually kicks in around...
READ MORE
MEMBERS ONLY
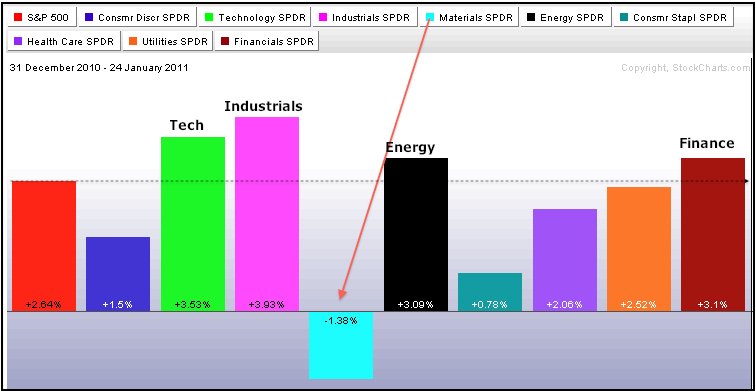
Materials Lag in 2011 as Industrials Lead
by Arthur Hill,
Chief Technical Strategist, TrendInvestorPro.com
The year-to-date sector scorecard shows the Basic Materials SPDR (XLB) lagging the S&P 500. Moreover, XLB is the only sector sporting a loss for 2011. The technology, industrials, energy and finance sectors show relative strength with gains greater than the S&P 500.
Click this image for...
READ MORE
MEMBERS ONLY
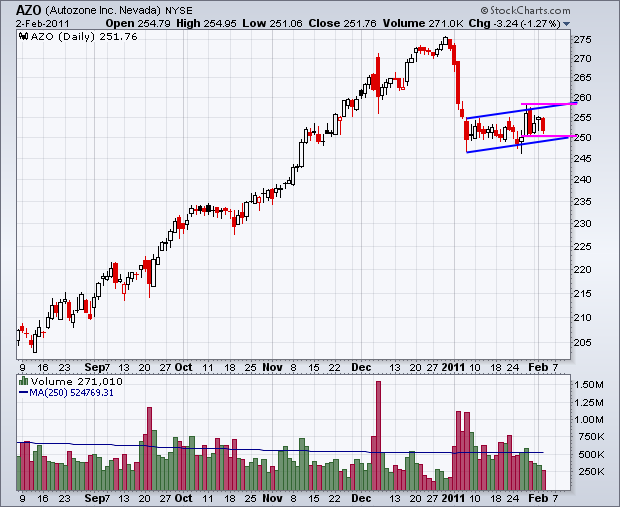
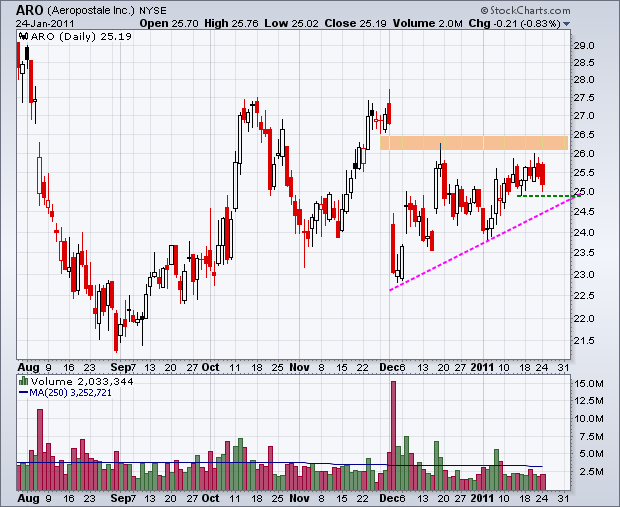
Charts of Interest: ARO, AZO, LLY, PFCB
by Arthur Hill,
Chief Technical Strategist, TrendInvestorPro.com
It's earnings season. Stocks reporting earnings are prone to higher volatility and risk. ARO backs off resistance, AZO forms tight consolidation. LLY firms on big volume. PFCM forms bear flag.
This commentary and charts-of-interest are designed to stimulate thinking. This analysis is not a recommendation to buy, sell,...
READ MORE
MEMBERS ONLY
Stocks Remain Buoyant as Sentiment Indicators Warn
by Arthur Hill,
Chief Technical Strategist, TrendInvestorPro.com
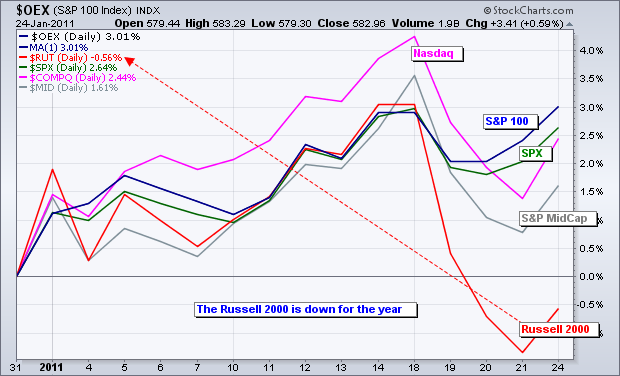
Stocks were broadly higher on Monday as the Dow Industrials zoomed to a new 52-week high. The Russell 2000, S&P 500 and Nasdaq 100 were also up on the day, but did not record new 52-week highs. The Dow is leading. The rest are lagging. I remain concerned...
READ MORE
MEMBERS ONLY
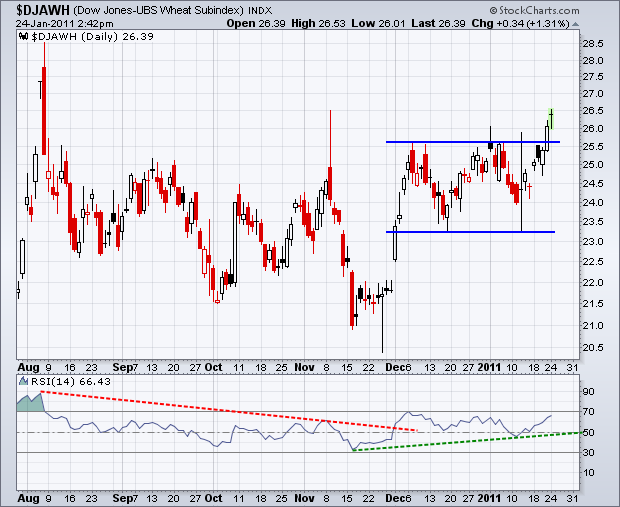
DJ Wheat Index Breaks Consolidation Resistance $DJAWH
by Arthur Hill,
Chief Technical Strategist, TrendInvestorPro.com
Grains are on the run with a breakout in the DJ-UBS Wheat Index ($DJAWH). The chart below shows the index surging in early December, consolidating for seven weeks and then breaking consolidation resistance the last few days. RSI broke its downtrend in early December and held the 40-50 support zone...
READ MORE
MEMBERS ONLY
SPY Heads into Big News Week with Breadth at a Crossroads
by Arthur Hill,
Chief Technical Strategist, TrendInvestorPro.com
It is a pretty big week news-wise. First, earnings season is in full swing with over 350 reports slated for this week (and next). Second, the Fed starts its two day meeting on Tuesday with its policy statement expected at 2:15PM on Wednesday. Third, there will be a smattering...
READ MORE
MEMBERS ONLY
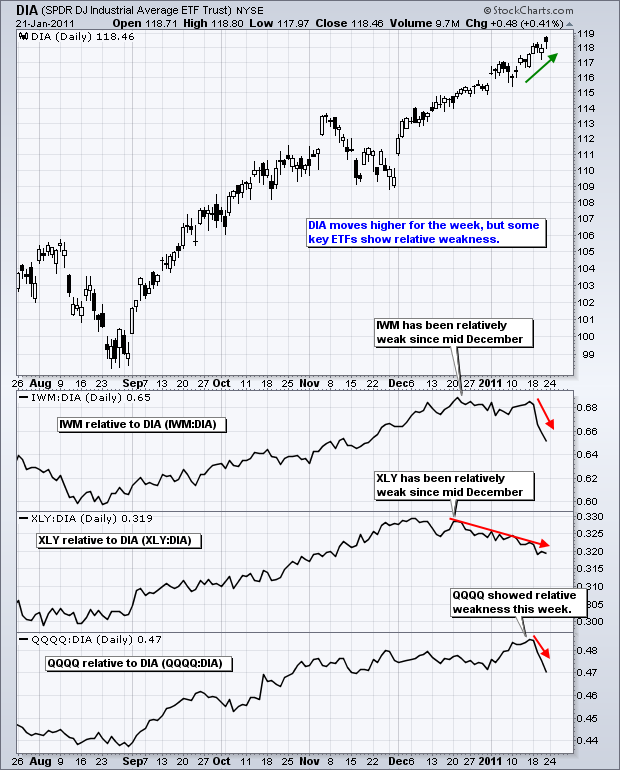
DIA MOVE TO NEW HIGH WITHOUT SUPPORT CAST
by Arthur Hill,
Chief Technical Strategist, TrendInvestorPro.com
The Dow Industrials SPDR (DIA) led the market this week with a new 52-week high on Friday. Not bad considering the Russell 2000 ETF (IWM) suffered its biggest weekly loss since early August. Overall, the up trends for the major index ETFs remain in place as they recorded new 52-week...
READ MORE
MEMBERS ONLY
IWM Tests Support as it Leads Market Lower
by Arthur Hill,
Chief Technical Strategist, TrendInvestorPro.com
The Russell 2000 ETF (IWM) led the major index ETFs lower this week with a decline to its January lows. The ETF is testing support from these lows and showing relative weakness. Notice the Price Relative in the lower window. This indicator turned sharply lower this week and broke the...
READ MORE
MEMBERS ONLY
Indicator Summary Remains Positive After Downgrades
by Arthur Hill,
Chief Technical Strategist, TrendInvestorPro.com
For the first time in many weeks, two indicator groups were downgraded in the indicator summary. Relative weakness in the Technology ETF (XLK) and Consumer Discretionary SPDR (XLY) caused me to downgrade offensive sector performance from bullish to neutral. The Industrials SPDR (XLI) and Finance SPDR (XLF) are still holding...
READ MORE
MEMBERS ONLY
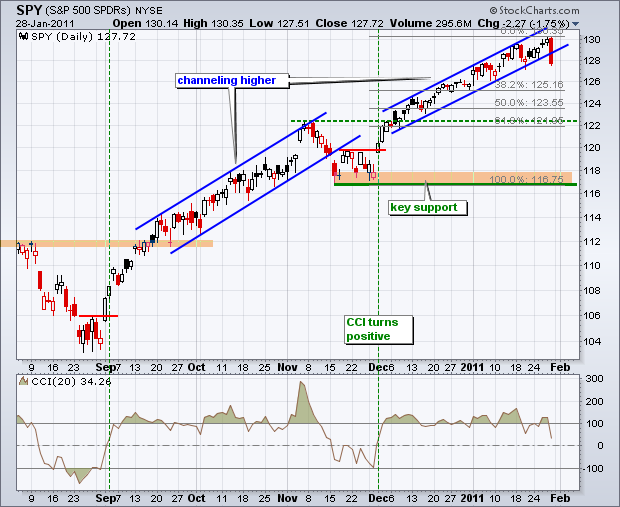
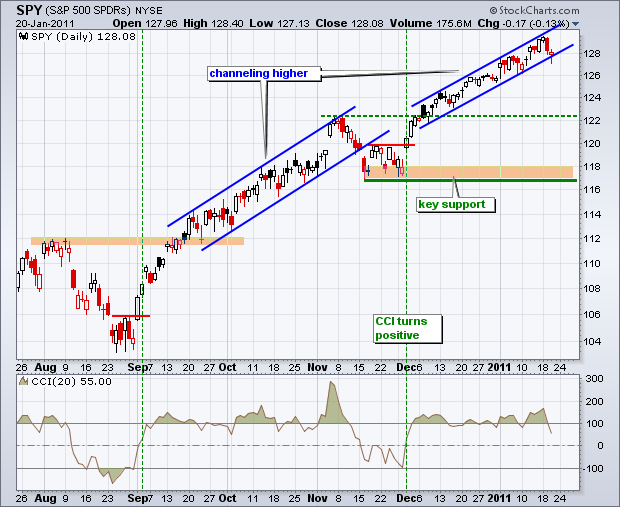
SPY Recovers after Channel Break as Breadth Weakens
by Arthur Hill,
Chief Technical Strategist, TrendInvestorPro.com
On the daily chart, SPY dipped below the lower trendline of the rising channel, but bounced to close back above the trendline. This channel covers the short-term uptrend. The medium-term uptrend is defined by bigger events, namely the break above the November high. This resistance break becomes the first support...
READ MORE