MEMBERS ONLY
IDENTIFYING SPY SUPPORTS WITH INTRADAY P&F CHARTS
by Arthur Hill,
Chief Technical Strategist, TrendInvestorPro.com
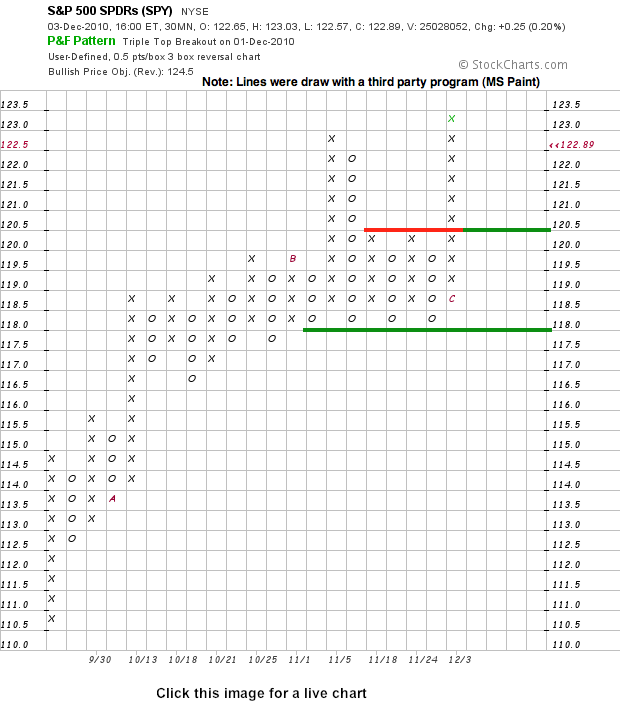
Point & Figure produce straight-forward charts that focus exclusively on price action. Columns of X's appear during an advance. Columns of O's appear during a decline. Nothing appears when prices are flat or move less than the box size or reversal amount. Point & Figure charts...
READ MORE
MEMBERS ONLY
Echostar Hits the P&F Triple Top Breakout Scan $SATS
by Arthur Hill,
Chief Technical Strategist, TrendInvestorPro.com
The Nasdaq Point & Figure Triple Top Breakout scan featured over 200 stocks on Friday morning. The chart below shows Echostar (SATS) breaking resistance marked by five columns of X's, which previous reversed at 22. This breakout is P&F bullish with a price objective (PO) of...
READ MORE
MEMBERS ONLY
Positive Indicator Summary Hits Three Month Mark
by Arthur Hill,
Chief Technical Strategist, TrendInvestorPro.com
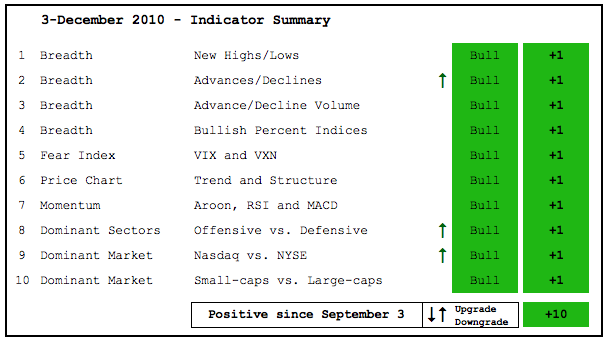
Today marks three full months that the indicator summary has been positive. After some whipsaws in the summer, this table turned positive on September 3rd and remains positive. Some signs of weakness appeared in November, but these were erased with this week's surge and breakout. Small-caps and mid-caps...
READ MORE
MEMBERS ONLY
SPY Extends on Breakout as Finance Leads the Market
by Arthur Hill,
Chief Technical Strategist, TrendInvestorPro.com
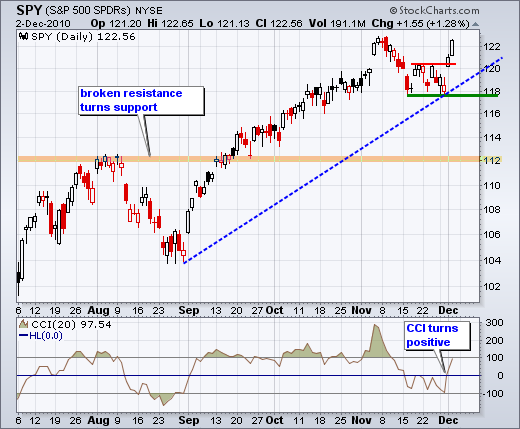
There is no change on the daily or 60-minute charts. SPY built on its breakout with a 1.28% gains. Perhaps more importantly, the finance sector led the way with a huge move. Megabanks, regional banks and brokers led the way. On the daily chart, SPY held support around 118...
READ MORE
MEMBERS ONLY
Finance Sees Green in Sector Carpet
by Arthur Hill,
Chief Technical Strategist, TrendInvestorPro.com
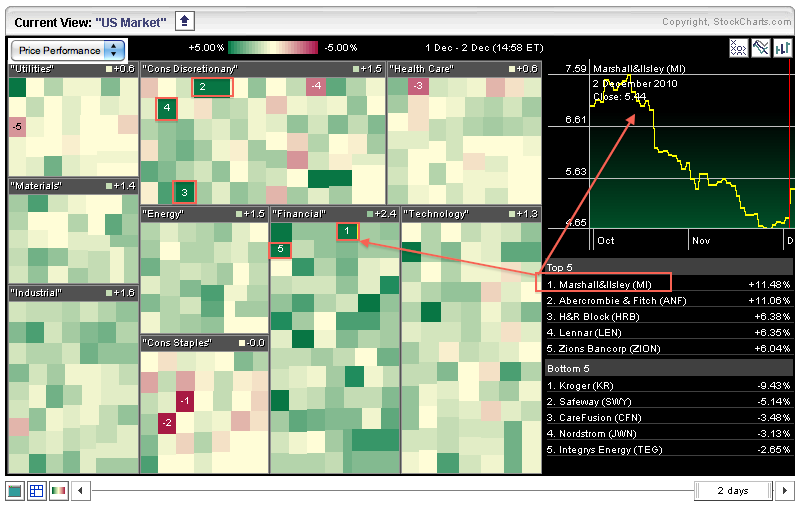
The finance sector sprang to life on Thursday with a sea of green squares filling its portion of the Sector Carpet. M&I Corp (MI) is the top performer with an 11+ percent gain. Click a square to see the corresponding chart in the upper right.
Click this image...
READ MORE
MEMBERS ONLY
SPY Breaks Resistance as Breadth Turns Bullish
by Arthur Hill,
Chief Technical Strategist, TrendInvestorPro.com
A little bounce in the Euro, some positive economic news and bullish seasonal patterns pushed stocks sharply higher on Wednesday. Historically, December is the second strongest month of the year for stocks. This historic tendency got off to a good start with yesterday's big surge. This is interesting...
READ MORE
MEMBERS ONLY
Charts: ETFC, GE, MCK, PEP, PMCS, SYK, V, WY
by Arthur Hill,
Chief Technical Strategist, TrendInvestorPro.com
$EFTC forms cup-with-handle. $GE bounces of key retracement zone. $PMCS surges off support with good volume. Plus $MCK, $PEP, $SYK, $V, $WY.
-----------------------------------------------------------------------------
This commentary and charts-of-interest are designed to stimulate thinking. This analysis is not a recommendation to buy, sell, hold or sell short any security (stock ETF or...
READ MORE
MEMBERS ONLY
Russell 2000 Challenges April High and Leads the Market
by Arthur Hill,
Chief Technical Strategist, TrendInvestorPro.com
The Russell 2000 ($RUT) and small-caps are leading the market higher. The index is the first of the major indices to break above its November high. With today's move above 740, the index is also challenging its April high. Notice that CCI turned positive with the 18-Nov gap...
READ MORE
MEMBERS ONLY
Bulls Refuse to Buckle as SPY Holds Support
by Arthur Hill,
Chief Technical Strategist, TrendInvestorPro.com
It is as if the under-invested fund managers can smell the yearend. SPY gapped down and moved below 118 yet again on Tuesday, but the bulls pushed the ETF back above 119 in the afternoon. Even though SPY managed to fill the gap, it did not break above yesterday'...
READ MORE
MEMBERS ONLY
ATVI Forms Triangle Above Broken Resistance
by Arthur Hill,
Chief Technical Strategist, TrendInvestorPro.com
After a breakout in early November, Activision (ATVI) consolidated with a triangle over the last few weeks. The consolidation slowly narrowed with the stocks trading between 11.45 and 11.86 the last nine days. A break from this range will trigger the next signal.
Click this image for a...
READ MORE
MEMBERS ONLY
Lots of Gaps, but Little Progress for SPY
by Arthur Hill,
Chief Technical Strategist, TrendInvestorPro.com
On the daily chart, SPY broke channel support with a gap down in mid November and this break is holding. This short-term support break started a short-term downtrend that is considered a correction within the bigger uptrend. As far as downside targets, we can draw a falling price channel and...
READ MORE
MEMBERS ONLY
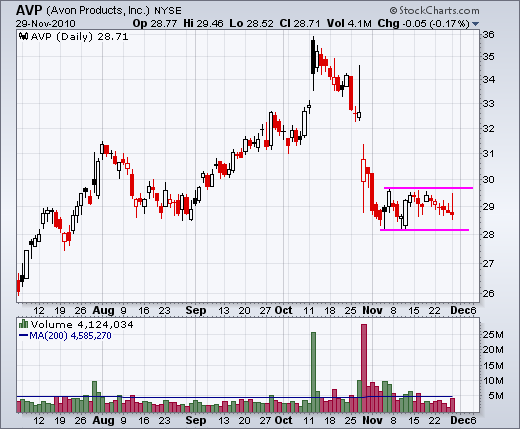
Charts: AVP, BBY, BXP, FAST, ITW, SPG, WM, X
by Arthur Hill,
Chief Technical Strategist, TrendInvestorPro.com
AVP consolidates after sharp decline. BBY gaps down. FAST breaks triangle resistance. Plus BXP, ITW, SPG, WM, X
-----------------------------------------------------------------------------
This commentary and charts-of-interest are designed to stimulate thinking. This analysis is not a recommendation to buy, sell, hold or sell short any security (stock ETF or otherwise). We all need...
READ MORE
MEMBERS ONLY
Aroon Turns Negative as XLI Forms a Bear Flag
by Arthur Hill,
Chief Technical Strategist, TrendInvestorPro.com
The Industrials SPDR (XLI) bounced over the last two weeks, but the rise looks like a bearish flag. Also notice that the ETF formed a harami on Wednesday-Friday last week and the Aroon Oscillator turned negative for the first time since mid September. A break below 21 would signal a...
READ MORE
MEMBERS ONLY
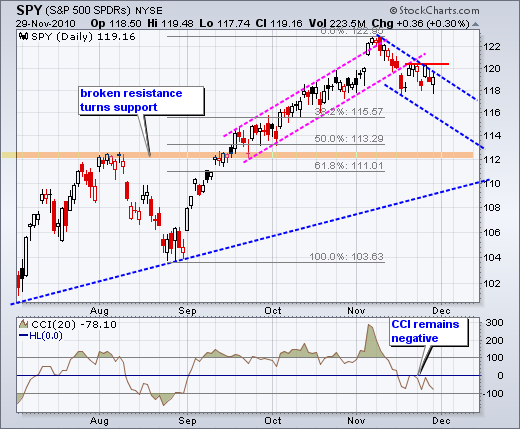
SPY Forms Triangle within Short-term Downtrend
by Arthur Hill,
Chief Technical Strategist, TrendInvestorPro.com
The S&P 500 ETF (SPY) remains in a short-term downtrend that is viewed as a correction within a bigger uptrend. Defining the length and the duration of this correction is an imprecise science. We can, however, set precise resistance levels to define the downtrend. This means the downtrend...
READ MORE
MEMBERS ONLY
Loonie Surges and Forges Higher Low
by Arthur Hill,
Chief Technical Strategist, TrendInvestorPro.com
The Canadian Dollar Index ($CDW) is showing strength with a higher low in November and big surge this week. Also called the "Loonie", the Canadian Dollar exceeded its summer highs in October and then consolidated several weeks. The overall trend here is up with the next resistance just...
READ MORE
MEMBERS ONLY
Stocks Bounce, but Euro Plunges and Yields Rise
by Arthur Hill,
Chief Technical Strategist, TrendInvestorPro.com
It is a strange situation. The anecdotal evidence favors the bears, but the stock market price action remains strong. The 10-year Treasury Yield ($TNX) surged back above 2.9% on Friday and the Euro/Dollar fell below 1.33. Rising yields and a weak Euro would normally be bearish for...
READ MORE
MEMBERS ONLY
Green Squares in the Market Carpet
by Arthur Hill,
Chief Technical Strategist, TrendInvestorPro.com
The market carpet shows a sea of red over the last two days, but there are a few green squares to be found. There are six in the consumer discretionary sector and five in the technology sector. Big Lots (BIG) is up over 5% and New York Times (NTY) is...
READ MORE
MEMBERS ONLY
SPY Firms After One Hour Of Weakness
by Arthur Hill,
Chief Technical Strategist, TrendInvestorPro.com
The bulk of the short-term evidence is bearish, but the medium-term evidence remains bullish. This means short-term weakness is viewed as a correction within a bigger uptrend. Keep in mind that this bigger uptrend holds the trump cards and these can be played at any time. There will most likely...
READ MORE
MEMBERS ONLY
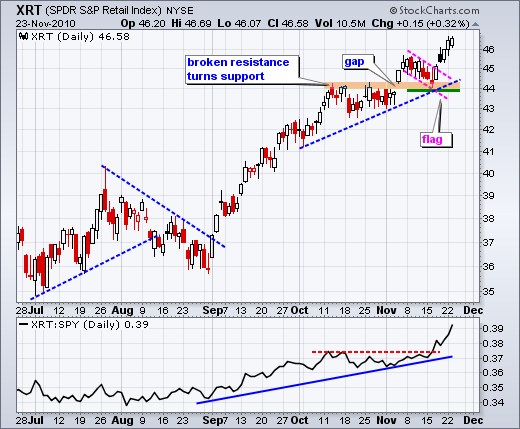
Retail SPDR Bucks the Decline
by Arthur Hill,
Chief Technical Strategist, TrendInvestorPro.com
Stocks moved sharply lower on Tuesday, but the Retail SPDR (XRT) bucked the trend and closed with small gain. The chart below shows XRT breaking flag resistance with a gap up four day ago and closing higher the last five days. ALso notice that the price relative recorded a 52-week...
READ MORE
MEMBERS ONLY
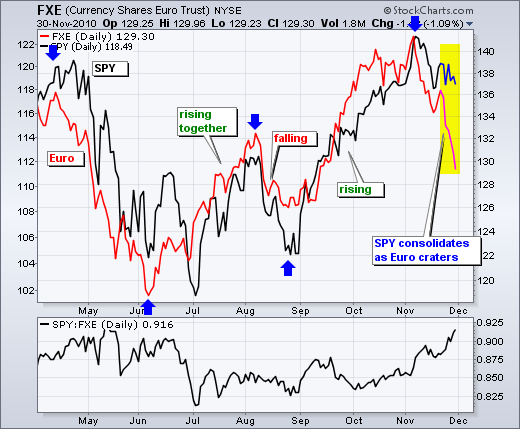
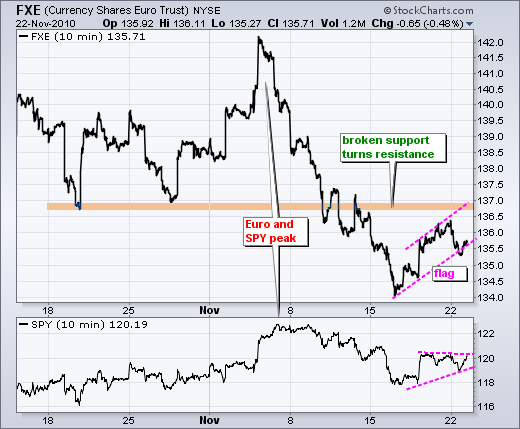
SPY Stalls As Euro Edges Lower
by Arthur Hill,
Chief Technical Strategist, TrendInvestorPro.com
Despite the Irish bank bailout, the Euro declined on Monday and was down in overnight trading on Tuesday. Stocks and the Euro have been positively correlated since April as the Euro pretty much defines the risk on-off trade. Strength in the Euro favors the risk-on trade and stocks. Weakness in...
READ MORE
MEMBERS ONLY
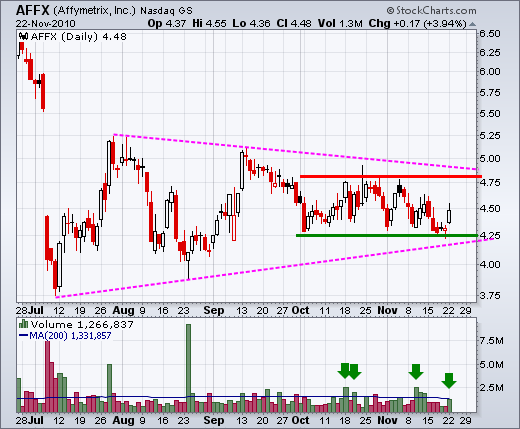
Charts: AFFX, AMAT, CL, MDT, MMM, MSFT, PPDI
by Arthur Hill,
Chief Technical Strategist, TrendInvestorPro.com
AMAT forms falling flag. MDT firms at key retracement. MSFT finds support near broken resistance. Plus AFFX, CL, MMM, PPDI.
-----------------------------------------------------------------------------
This commentary and charts-of-interest are designed to stimulate thinking. This analysis is not a recommendation to buy, sell, hold or sell short any security (stock ETF or otherwise). We...
READ MORE
MEMBERS ONLY
Ireland Stock Index Fails at Resistance
by Arthur Hill,
Chief Technical Strategist, TrendInvestorPro.com
Irish stocks surged to resistance last week, but got cold feet on Monday and reversed course after today's bailout news. The chart below shows the Dow Jones Ireland Index ($IEDOW), which is updated throughout the day. The index broke above its Sep-Oct highs on Friday, but reneged on...
READ MORE
MEMBERS ONLY
XLF Fails to Hold Breakout and Shows Relative Weakness
by Arthur Hill,
Chief Technical Strategist, TrendInvestorPro.com
The Finance SPDR (XLF) is leading the market lower on Monday as European debt concerns weigh. XLF broke resistance at 15 in early November, but failed to hold this breakout with a move back below 15. After a feeble bounce last week, 15 has become resistance once gain. The indicator...
READ MORE
MEMBERS ONLY
SPY Holds the Gap and Breaks Short-Term Trendline
by Arthur Hill,
Chief Technical Strategist, TrendInvestorPro.com
Ireland accepted an aid package and the Euro is getting a bounce this morning. It is not a huge bounce though. Euro strength could give US equities a lift as we head into Thanksgiving. It is a shortened week with three full trading days (Mon-Tue-Wed) and a short day on...
READ MORE
MEMBERS ONLY
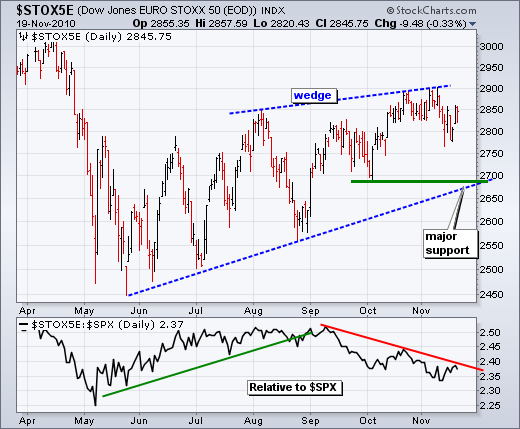
EURO STOXX 50 INDEX HOLDS UP IN THE FACE OF ADVERSITY
by Arthur Hill,
Chief Technical Strategist, TrendInvestorPro.com
Despite weakness in the Euro and European debt concerns, we have yet to see significant weakness or a breakdown in the DJ Euro Stoxx 50 ($STOX5E). This index is the Dow Industrials of Europe. There are 50 stocks representing 9 countries and 18 industry groups. French and German stocks dominate...
READ MORE
MEMBERS ONLY
52-week Highs Bounce Back
by Arthur Hill,
Chief Technical Strategist, TrendInvestorPro.com
After dipping earlier in the week, Nasdaq and NYSE 52-week highs bounced back with a surge on Thursday. A list of these market leading stocks is posted every day on the pre-defined scans page. There were 75 new highs on the Nasdaq and 91 on the NYSE. You can also...
READ MORE
MEMBERS ONLY
Indicator Summary Remains Positive after Market Setback
by Arthur Hill,
Chief Technical Strategist, TrendInvestorPro.com
Even with a rather sharp setback the last two weeks, the indicator summary remains positive. Some indicators were on a verge of a change, but Thursday's rebound in the stock market kept them in bull mode. In particular, the volatility indices were on the verge of resistance breakouts...
READ MORE
MEMBERS ONLY
SPY Hits First Short-term Resistance Level
by Arthur Hill,
Chief Technical Strategist, TrendInvestorPro.com
The Euro got an oversold bounce and bonds moved lower. Stocks also got an oversold bounce, but did not do much after the opening gap. SPY broke channel support with a gap down and long red candlestick on Tuesday. The ETF was oversold after this decline and firmed with a...
READ MORE
MEMBERS ONLY
The First Trendline and Resistance for GM
by Arthur Hill,
Chief Technical Strategist, TrendInvestorPro.com
Even though there is not any real historical data for GM, keen chartists can start with the 1-minute and 5-minute charts for the first technical signals. On the 5-min chart, GM is clearly in a downtrend as it trades below the trendline extending down from 10:45AM. This trendline and...
READ MORE
MEMBERS ONLY
SPY Firms After Becoming Oversold
by Arthur Hill,
Chief Technical Strategist, TrendInvestorPro.com
Before hitting the charts, note that EU and IMF officials flew into Dublin (Ireland) today in an effort to convince Irish officials to accept a bailout. The Euro is quite oversold after a sharp decline from 142 to 134 (4.2%) and ripe for a bounce that could retrace a...
READ MORE
MEMBERS ONLY
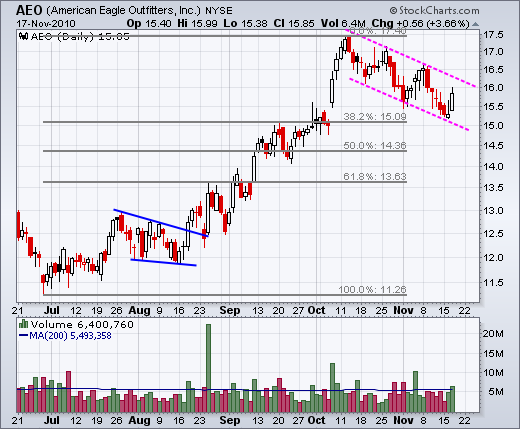
Charts: AEO, CHS, CX, EK, MMM, SEE
by Arthur Hill,
Chief Technical Strategist, TrendInvestorPro.com
AEO Forms Falling Flag. CHS Gaps above Triangle Resistance. MMM Firms at Key Retracement. Plus CX, EK, SEE
-----------------------------------------------------------------------------
This commentary and charts-of-interest are designed to stimulate thinking. This analysis is not a recommendation to buy, sell, hold or sell short any security (stock ETF or otherwise). We all need...
READ MORE
MEMBERS ONLY
IWM Traces Out an Island Reversal
by Arthur Hill,
Chief Technical Strategist, TrendInvestorPro.com
With a gap up, consolidation and gap down over the last two weeks, the Russell 2000 ETF (IWM) forged an island reversal. Notice that there were no trades around 71.8 with the gap up and no trades at this level with the gap down. IWM needs to fill the...
READ MORE
MEMBERS ONLY
The Straws that Broke the Bull's Back
by Arthur Hill,
Chief Technical Strategist, TrendInvestorPro.com
With a sharp decline on Tuesday, the bulk of the short-term evidence has turned bearish. First, three of the four short-term breadth indicators moved into bear mode. These were featured in Monday's commentary. Second, RSI on the 60-minute chart broke below 40 last week and CCI on the...
READ MORE
MEMBERS ONLY
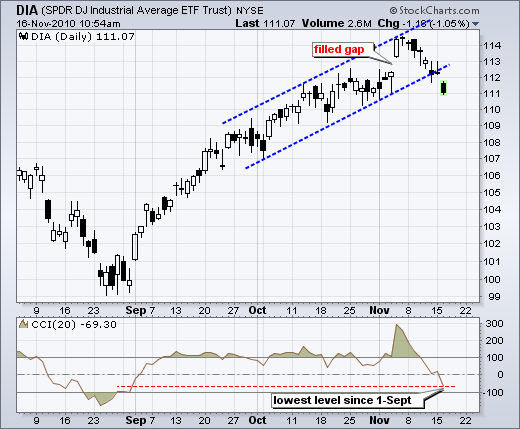
DIA Breaks Channel Trendline as Momentum Turns Negative
by Arthur Hill,
Chief Technical Strategist, TrendInvestorPro.com
With a sharp decline the last eight days, the Dow Industrials SPDR (DIA) filled the early November gap and broke the channel trendline. Also notice that the Commodity Channel Index (CCI) moved to its lowest level since September 1st. The combination indicates a corrective period unfolding.
Click this image for...
READ MORE
MEMBERS ONLY
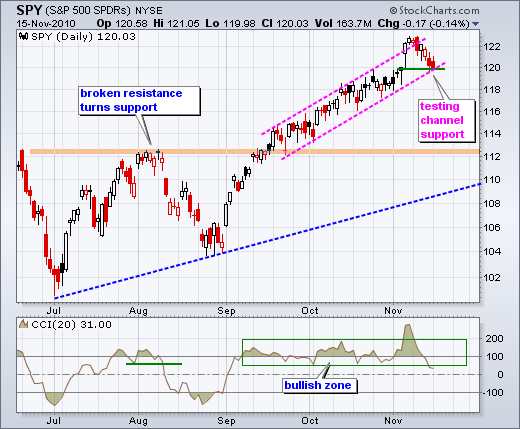
SPY Forms Bullish Flag That Hits Support
by Arthur Hill,
Chief Technical Strategist, TrendInvestorPro.com
The Euro and US Treasuries were hit again on Monday, but both are getting short-term oversold and ripe for a bounce. Even an oversold bounce in these two could provide a boost for stocks. On the daily chart, SPY is trading near the lower trendline of the rising price channel,...
READ MORE
MEMBERS ONLY
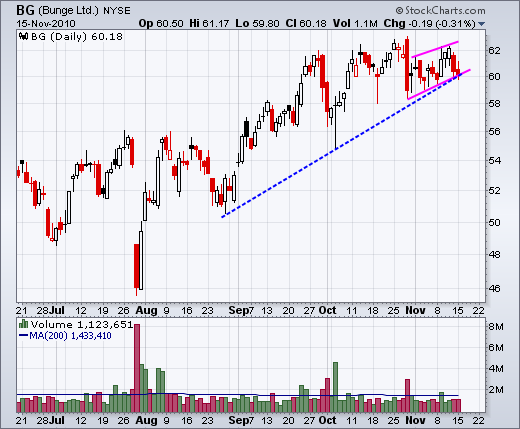
Charts: BG, DTV, HD, LOW, MOT, NUE
by Arthur Hill,
Chief Technical Strategist, TrendInvestorPro.com
$HD and $LOW Show Relative Weakness. $DTV Forms Bear Flag. $NUE Fails at Resistance. Plus $BG and $MOT
This commentary and charts-of-interest are designed to stimulate thinking. This analysis is not a recommendation to buy, sell, hold or sell short any security (stock ETF or otherwise). We all need to...
READ MORE
MEMBERS ONLY
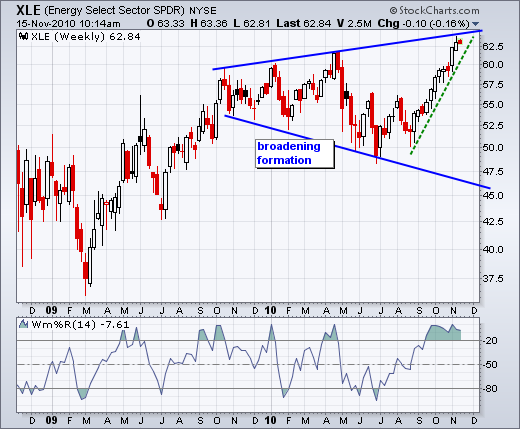
XLE Nears Upper Trendline of Broadening Formation
by Arthur Hill,
Chief Technical Strategist, TrendInvestorPro.com
With a 10+ percent advance the last 11-12 weeks, the Energy SPDR (XLE) is trading near the upper trendline of a broadening formation. The swing within this formation is up as XLE remains above the green trendline and Williams %R remains in overbought territory. A trendline break and move below...
READ MORE
MEMBERS ONLY
RSI for SPY Breaks Bull Zone Support
by Arthur Hill,
Chief Technical Strategist, TrendInvestorPro.com
The Euro and US Treasuries are moving lower, which means the Dollar and US interest rates are moving higher. With these negatives weighing on the stock market, SPY declined around 2% last week. This was the biggest weekly decline since early August. On the daily chart, the ETF fell to...
READ MORE
MEMBERS ONLY
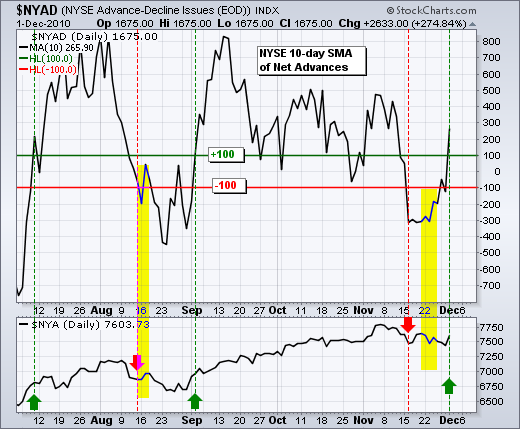
A Review of Short-term Breadth Indicators
by Arthur Hill,
Chief Technical Strategist, TrendInvestorPro.com
Breadth took a hit last week, but my short-term breadth indicators have yet to turn bearish. The next four charts show the 10-day SMA for Net Advances and Net Advancing Volume for the Nasdaq and NYSE. These indicators oscillate above/below the zero line. However, I add a buffer by...
READ MORE
MEMBERS ONLY
Ichimoku Cloud Remains Bullish for $XLK
by Arthur Hill,
Chief Technical Strategist, TrendInvestorPro.com
The Technology ETF (XLK) remains in bull mode as it trades above a green cloud and the Tenkan-sen (Conversion Line) holds above the Kijun-sen (Base Line). The Tenkan -sen (blue) is the average of the 9-day high-low range. The Kijun-sen (red) is the average of the 26-day high-low range. The...
READ MORE