MEMBERS ONLY
Ireland Stock Index Fails at Resistance
by Arthur Hill,
Chief Technical Strategist, TrendInvestorPro.com
Irish stocks surged to resistance last week, but got cold feet on Monday and reversed course after today's bailout news. The chart below shows the Dow Jones Ireland Index ($IEDOW), which is updated throughout the day. The index broke above its Sep-Oct highs on Friday, but reneged...
READ MORE
MEMBERS ONLY
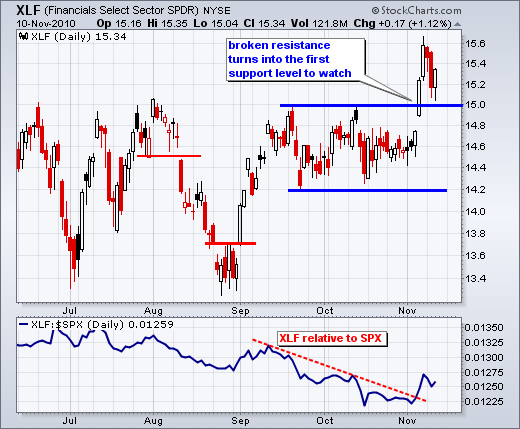
XLF Fails to Hold Breakout and Shows Relative Weakness
by Arthur Hill,
Chief Technical Strategist, TrendInvestorPro.com
The Finance SPDR (XLF) is leading the market lower on Monday as European debt concerns weigh. XLF broke resistance at 15 in early November, but failed to hold this breakout with a move back below 15. After a feeble bounce last week, 15 has become resistance once gain. The indicator...
READ MORE
MEMBERS ONLY
SPY Holds the Gap and Breaks Short-Term Trendline
by Arthur Hill,
Chief Technical Strategist, TrendInvestorPro.com
Ireland accepted an aid package and the Euro is getting a bounce this morning. It is not a huge bounce though. Euro strength could give US equities a lift as we head into Thanksgiving. It is a shortened week with three full trading days (Mon-Tue-Wed) and a short...
READ MORE
MEMBERS ONLY
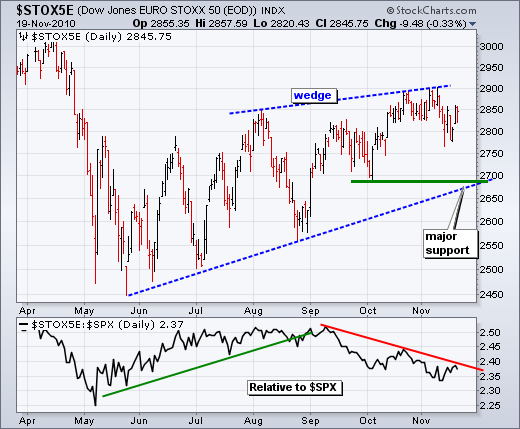
EURO STOXX 50 INDEX HOLDS UP IN THE FACE OF ADVERSITY
by Arthur Hill,
Chief Technical Strategist, TrendInvestorPro.com
Despite weakness in the Euro and European debt concerns, we have yet to see significant weakness or a breakdown in the DJ Euro Stoxx 50 ($STOX5E). This index is the Dow Industrials of Europe. There are 50 stocks representing 9 countries and 18 industry groups. French and German stocks dominate...
READ MORE
MEMBERS ONLY
52-week Highs Bounce Back
by Arthur Hill,
Chief Technical Strategist, TrendInvestorPro.com
After dipping earlier in the week, Nasdaq and NYSE 52-week highs bounced back with a surge on Thursday. A list of these market leading stocks is posted every day on the pre-defined scans page. There were 75 new highs on the Nasdaq and 91 on the NYSE. You...
READ MORE
MEMBERS ONLY
Indicator Summary Remains Positive after Market Setback
by Arthur Hill,
Chief Technical Strategist, TrendInvestorPro.com
Even with a rather sharp setback the last two weeks, the indicator summary remains positive. Some indicators were on a verge of a change, but Thursday's rebound in the stock market kept them in bull mode. In particular, the volatility indices were on the verge of resistance breakouts...
READ MORE
MEMBERS ONLY
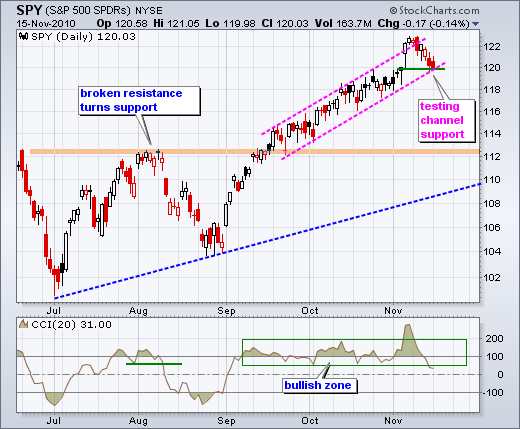
SPY Hits First Short-term Resistance Level
by Arthur Hill,
Chief Technical Strategist, TrendInvestorPro.com
The Euro got an oversold bounce and bonds moved lower. Stocks also got an oversold bounce, but did not do much after the opening gap. SPY broke channel support with a gap down and long red candlestick on Tuesday. The ETF was oversold after this decline and firmed with a...
READ MORE
MEMBERS ONLY
The First Trendline and Resistance for GM
by Arthur Hill,
Chief Technical Strategist, TrendInvestorPro.com
Even though there is not any real historical data for GM, keen chartists can start with the 1-minute and 5-minute charts for the first technical signals. On the 5-min chart, GM is clearly in a downtrend as it trades below the trendline extending down from 10:45AM....
READ MORE
MEMBERS ONLY
SPY Firms After Becoming Oversold
by Arthur Hill,
Chief Technical Strategist, TrendInvestorPro.com
Before hitting the charts, note that EU and IMF officials flew into Dublin (Ireland) today in an effort to convince Irish officials to accept a bailout. The Euro is quite oversold after a sharp decline from 142 to 134 (4.2%) and ripe for a bounce that could retrace a...
READ MORE
MEMBERS ONLY
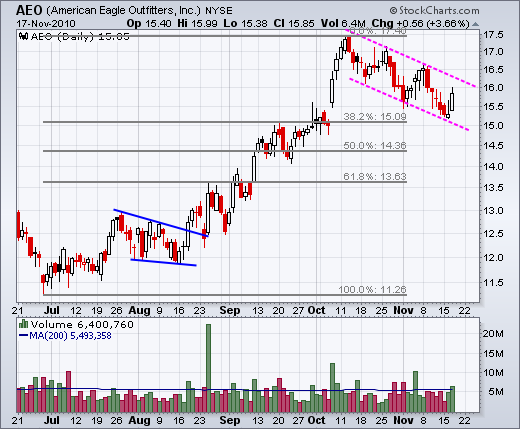
Charts: AEO, CHS, CX, EK, MMM, SEE
by Arthur Hill,
Chief Technical Strategist, TrendInvestorPro.com
AEO Forms Falling Flag. CHS Gaps above Triangle Resistance. MMM Firms at Key Retracement. Plus CX, EK, SEE
-----------------------------------------------------------------------------
This commentary and charts-of-interest are designed to stimulate thinking. This analysis is not a recommendation to buy, sell, hold or sell short any security (stock ETF or otherwise). We all...
READ MORE
MEMBERS ONLY
IWM Traces Out an Island Reversal
by Arthur Hill,
Chief Technical Strategist, TrendInvestorPro.com
With a gap up, consolidation and gap down over the last two weeks, the Russell 2000 ETF (IWM) forged an island reversal. Notice that there were no trades around 71.8 with the gap up and no trades at this level with the gap down. IWM needs to fill the...
READ MORE
MEMBERS ONLY
The Straws that Broke the Bull's Back
by Arthur Hill,
Chief Technical Strategist, TrendInvestorPro.com
With a sharp decline on Tuesday, the bulk of the short-term evidence has turned bearish. First, three of the four short-term breadth indicators moved into bear mode. These were featured in Monday's commentary. Second, RSI on the 60-minute chart broke below 40 last week and...
READ MORE
MEMBERS ONLY
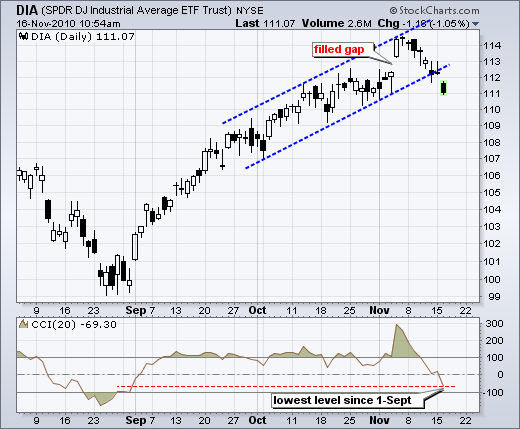
DIA Breaks Channel Trendline as Momentum Turns Negative
by Arthur Hill,
Chief Technical Strategist, TrendInvestorPro.com
With a sharp decline the last eight days, the Dow Industrials SPDR (DIA) filled the early November gap and broke the channel trendline. Also notice that the Commodity Channel Index (CCI) moved to its lowest level since September 1st. The combination indicates a corrective period unfolding.
Click this image for...
READ MORE
MEMBERS ONLY
SPY Forms Bullish Flag That Hits Support
by Arthur Hill,
Chief Technical Strategist, TrendInvestorPro.com
The Euro and US Treasuries were hit again on Monday, but both are getting short-term oversold and ripe for a bounce. Even an oversold bounce in these two could provide a boost for stocks. On the daily chart, SPY is trading near the lower trendline of the rising price...
READ MORE
MEMBERS ONLY
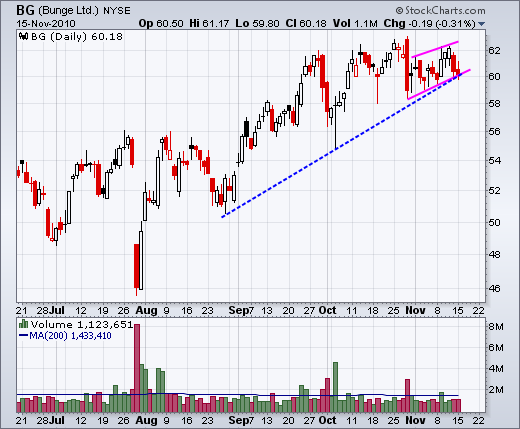
Charts: BG, DTV, HD, LOW, MOT, NUE
by Arthur Hill,
Chief Technical Strategist, TrendInvestorPro.com
$HD and $LOW Show Relative Weakness. $DTV Forms Bear Flag. $NUE Fails at Resistance. Plus $BG and $MOT
This commentary and charts-of-interest are designed to stimulate thinking. This analysis is not a recommendation to buy, sell, hold or sell short any security (stock ETF or otherwise). We all...
READ MORE
MEMBERS ONLY
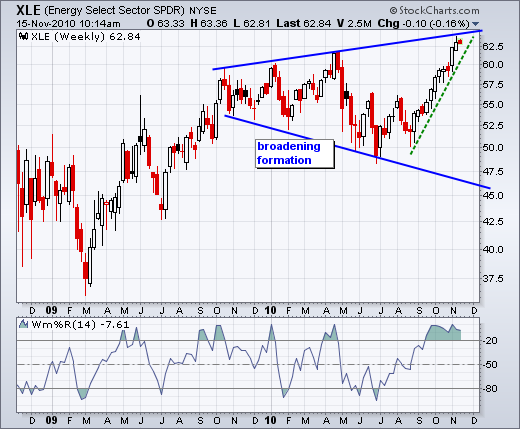
XLE Nears Upper Trendline of Broadening Formation
by Arthur Hill,
Chief Technical Strategist, TrendInvestorPro.com
With a 10+ percent advance the last 11-12 weeks, the Energy SPDR (XLE) is trading near the upper trendline of a broadening formation. The swing within this formation is up as XLE remains above the green trendline and Williams %R remains in overbought territory. A trendline break and move...
READ MORE
MEMBERS ONLY
RSI for SPY Breaks Bull Zone Support
by Arthur Hill,
Chief Technical Strategist, TrendInvestorPro.com
The Euro and US Treasuries are moving lower, which means the Dollar and US interest rates are moving higher. With these negatives weighing on the stock market, SPY declined around 2% last week. This was the biggest weekly decline since early August. On the daily chart, the ETF fell to...
READ MORE
MEMBERS ONLY
A Review of Short-term Breadth Indicators
by Arthur Hill,
Chief Technical Strategist, TrendInvestorPro.com
Breadth took a hit last week, but my short-term breadth indicators have yet to turn bearish. The next four charts show the 10-day SMA for Net Advances and Net Advancing Volume for the Nasdaq and NYSE. These indicators oscillate above/below the zero line. However, I add a...
READ MORE
MEMBERS ONLY
Ichimoku Cloud Remains Bullish for $XLK
by Arthur Hill,
Chief Technical Strategist, TrendInvestorPro.com
The Technology ETF (XLK) remains in bull mode as it trades above a green cloud and the Tenkan-sen (Conversion Line) holds above the Kijun-sen (Base Line). The Tenkan -sen (blue) is the average of the 9-day high-low range. The Kijun-sen (red) is the average of...
READ MORE
MEMBERS ONLY
Nasdaq Weakness Weighs on the Indicator Summary
by Arthur Hill,
Chief Technical Strategist, TrendInvestorPro.com
The indicator summary remains firmly positive, but weakness in the technology and industrials sectors caused me to downgrade two of the ten indicators. These downgrades were simply from bullish to neutral. A few days of weakness is not enough to change the overall picture. The market remains in bull mode,...
READ MORE
MEMBERS ONLY
XLF Tests Resistance Breakout with Pullback
by Arthur Hill,
Chief Technical Strategist, TrendInvestorPro.com
The Finance SPDR (XLF) broke resistance with a big surge last week and broken resistance now turns into the first level to watch for support. This is a basic tenet of technical analysis (broken resistance/support turns into support/resistance).
Click this image for a live chart...
READ MORE
MEMBERS ONLY
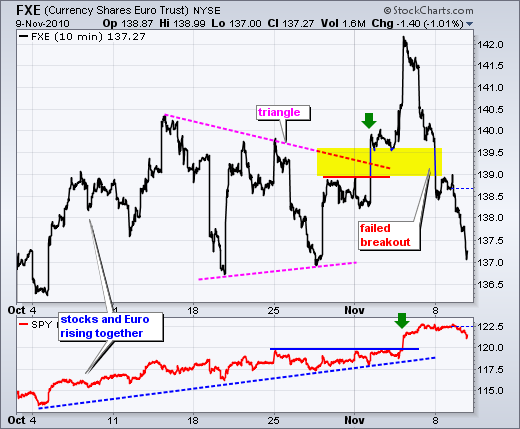
Stocks Hold Up Despite Euro Support Break
by Arthur Hill,
Chief Technical Strategist, TrendInvestorPro.com
After breaking triangle resistance at the beginning of November, the Euro Currency Trust (FXE) gave it all back and broke support from the late October lows. This reversal of fortune is quite amazing. Since the surge above 142 late last week, FXE has fallen over 4% in six trading days....
READ MORE
MEMBERS ONLY
Utilities Show Relative Weakness as Rates Start to Rise $XLU
by Arthur Hill,
Chief Technical Strategist, TrendInvestorPro.com
With 30-year Treasury yields moving higher, the interest rate sensitive utilities sector may start feeling the heat. In contrast to the S&P 500, the Utilities SPDR (XLU) peaked in October and formed a lower high in November. The price relative confirms weakness as it moved to a...
READ MORE
MEMBERS ONLY
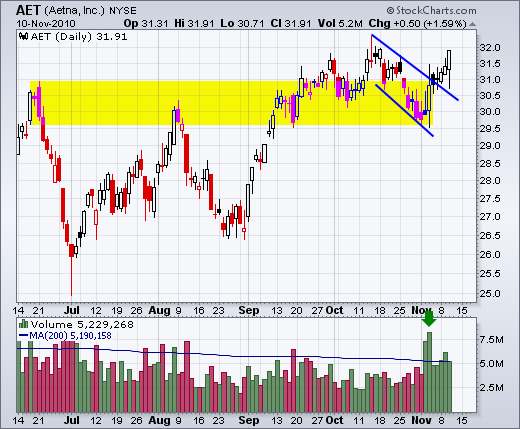
Charts: AET, AFFX, DELL, HD, PDCO, PRU
by Arthur Hill,
Chief Technical Strategist, TrendInvestorPro.com
Charts: AET, AFFX, DELL, HD, PDCO, PRU
-----------------------------------------------------------------------------
This commentary and charts-of-interest are designed to stimulate thinking. This analysis is not a recommendation to buy, sell, hold or sell short any security (stock ETF or otherwise). We all need to think for ourselves when it comes to trading our...
READ MORE
MEMBERS ONLY
SPY Recovers after Weak Open to Hold Channel Support
by Arthur Hill,
Chief Technical Strategist, TrendInvestorPro.com
SPY remains in an uptrend on the daily chart with a rising price channel over the last eight weeks. After surging above 122 last Thursday and then stalling for two days, the ETF formed a bearish engulfing pattern on Tuesday. However, there was no follow through as the ETF recouped...
READ MORE
MEMBERS ONLY
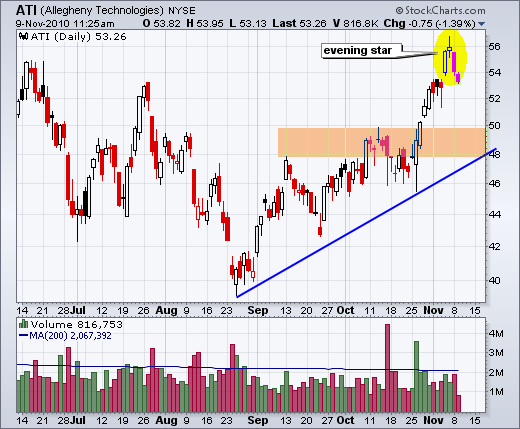
An evening star reversal for ATI plus 13 others on NYSE
by Arthur Hill,
Chief Technical Strategist, TrendInvestorPro.com
Allegheny Technologies (ATI) formed an evening star over the prior three days. This bearish reversal pattern consists of three candlesticks: a long white candlestick, a small body candlestick and a long red candlestick to complete the reversal. The predefined scans page showed 14 such patterns forming on the NYSE and...
READ MORE
MEMBERS ONLY
Bonds and Euro weigh on stocks
by Arthur Hill,
Chief Technical Strategist, TrendInvestorPro.com
It is always difficult to pick the exact cause of an advance or decline in stocks, but the positive correlation between the Euro and stocks has been quite strong this year. The Euro Currency Trust (FXE) extended its three day slide with a move below 137.5 on Tuesday. Actually,...
READ MORE
MEMBERS ONLY
Charts: BA, BG, CTXS, ERTS, GCI, HOLX, MON, SEE
by Arthur Hill,
Chief Technical Strategist, TrendInvestorPro.com
BA consolidates above breakout. BG forms pennant after engulfing. HOLX traces out a triangle. CTXS stalls near key retracement. ERTS surges off support with good volume. GCI gaps off support with good volume. MON forms harami cross at resistance. SEE forms rising wedge after sharp decline.
-----------------------------------------------------------------------------
This commentary and charts-...
READ MORE
MEMBERS ONLY
A year for hard assets
by Arthur Hill,
Chief Technical Strategist, TrendInvestorPro.com
2010 is going to be known as the year of the hard assets. The PerfChart below shows the S&P 500, Silver, Gold, Oil, the Dollar and the Euro. Stocks are up, but lagging the three commodities. Both the Euro Index and the Dollar Index are down for the...
READ MORE
MEMBERS ONLY
Stocks to be tested as Euro comes under pressure
by Arthur Hill,
Chief Technical Strategist, TrendInvestorPro.com
With the Euro taking a big hit on Friday-Monday, bullish resolve in the stock market will be tested right off the bat this week. The Dollar strengthened for three reasons. First, the employment report showed strong job creation, which is positive for the economy and puts upward pressure on...
READ MORE
MEMBERS ONLY
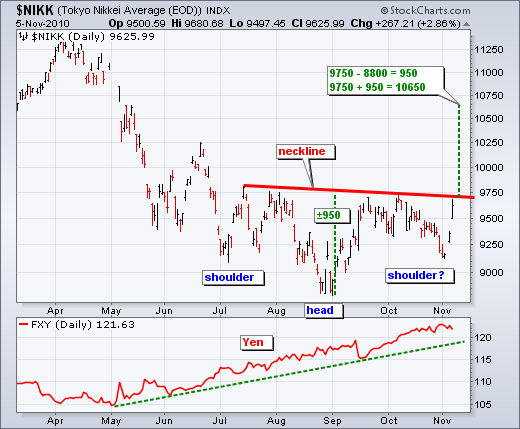
NIKKEI 225 FORGES INVERSE HEAD-AND-SHOULDERS
by Arthur Hill,
Chief Technical Strategist, TrendInvestorPro.com
Although a little late to the party, the Nikkei 225 ($NIKK) is showing signs of life with an inverse head-and-shoulders pattern taking shape. Note that the S&P 500 formed an inverse head-and-shoulders from mid May to mid September and broke resistance in the second...
READ MORE
MEMBERS ONLY
Homebuilders SPDR breaks resistance
by Arthur Hill,
Chief Technical Strategist, TrendInvestorPro.com
The Homebuilders SPDR (XHB) finally broke above resistance with a surge the last few days. XHB was one of the laggards because it had yet to break its July high. This changed on Thursday as the ETF broke resistance with a gap and long white candlestick. Also notice that the...
READ MORE
MEMBERS ONLY
Market surge produces five indicator upgrades
by Arthur Hill,
Chief Technical Strategist, TrendInvestorPro.com
That certainly did not take long. Five indicators were downgraded from bullish to neutral last Friday. These indicators did not break down to warrant a bearish stance, but I downgraded them to neutral because they were not confirming the new highs seen in the major indices. That changed this week....
READ MORE
MEMBERS ONLY
SPY surges above upper trendline of rising channel
by Arthur Hill,
Chief Technical Strategist, TrendInvestorPro.com
Stocks started the week strong and surged on Thursday with big gains in all major indices. All sectors were up with materials, energy, and finance leading the charge. These three were up over 3%. It is positive to see relative strength coming from the finance sector. On the daily SPY...
READ MORE
MEMBERS ONLY
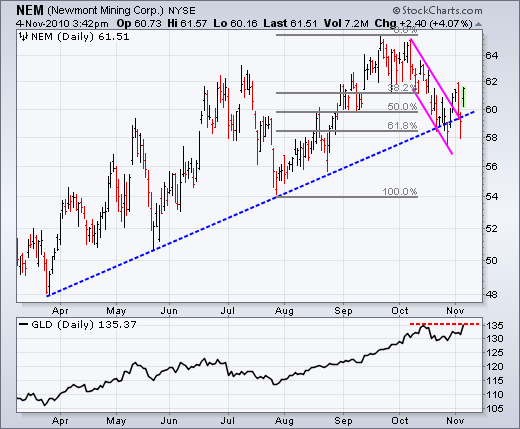
Newmont breaks flag resistance, but lags gold
by Arthur Hill,
Chief Technical Strategist, TrendInvestorPro.com
After retracing around 62% of the prior advance, Newmont Mining (NEM) broke above flag resistance with a surge over the last few days. The breakout was under threat with Wednesday's pullback, but Thursday's surge keeps the flag breakout in play. There is one concern. NEM remains...
READ MORE
MEMBERS ONLY
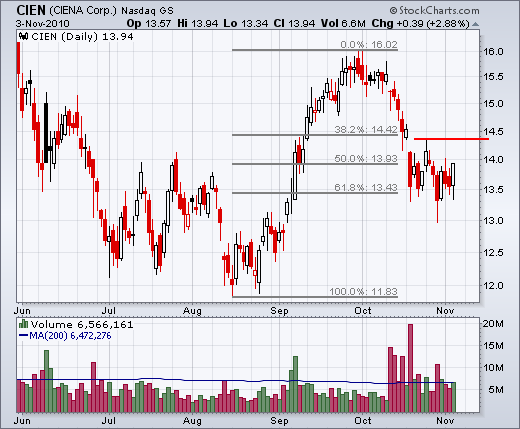
Charts: CIEN, CVS, FITB, GPS, HD, QLGC, WFC
by Arthur Hill,
Chief Technical Strategist, TrendInvestorPro.com
$CIEN firms at key retracement. $CVS forms bull flag. $FITB shows relative strength. $GPS, $HD, $QLGC and $WFC.
-----------------------------------------------------------------------------
This commentary and charts-of-interest are designed to stimulate thinking. This analysis is not a recommendation to buy, sell, hold or sell short any security (stock ETF or otherwise). We all...
READ MORE
MEMBERS ONLY
SPY closes at new high for the move
by Arthur Hill,
Chief Technical Strategist, TrendInvestorPro.com
Two down, one to go. The elections and the Fed have passed with little fanfare for stocks. Details of QE2 were released in the Fed policy statement. Bonds went one way and the Finance SPDR (XLF) went the other way. Funny how that worked. Bonds, which are direct beneficiaries of...
READ MORE
MEMBERS ONLY
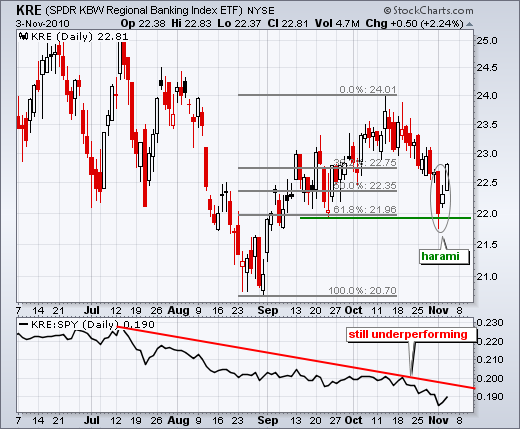
Regional Bank SPDR holds support with harami
by Arthur Hill,
Chief Technical Strategist, TrendInvestorPro.com
After plunging on Monday, the Regional Bank SPDR (KRE) firmed on Tuesday to form a harami. This is essentially an inside day. Also notice that the ETF managed to firm near the 62% retracement mark. Wednesday's surged above Monday's high confirms the harami.
Click this image...
READ MORE
MEMBERS ONLY
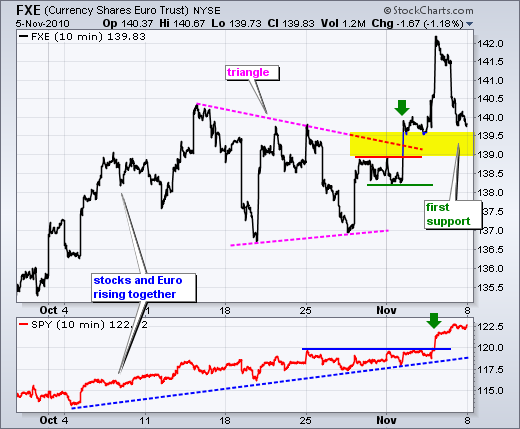
SPY challenges resistance as Euro breaks out
by Arthur Hill,
Chief Technical Strategist, TrendInvestorPro.com
The Euro broke resistance as long-term rates fell back to support. The first chart shows the Euro Currency Trust (FXE) breaking above range resistance and moving above the triangle trendline. This bullish development for the Euro is a positive for stocks. Range support around 138-138.2 is now...
READ MORE
MEMBERS ONLY
A weekly outside reversal for Natural Gas $NATGAS
by Arthur Hill,
Chief Technical Strategist, TrendInvestorPro.com
The Natural Gas Continuous-Futures ($NATGAS) formed a large weekly outside reversal pattern last week. Combined with a falling wedge and support in the 3.3-3.5 area, Natural Gas is threatening a bounce within its long downtrend. Watch the MACD-Histogram for a move into positive territory to...
READ MORE