MEMBERS ONLY
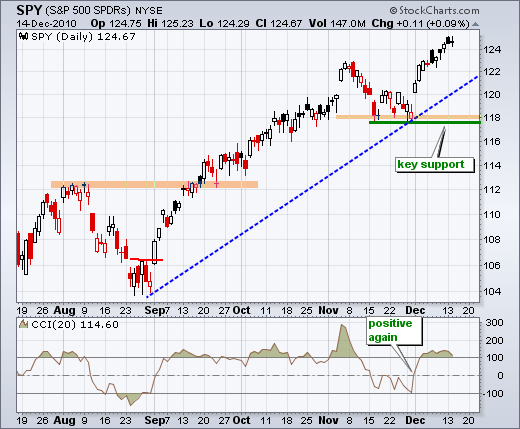
Stocks Remain Strong as Interest Rates Surge
by Arthur Hill,
Chief Technical Strategist, TrendInvestorPro.com
SPY remains overbought with a few sentiment indicators showing excessive bullishness, but there are simply no signs of signficant selling pressure. With yearend approaching and seasonal patterns largely bullish, stocks could simply remain overbought and hold their uptrends. I am concerned with the sharp rise in interest rates, but stocks...
READ MORE
MEMBERS ONLY
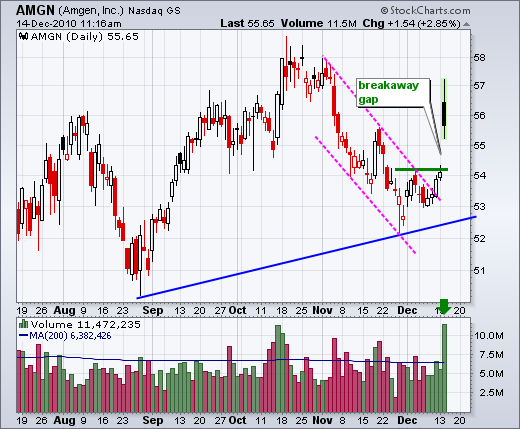
A High-Volume Break Away Gap for Amgen
by Arthur Hill,
Chief Technical Strategist, TrendInvestorPro.com
Amgen is off to the races today with a gap and breakout on big volume. This gap comes after the November decline and looks like a breakaway gap. High volume validates this move and the gap/breakout is bullish as long as it holds.
Click this image for a live...
READ MORE
MEMBERS ONLY
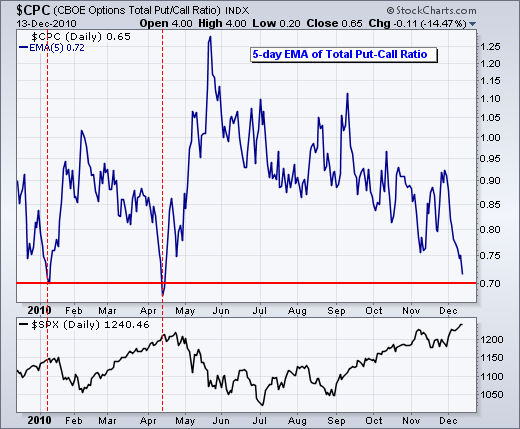
Put-Call Nears Extreme as SPY Continues Higher
by Arthur Hill,
Chief Technical Strategist, TrendInvestorPro.com
The CBOE Total Put/Call Ratio ($CPC) is nearing an extreme that coincided with the January and April peaks. Before looking at the details, keep in mind that market sentiment is hard to pin down. First, there are many ways to measure sentiment (VIX, Put-Call Ratio, Advisor Sentiment). Second,...
READ MORE
MEMBERS ONLY
Charts: AEO, CL, HPQ, LLL, QLGC, RTN, WFR
by Arthur Hill,
Chief Technical Strategist, TrendInvestorPro.com
AEO Forms Pennant at Key Support. HPQ Shows Relative Weakness. RTN Leads Weak Defense Group Lower. Plus CL, LLL, QLGC, WFR
-----------------------------------------------------------------------------
This commentary and charts-of-interest are designed to stimulate thinking. This analysis is not a recommendation to buy, sell, hold or sell short any security (stock ETF or...
READ MORE
MEMBERS ONLY
Currency CandleGlance Charts Show Euro Leading the Way
by Arthur Hill,
Chief Technical Strategist, TrendInvestorPro.com
The Dollar is getting hammered on Monday with most other currencies moving higher. CandleGlance charts provide an easy way to reveal the leaders. The image below shows four or the 10 Candleglance currency charts. The Euro Currency Trust (FXE) is the clear leader with a 1.86% gain. Click on...
READ MORE
MEMBERS ONLY
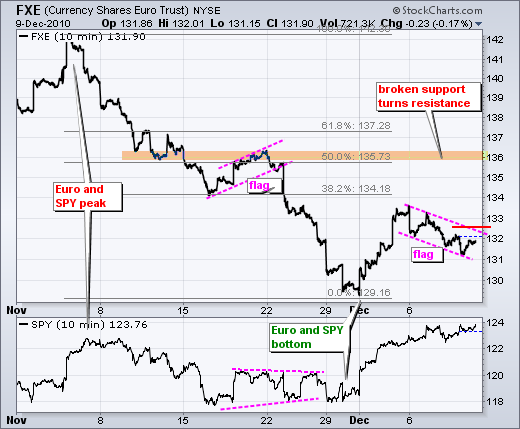
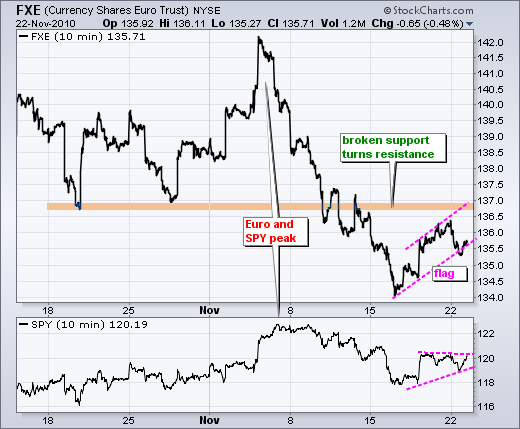
SPY Remains Overbought and Bullish as Euro Edges Lower
by Arthur Hill,
Chief Technical Strategist, TrendInvestorPro.com
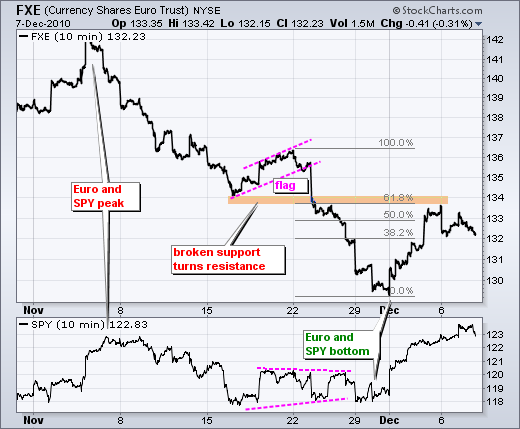
Even though the Euro declined last week, stocks remained strong and closed near their highs for the week. The first chart shows the Euro Currency Trust (FXE) peaking around 133.5 and falling below 132 last week. The decline is slow and the pattern looks like a falling flag. This...
READ MORE
MEMBERS ONLY
Lumber Moves Higher Along with Other Commodities
by Arthur Hill,
Chief Technical Strategist, TrendInvestorPro.com
The Homebuilders SPDR and the Home Construction iShares (ITB) both surged this week and we are also seeing strength in Lumber ($LUMBER). On one hand, this increases building costs. On the other hand, it shows an increase in demand and this could mean more construction. The late November low marks...
READ MORE
MEMBERS ONLY
Indicator Summary Remains Firmly Positive
by Arthur Hill,
Chief Technical Strategist, TrendInvestorPro.com
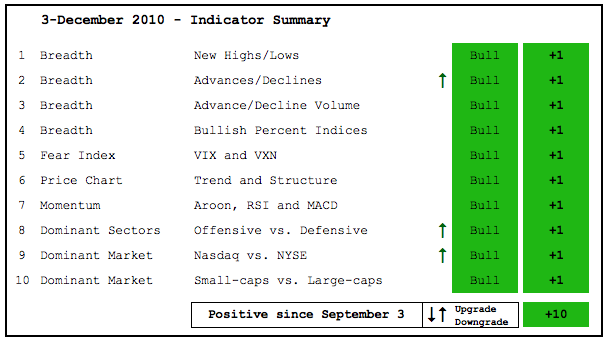
There is no change in the indicator summary. Stocks held their gains this week and there was not much movement. Led by strength in the finance sector, the NYSE AD Volume Line moved above its November high. The November lows mark key support for the AD Lines and AD Volume...
READ MORE
MEMBERS ONLY
Bigger Uptrend Continues to Trump Short-Term Negatives
by Arthur Hill,
Chief Technical Strategist, TrendInvestorPro.com
I am still watching the falling flag in the Euro. A falling Euro is potentially negative for stocks and the short-term trend is clearly down as long as the flag falls. On the Euro Currency Trust (FXE) chart, a move above 132.5 would break flag resistance and provide...
READ MORE
MEMBERS ONLY
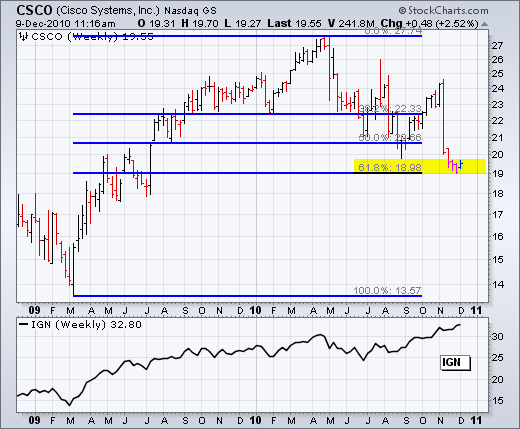
Cisco Hits Key Retracement on the Weekly Chart
by Arthur Hill,
Chief Technical Strategist, TrendInvestorPro.com
While the Networking iShares (IGN) trades near a 52-week high, Cisco (CSCO) flounders near a 52-week low. Who would have thunk it? Cisco is one of the top ten components in this ETF. This year's decline puts the stock at an interesting juncture: a key retracement...
READ MORE
MEMBERS ONLY
SPY Remains Near Resistance as Euro Forms Falling Flag
by Arthur Hill,
Chief Technical Strategist, TrendInvestorPro.com
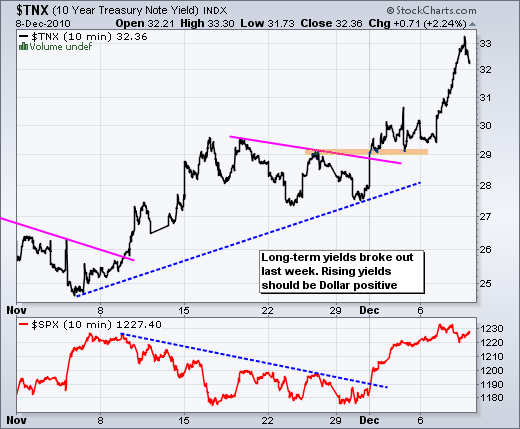
A surge in interest rates should be bullish for the Dollar, but the Dollar barely moved on Wednesday and Forex vigilantes could turn their sites on the Dollar. As noted in Wednesday's market message, bonds plunged because proposed legislation in DC would increase spending and decrease revenues. While...
READ MORE
MEMBERS ONLY
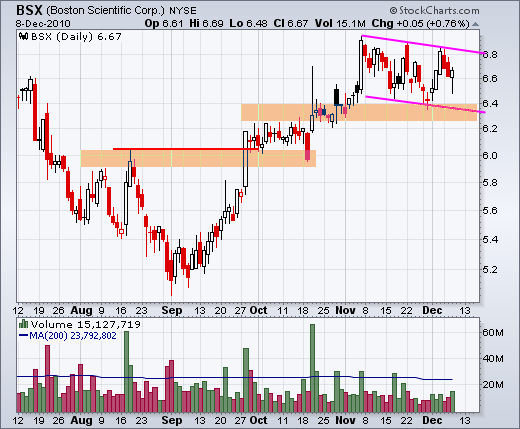
Charts: BSX, DELL, EK, GILD, KFT, MDT, MOT, PEP
by Arthur Hill,
Chief Technical Strategist, TrendInvestorPro.com
EK bounces on uptick in volume. GILD bounces off broken resistance. MOT breaks wedge resistance. Plus BSX, KFT, MOT, PEP. See the About Page for details on the commentaries in Art's Charts.
-----------------------------------------------------------------------------
This commentary and charts-of-interest are designed to stimulate thinking. This analysis is not a...
READ MORE
MEMBERS ONLY
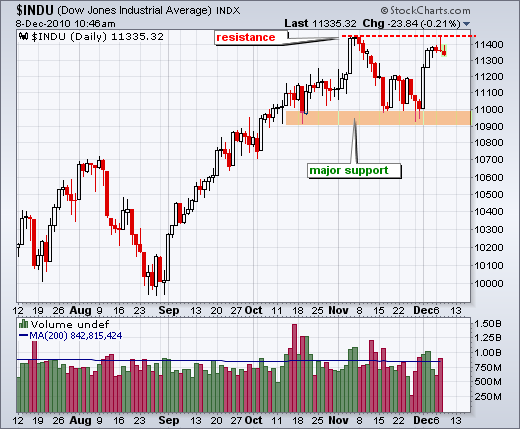
Dow Industrials Hits Resistance from November High $INDU
by Arthur Hill,
Chief Technical Strategist, TrendInvestorPro.com
The Dow Industrials remains in an uptrend overall, but the senior Average is hitting some resistance from the November highs just above 11400. It is possible that a trading range takes shape after the sharp advance from 10000 to 11400. Key support is based on the lows extending from mid...
READ MORE
MEMBERS ONLY
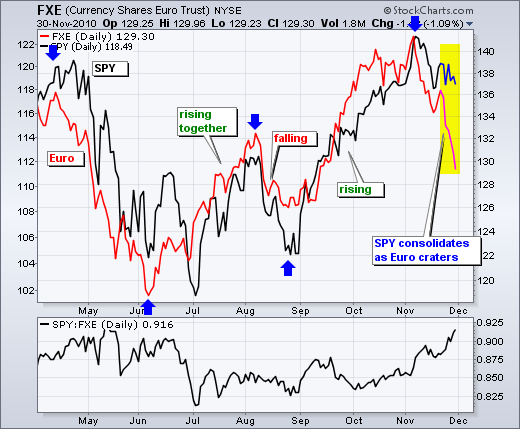
SPY Stalls as Interest Rates and the Dollar Move Higher
by Arthur Hill,
Chief Technical Strategist, TrendInvestorPro.com
While the relationship is not perfect, stocks and the Euro still have a pretty good positive correlation. This means both rise and fall together. The clear discrepancy is from 23-Nov to 30-Nov when the Euro fell sharply and SPY held support from its mid November lows. In a...
READ MORE
MEMBERS ONLY
$XLU Underperforms and Hits Resistance
by Arthur Hill,
Chief Technical Strategist, TrendInvestorPro.com
Despite a bounce the last five days, the Utilities SPDR (XLU) remains an underperformer since September. Notice how the price relative peaked and moved lower the last 3 months. On the price chart, the ETF is running into resistance from broken support around 31.30.
Click this image for a...
READ MORE
MEMBERS ONLY
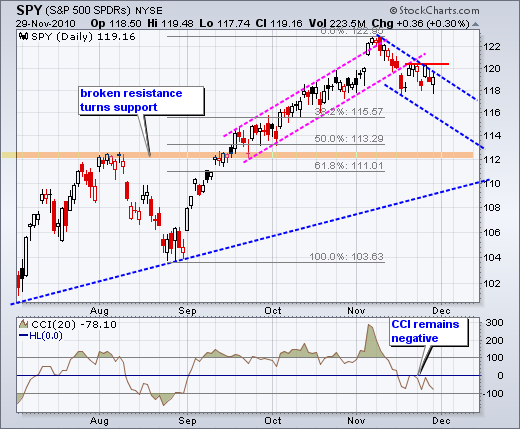
SPY Forges a Narrow Range Day at Resistance
by Arthur Hill,
Chief Technical Strategist, TrendInvestorPro.com
On the daily chart, SPY formed a very small candlestick with the narrowest range in over a week. The most popular narrow range indicators are NR-4 and NR-7, which refer to the narrowest high-low range in four or seven days. A narrow range shows indecision that can...
READ MORE
MEMBERS ONLY
Charts: $NATGAS, CHK, NXY, DLTR, EBAY, SUSS
by Arthur Hill,
Chief Technical Strategist, TrendInvestorPro.com
Natural Gas surges as cold hits $NATGAS. CHK bounces off support. NXY challenges resistance. Plus DLTR, EBAY, SUSS.
-----------------------------------------------------------------------------
This commentary and charts-of-interest are designed to stimulate thinking. This analysis is not a recommendation to buy, sell, hold or sell short any security (stock ETF or otherwise). We all...
READ MORE
MEMBERS ONLY
Tech Sector Lags Offensive Sectors
by Arthur Hill,
Chief Technical Strategist, TrendInvestorPro.com
Except for technology, the offensive sectors are leading the market over the last two weeks. Relative to the S&P 500, consumer discretionary, industrials and finance are all positive on this relative strength PerfChart. Utilities, consumer staples and healthcare, which make up the defensive sectors are lagging.
Click this...
READ MORE
MEMBERS ONLY
Euro Hits Resistance and SPY Becomes OverBOUGHT
by Arthur Hill,
Chief Technical Strategist, TrendInvestorPro.com
The positive correlation between stocks and the Euro remains in place. The Euro got an oversold bounce last week and this helped propel stocks higher. Strong economic numbers on Wednesday also helped the bullish cause. Even though the Euro is getting a bounce, rising interest rates in the US and...
READ MORE
MEMBERS ONLY
IDENTIFYING SPY SUPPORTS WITH INTRADAY P&F CHARTS
by Arthur Hill,
Chief Technical Strategist, TrendInvestorPro.com
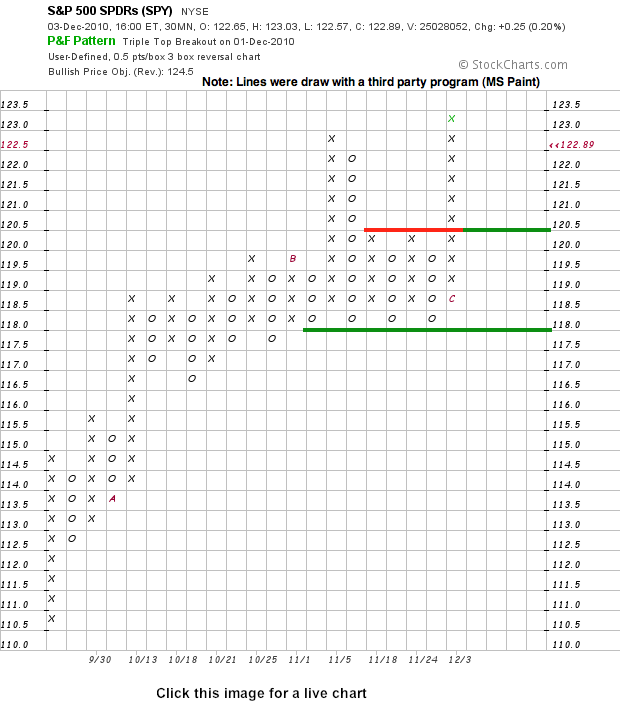
Point & Figure produce straight-forward charts that focus exclusively on price action. Columns of X's appear during an advance. Columns of O's appear during a decline. Nothing appears when prices are flat or move less than the box size or reversal amount. Point & Figure...
READ MORE
MEMBERS ONLY
Echostar Hits the P&F Triple Top Breakout Scan $SATS
by Arthur Hill,
Chief Technical Strategist, TrendInvestorPro.com
The Nasdaq Point & Figure Triple Top Breakout scan featured over 200 stocks on Friday morning. The chart below shows Echostar (SATS) breaking resistance marked by five columns of X's, which previous reversed at 22. This breakout is P&F bullish with a price objective (PO) of...
READ MORE
MEMBERS ONLY
Positive Indicator Summary Hits Three Month Mark
by Arthur Hill,
Chief Technical Strategist, TrendInvestorPro.com
Today marks three full months that the indicator summary has been positive. After some whipsaws in the summer, this table turned positive on September 3rd and remains positive. Some signs of weakness appeared in November, but these were erased with this week's surge and breakout. Small-caps and...
READ MORE
MEMBERS ONLY
SPY Extends on Breakout as Finance Leads the Market
by Arthur Hill,
Chief Technical Strategist, TrendInvestorPro.com
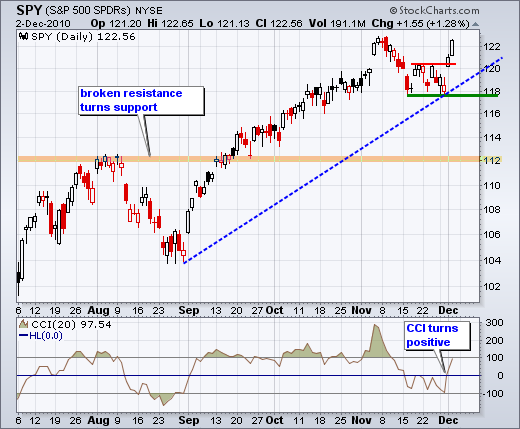
There is no change on the daily or 60-minute charts. SPY built on its breakout with a 1.28% gains. Perhaps more importantly, the finance sector led the way with a huge move. Megabanks, regional banks and brokers led the way. On the daily chart, SPY held support around...
READ MORE
MEMBERS ONLY
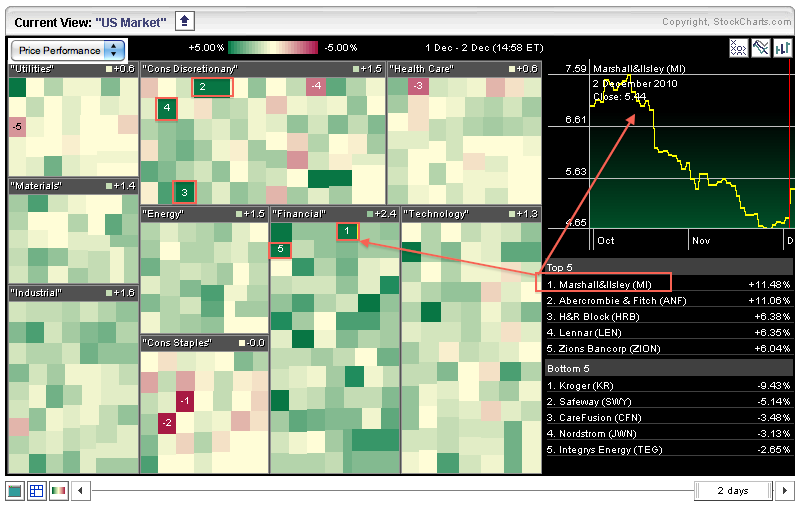
Finance Sees Green in Sector Carpet
by Arthur Hill,
Chief Technical Strategist, TrendInvestorPro.com
The finance sector sprang to life on Thursday with a sea of green squares filling its portion of the Sector Carpet. M&I Corp (MI) is the top performer with an 11+ percent gain. Click a square to see the corresponding chart in the upper right.
Click this image...
READ MORE
MEMBERS ONLY
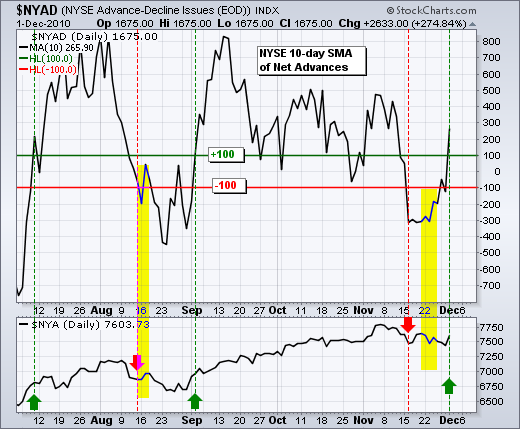
SPY Breaks Resistance as Breadth Turns Bullish
by Arthur Hill,
Chief Technical Strategist, TrendInvestorPro.com
A little bounce in the Euro, some positive economic news and bullish seasonal patterns pushed stocks sharply higher on Wednesday. Historically, December is the second strongest month of the year for stocks. This historic tendency got off to a good start with yesterday's big surge. This is interesting...
READ MORE
MEMBERS ONLY
Charts: ETFC, GE, MCK, PEP, PMCS, SYK, V, WY
by Arthur Hill,
Chief Technical Strategist, TrendInvestorPro.com
$EFTC forms cup-with-handle. $GE bounces of key retracement zone. $PMCS surges off support with good volume. Plus $MCK, $PEP, $SYK, $V, $WY.
-----------------------------------------------------------------------------
This commentary and charts-of-interest are designed to stimulate thinking. This analysis is not a recommendation to buy, sell, hold or sell short any security...
READ MORE
MEMBERS ONLY
Russell 2000 Challenges April High and Leads the Market
by Arthur Hill,
Chief Technical Strategist, TrendInvestorPro.com
The Russell 2000 ($RUT) and small-caps are leading the market higher. The index is the first of the major indices to break above its November high. With today's move above 740, the index is also challenging its April high. Notice that CCI turned positive with the 18-...
READ MORE
MEMBERS ONLY
Bulls Refuse to Buckle as SPY Holds Support
by Arthur Hill,
Chief Technical Strategist, TrendInvestorPro.com
It is as if the under-invested fund managers can smell the yearend. SPY gapped down and moved below 118 yet again on Tuesday, but the bulls pushed the ETF back above 119 in the afternoon. Even though SPY managed to fill the gap, it did not break above yesterday&...
READ MORE
MEMBERS ONLY
ATVI Forms Triangle Above Broken Resistance
by Arthur Hill,
Chief Technical Strategist, TrendInvestorPro.com
After a breakout in early November, Activision (ATVI) consolidated with a triangle over the last few weeks. The consolidation slowly narrowed with the stocks trading between 11.45 and 11.86 the last nine days. A break from this range will trigger the next signal.
Click this image for a...
READ MORE
MEMBERS ONLY
Lots of Gaps, but Little Progress for SPY
by Arthur Hill,
Chief Technical Strategist, TrendInvestorPro.com
On the daily chart, SPY broke channel support with a gap down in mid November and this break is holding. This short-term support break started a short-term downtrend that is considered a correction within the bigger uptrend. As far as downside targets, we can draw a falling price...
READ MORE
MEMBERS ONLY
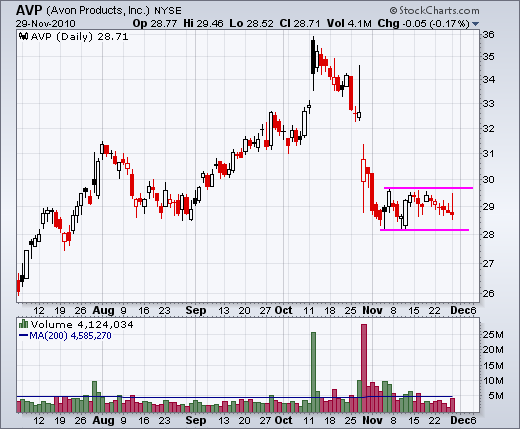
Charts: AVP, BBY, BXP, FAST, ITW, SPG, WM, X
by Arthur Hill,
Chief Technical Strategist, TrendInvestorPro.com
AVP consolidates after sharp decline. BBY gaps down. FAST breaks triangle resistance. Plus BXP, ITW, SPG, WM, X
-----------------------------------------------------------------------------
This commentary and charts-of-interest are designed to stimulate thinking. This analysis is not a recommendation to buy, sell, hold or sell short any security (stock ETF or otherwise). We all...
READ MORE
MEMBERS ONLY
Aroon Turns Negative as XLI Forms a Bear Flag
by Arthur Hill,
Chief Technical Strategist, TrendInvestorPro.com
The Industrials SPDR (XLI) bounced over the last two weeks, but the rise looks like a bearish flag. Also notice that the ETF formed a harami on Wednesday-Friday last week and the Aroon Oscillator turned negative for the first time since mid September. A break below 21 would signal...
READ MORE
MEMBERS ONLY
SPY Forms Triangle within Short-term Downtrend
by Arthur Hill,
Chief Technical Strategist, TrendInvestorPro.com
The S&P 500 ETF (SPY) remains in a short-term downtrend that is viewed as a correction within a bigger uptrend. Defining the length and the duration of this correction is an imprecise science. We can, however, set precise resistance levels to define the downtrend. This means the...
READ MORE
MEMBERS ONLY
Loonie Surges and Forges Higher Low
by Arthur Hill,
Chief Technical Strategist, TrendInvestorPro.com
The Canadian Dollar Index ($CDW) is showing strength with a higher low in November and big surge this week. Also called the "Loonie", the Canadian Dollar exceeded its summer highs in October and then consolidated several weeks. The overall trend here is up with the next resistance just...
READ MORE
MEMBERS ONLY
Stocks Bounce, but Euro Plunges and Yields Rise
by Arthur Hill,
Chief Technical Strategist, TrendInvestorPro.com
It is a strange situation. The anecdotal evidence favors the bears, but the stock market price action remains strong. The 10-year Treasury Yield ($TNX) surged back above 2.9% on Friday and the Euro/Dollar fell below 1.33. Rising yields and a weak Euro would normally be bearish...
READ MORE
MEMBERS ONLY
Green Squares in the Market Carpet
by Arthur Hill,
Chief Technical Strategist, TrendInvestorPro.com
The market carpet shows a sea of red over the last two days, but there are a few green squares to be found. There are six in the consumer discretionary sector and five in the technology sector. Big Lots (BIG) is up over 5% and New York Times (NTY) is...
READ MORE
MEMBERS ONLY
SPY Firms After One Hour Of Weakness
by Arthur Hill,
Chief Technical Strategist, TrendInvestorPro.com
The bulk of the short-term evidence is bearish, but the medium-term evidence remains bullish. This means short-term weakness is viewed as a correction within a bigger uptrend. Keep in mind that this bigger uptrend holds the trump cards and these can be played at any time. There...
READ MORE
MEMBERS ONLY
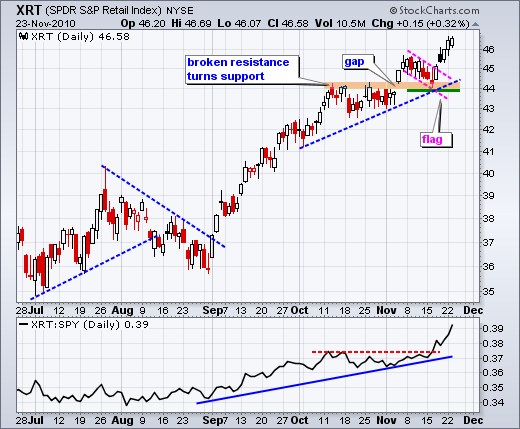
Retail SPDR Bucks the Decline
by Arthur Hill,
Chief Technical Strategist, TrendInvestorPro.com
Stocks moved sharply lower on Tuesday, but the Retail SPDR (XRT) bucked the trend and closed with small gain. The chart below shows XRT breaking flag resistance with a gap up four day ago and closing higher the last five days. ALso notice that the price relative recorded a 52-...
READ MORE
MEMBERS ONLY
SPY Stalls As Euro Edges Lower
by Arthur Hill,
Chief Technical Strategist, TrendInvestorPro.com
Despite the Irish bank bailout, the Euro declined on Monday and was down in overnight trading on Tuesday. Stocks and the Euro have been positively correlated since April as the Euro pretty much defines the risk on-off trade. Strength in the Euro favors the risk-on trade and stocks....
READ MORE
MEMBERS ONLY
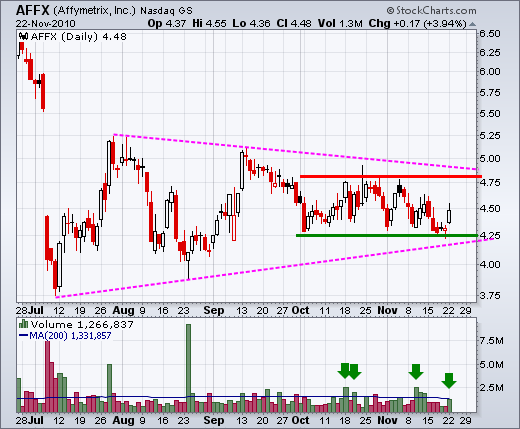
Charts: AFFX, AMAT, CL, MDT, MMM, MSFT, PPDI
by Arthur Hill,
Chief Technical Strategist, TrendInvestorPro.com
AMAT forms falling flag. MDT firms at key retracement. MSFT finds support near broken resistance. Plus AFFX, CL, MMM, PPDI.
-----------------------------------------------------------------------------
This commentary and charts-of-interest are designed to stimulate thinking. This analysis is not a recommendation to buy, sell, hold or sell short any security (stock ETF or otherwise)...
READ MORE