MEMBERS ONLY
Strong Yen weighs on Nikkei
by Arthur Hill,
Chief Technical Strategist, TrendInvestorPro.com
The Nikkei 225 ($NIKK) failed at resistance as the Yen surged to new highs. The Nikkei 225 surged in September, but never broke resistance as a weak Dollar drove the Yen higher. It is possible that an inverse head-and-shoulders pattern is forming, but there are no signs of...
READ MORE
MEMBERS ONLY
SPY maintains uptrend ahead of elections and the Fed
by Arthur Hill,
Chief Technical Strategist, TrendInvestorPro.com
First note that I will be travelling on Tuesday and will not be able to write a commentary that day. The next commentary will be Wednesday morning. It is just as well because the markets will digest the week's first big event on Wednesday morning. The elections are...
READ MORE
MEMBERS ONLY
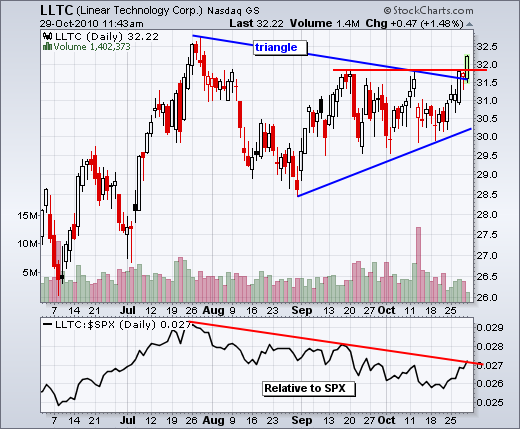
Linear Tech Leads Semis with Triangle Breakout
by Arthur Hill,
Chief Technical Strategist, TrendInvestorPro.com
Linear Tech (LLTC) formed a large triangle over the last three months and broke resistance with a surge this week. Also notice that the stock broke above its September highs. Semis are showing upside leadership and this is positive for the tech sector.
Click this image for a live chart...
READ MORE
MEMBERS ONLY
Five market indicators get downgrades
by Arthur Hill,
Chief Technical Strategist, TrendInvestorPro.com
The indicator summary remains bullish overall, but five indicators were downgraded from bullish to neutral. First, the NYSE AD Volume Line peaked in mid October and is starting to lag. Second, the Nasdaq AD Line flattened as the Nasdaq continued higher. Third, the S&P 500, Nasdaq 100, VIX...
READ MORE
MEMBERS ONLY
SPY holds uptrend as big news week looms
by Arthur Hill,
Chief Technical Strategist, TrendInvestorPro.com
There are likely to be some serious fireworks next week. This is one of the biggest news weeks that I can remember. First, we have election results on Tuesday. Second, the Fed meets on Wednesday. Third, there is the employment report on Friday. We can also throw in the ISM...
READ MORE
MEMBERS ONLY
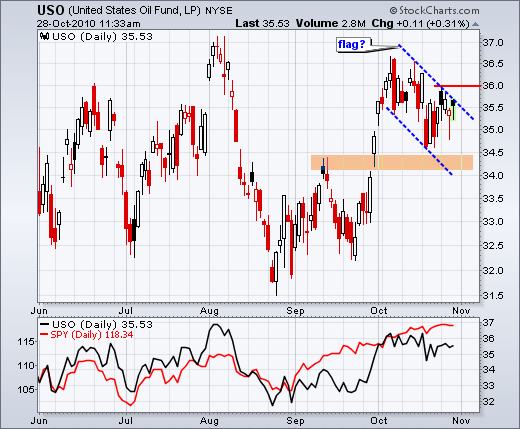
A bull flag takes shape in the USO Oil Fund
by Arthur Hill,
Chief Technical Strategist, TrendInvestorPro.com
After a breakout and big surge towards the August highs, the USO Oil Fund (USO) took a breather with a pullback over the last few weeks. The falling zigzag in October looks like a falling flag, which is a bullish continuation pattern. The surge from 32.5 to 36.5...
READ MORE
MEMBERS ONLY
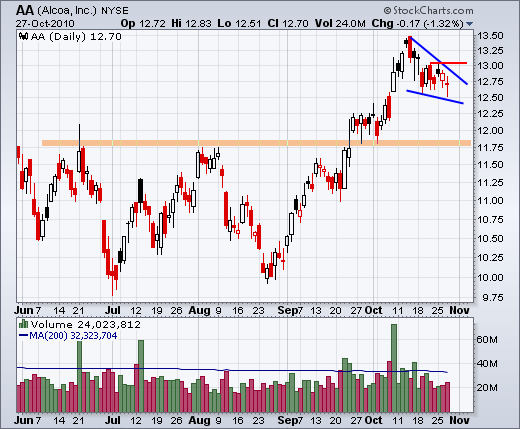
Charts: AA, CDE, CVS, JPM, LUB, MOT, SFD, UNM
by Arthur Hill,
Chief Technical Strategist, TrendInvestorPro.com
This commentary and charts-of-interest are designed to stimulate thinking. This analysis is not a recommendation to buy, sell, hold or sell short any security (stock ETF or otherwise). We all need to think for ourselves when it comes to trading our own accounts. First, it is the only...
READ MORE
MEMBERS ONLY
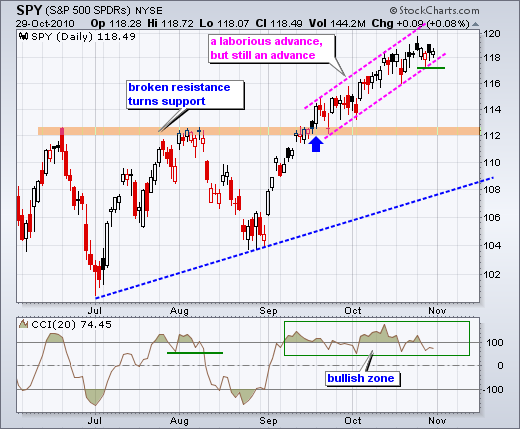
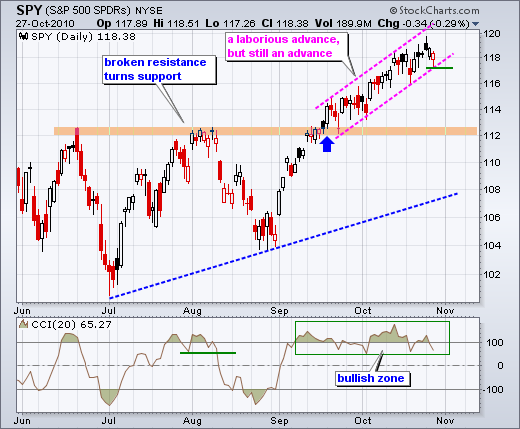
SPY bounces off channel support
by Arthur Hill,
Chief Technical Strategist, TrendInvestorPro.com
There is no change on the daily chart. Even though the advance has grown laborious, SPY remains in an uptrend. The surge above 114 on September 20th marked the easy part of the advance. Since this surge, SPY has worked its way higher within a rising price channel. All kinds...
READ MORE
MEMBERS ONLY
A head-and-shoulders pattern for Greek equities
by Arthur Hill,
Chief Technical Strategist, TrendInvestorPro.com
The DJ Greece Index ($GRDOW) shows a potential head-and-shoulders pattern evolving over the last five months. This version is a continuation pattern. A move below the October low would confirm the pattern and target lower prices.
Click this image for a live chart...
READ MORE
MEMBERS ONLY
SPY Channels Higher as Euro Weakens
by Arthur Hill,
Chief Technical Strategist, TrendInvestorPro.com
There were some serious rumblings in the intermarket arena on Tuesday. Bonds plunged, long-term rates surged, the Euro declined sharply and the Dollar bounced. Forget about the Fed and QE2. These are already priced into the market. Bonds and the Dollar are looking ahead of QE2. Long-term rates...
READ MORE
MEMBERS ONLY
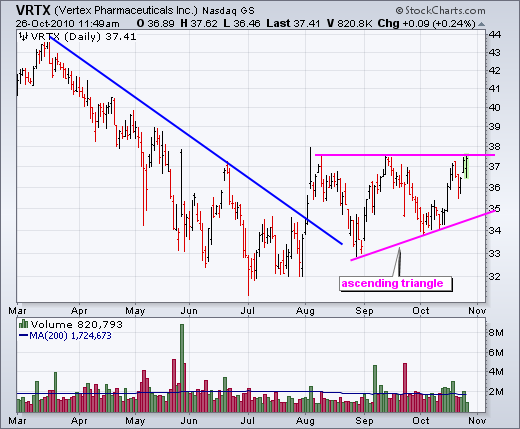
An ascending triangle for Vertex
by Arthur Hill,
Chief Technical Strategist, TrendInvestorPro.com
After a trendline breakout in August, Vertex Pharma (VRTX) traced out a potentially bullish ascending triangle. Notice the higher low in early October and the equal highs in August and September. A break above the September high on good volume would confirm this bullish pattern.
Click this image for a...
READ MORE
MEMBERS ONLY
Charts: AKS, ALTR, AMKR, HOLX, HRS, MAS, POOL, WHR
by Arthur Hill,
Chief Technical Strategist, TrendInvestorPro.com
Charts: AKS, ALTR, AMKR, HOLX, HRS, IDCC, MAS, POOL, WHR
-----------------------------------------------------------------------------
This commentary and charts-of-interest are designed to stimulate thinking. This analysis is not a recommendation to buy, sell, hold or sell short any security (stock ETF or otherwise). We all need to think for ourselves when it comes...
READ MORE
MEMBERS ONLY
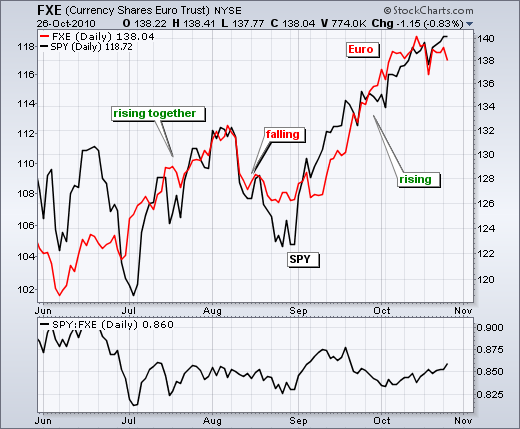
Yields tick higher as SPY and Euro stall
by Arthur Hill,
Chief Technical Strategist, TrendInvestorPro.com
I continue to watch bonds and the Euro for clues on equities. The first chart shows the Euro Currency Trust (FXE) surging on the open, but failing to break last week's high and falling back. It is possible that we have a lower high taking shape after last...
READ MORE
MEMBERS ONLY
Oil Services and Internet Lead the Market
by Arthur Hill,
Chief Technical Strategist, TrendInvestorPro.com
John Murphy's industry group perfchart shows oil services and internet stocks leading the market since August 27th. It's a rather motly pair. Banks are the biggest laggards. In a bit of a surprise, gold and silver stocks ($XAU) are also lagging the broader market.
Click this...
READ MORE
MEMBERS ONLY
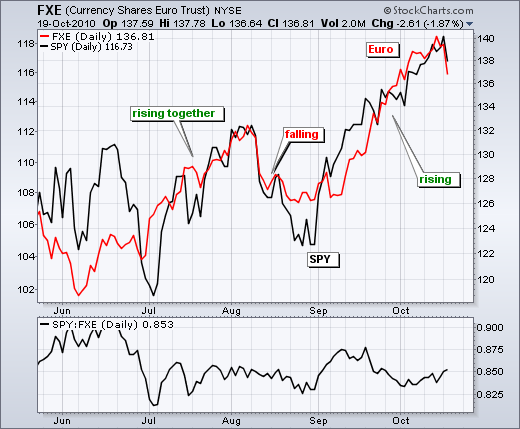
Euro breakout would be bullish for SPY
by Arthur Hill,
Chief Technical Strategist, TrendInvestorPro.com
The Euro Currency Trust (FXE) and the S&P 500 ETF (SPY) have been positively correlated throughout 2010. This positive correlation is especially strong since late August. Both are up over 10% since late August. Why the positive correlation? First, a weak Dollar is beneficial to US exports because...
READ MORE
MEMBERS ONLY
Energy Fund ETF backs off range resistance
by Arthur Hill,
Chief Technical Strategist, TrendInvestorPro.com
The Multisector Energy Fund (DBE) has been stuck in a trading range since late May. Range support is set near 25 and range resistance near 22. With the October pullback, the ETF has failed at resistance and showed weakness. Look for a break above this week's high to...
READ MORE
MEMBERS ONLY
Indicator Summary remains firmly bullish
by Arthur Hill,
Chief Technical Strategist, TrendInvestorPro.com
There is no change in the indicator summary, which remains firmly bullish. With all ten indicators in bull mode, it would take a few weeks to turn the tide bearish. I am not predicting this. I am merely reinforcing the lagging nature of this indicator summary. It is not designed...
READ MORE
MEMBERS ONLY
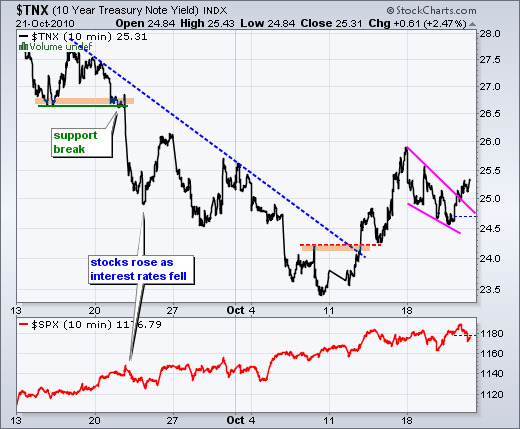
Intermarket picture heats up as yields move higher and Euro stalls
by Arthur Hill,
Chief Technical Strategist, TrendInvestorPro.com
The intermarket picture is getting quite interesting. First, the 10-year Treasury Yield ($TNX) broke wedge resistance to signal a continuation of last week's breakout. A bullish breakout in yields means a bearish breakdown in bonds. Frankly, I am not sure how or if this will affect stocks....
READ MORE
MEMBERS ONLY
Russell 2000 ETF forms bearish engulfing as MACD turns down
by Arthur Hill,
Chief Technical Strategist, TrendInvestorPro.com
With a strong open Thursday morning and a sharp move lower in the afternoon, the Russell 2000 ETF has a bearish engulfing pattern working on the day. The bulls started in control, but the bears clearly took control in the afternoon. Also notice that the MACD-Histogram turned negative three...
READ MORE
MEMBERS ONLY
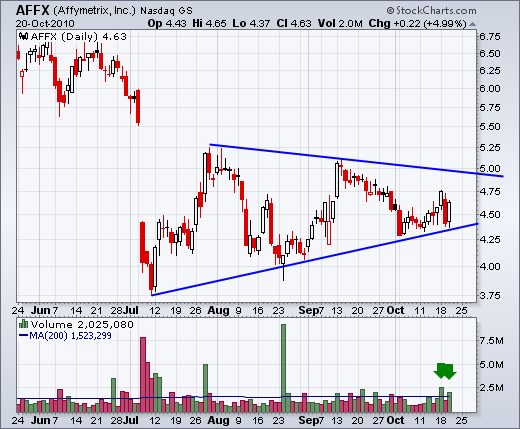
Charts: AFFX, ESRX, EXP, INTC, PAYX
by Arthur Hill,
Chief Technical Strategist, TrendInvestorPro.com
AFFX bounces off support with good volume. ESRX breaks flag resistance. EXP forms long triangle. INTC bounces off support with good volume. PAYX forms bullish consolidation.
-----------------------------------------------------------------------------
This commentary and charts-of-interest are designed to stimulate thinking. This analysis is not a recommendation to buy, sell, hold or sell short...
READ MORE
MEMBERS ONLY
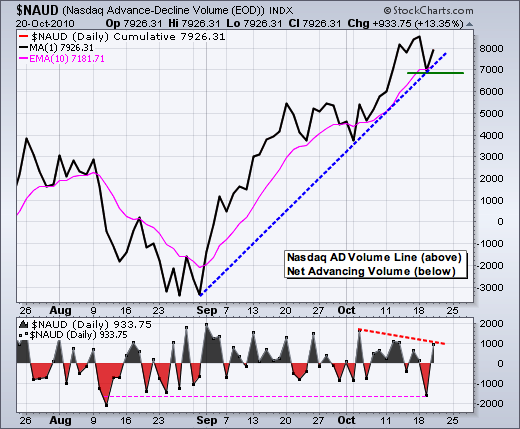
SPY rebounds on weaker breadth
by Arthur Hill,
Chief Technical Strategist, TrendInvestorPro.com
The bulls are clearly not going down without a fight. While yesterday's rebound looked impressive, breadth fell short of the prior highs and the bulls appear to be loosing steam. The first chart shows the Nasdaq AD Volume Line and Net Advancing Volume. The AD Volume Line remains...
READ MORE
MEMBERS ONLY
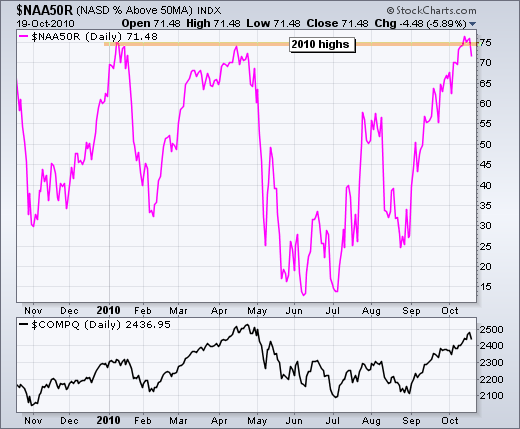
Nasdaq %Above 50-day SMA reaches overbought levels $NAA50R
by Arthur Hill,
Chief Technical Strategist, TrendInvestorPro.com
The Nasdaq %Above 50-day SMA ($NAA50R) is trading near the prior 2010 highs. This indicator surged to the mid 70s in January and again in April. Prior moves to this area signaled overbought conditions that led to a pullback.
Click this image for a live chart...
READ MORE
MEMBERS ONLY
SPY gaps down to test short-term support
by Arthur Hill,
Chief Technical Strategist, TrendInvestorPro.com
Big moves in the Euro and Apple weighed on stocks Tuesday. Apple declined after its earnings announcement, which was surely a buy-the-rumor sell-the-news event. The Euro Currency Trust (FXE) declined almost 2% after hitting a key retracement level last week. This was covered in Friday'...
READ MORE
MEMBERS ONLY
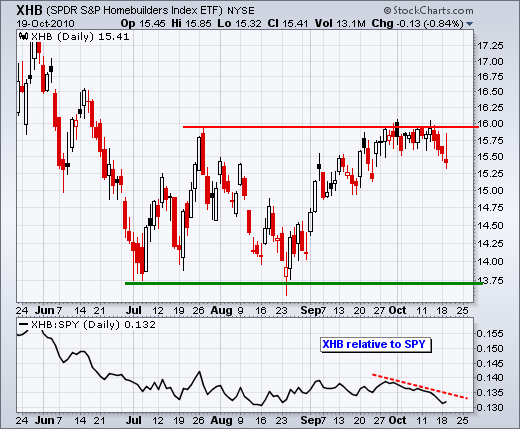
Homebuilder ETF fails at resistance $XHB
by Arthur Hill,
Chief Technical Strategist, TrendInvestorPro.com
The Homebuilders SPDR (XHB) surged to resistance at the end of Septmeber, but failed to follow through with a breakout in October. After trading flat for two weeks, the ETF is starting to move lower and showing relative weakness. Again.
Click this image for a live chart....
READ MORE
MEMBERS ONLY
Charts: AKS, BSX, MDT, MSFT, SNDK, WY
by Arthur Hill,
Chief Technical Strategist, TrendInvestorPro.com
BSX forms tight ascending triangle, MSFT breaks triangle resistance, MDT edges above consolidation resistance, SNDK forms bearish wedge. WY breaks triangle support.
-----------------------------------------------------------------------------
This commentary and charts-of-interest are designed to stimulate thinking. This analysis is not a recommendation to buy, sell, hold or sell short any security (stock ETF...
READ MORE
MEMBERS ONLY
SPY holds flag breakout to affirm support
by Arthur Hill,
Chief Technical Strategist, TrendInvestorPro.com
Stalling is not the same as weakness. I noted yesterday that SPY gapped up on Wednesday and stalled. Hanging man candlesticks followed on Thursday and Friday as the stall extended. Such indecision can sometimes result in a short-term reversal, but some sort of downside break or catalyst is needed...
READ MORE
MEMBERS ONLY
German DAX breaks ascending triangle resistance
by Arthur Hill,
Chief Technical Strategist, TrendInvestorPro.com
The German DAX Index ($DAX) continues to lead the world with an ascending triangle breakout. These are bullish continuation patterns. The height of the pattern (±700) is added to the resistance breakout for an upside target. With resistance at 6350, this targets a move to around 7000.
Click this image...
READ MORE
MEMBERS ONLY
Nasdaq surges on negative breadth
by Arthur Hill,
Chief Technical Strategist, TrendInvestorPro.com
Here's one for the record books. The Nasdaq was up 1.37% and the Nasdaq 100 was up 2.10% on Friday, but Net Advances were a negative 97. Despite big advances, there were more declining stocks on the Nasdaq than advancing stocks. Net Advancing Volume was positive...
READ MORE
MEMBERS ONLY
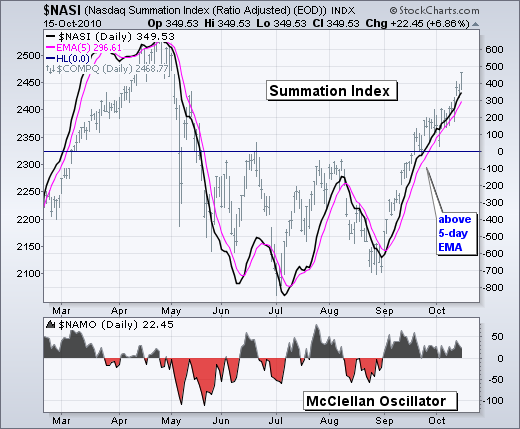
THE SMOOTHER COUSINS OF THE MCCLELLAN OSCILLATOR REMAIN BULLISH
by Arthur Hill,
Chief Technical Strategist, TrendInvestorPro.com
Even though stocks are overextended after a massive seven week run, we have yet to seen any evidence of weakness that would signal the start of a correction or pullback. Many momentum oscillators are also at or near overbought levels, but cumulative indicators, such as the McClellan Summation Index, continue...
READ MORE
MEMBERS ONLY
Google powers Nasdaq 100 above April high
by Arthur Hill,
Chief Technical Strategist, TrendInvestorPro.com
With a little help from Google (and Apple), the Nasdaq 100 surged above the April high this week to record a new 52-week high. Large techs are showing relative strength as one of the first groups to break this high. Google broke out of a long channel in mid...
READ MORE
MEMBERS ONLY
Indicator Summary remains positive for sixth week
by Arthur Hill,
Chief Technical Strategist, TrendInvestorPro.com
With a breakout in the Nasdaq AD Line, all ten indicators are now in bull mode. This indicator summary has been positive since September 3rd, going on six weeks now. DIA and QQQQ are challenging their April highs, but the Finance SPDR (XLF) remains below its summer highs. Once again,...
READ MORE
MEMBERS ONLY
SPY tests gap as finance leads lower
by Arthur Hill,
Chief Technical Strategist, TrendInvestorPro.com
The finance sector remains a thorn in the bull's hoof. Even though majority of the market is in bull mode, the Finance SPDR (XLF) remains a serious laggard. As noted in Wednesday's Market Message, XLF is the only one of the nine sector SPDRs that has...
READ MORE
MEMBERS ONLY
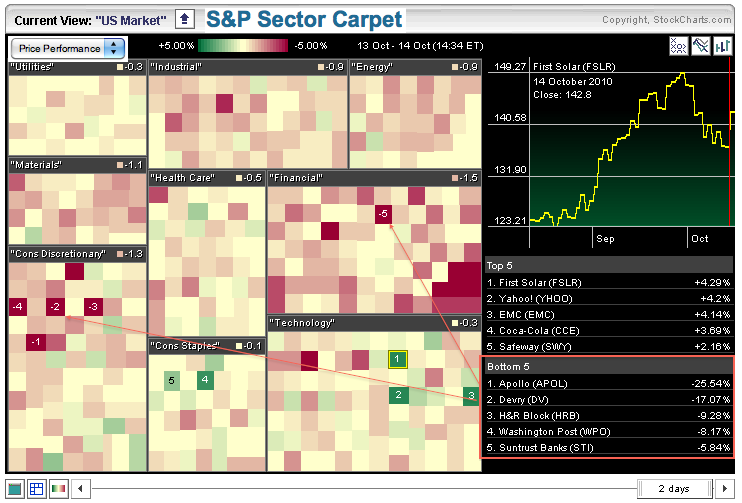
Finance and consumer discretionary sectors bloody the market carpet $XLK $XLY
by Arthur Hill,
Chief Technical Strategist, TrendInvestorPro.com
The sector market carpet shows lots of red in the consumer discretionary and finance sectors. Four of the five biggest losers come from the consumer discretionary sector. The finance sector also has quite a few dark red squares, indicating stocks with relative weakness. Technology remains a bright spot with three...
READ MORE
MEMBERS ONLY
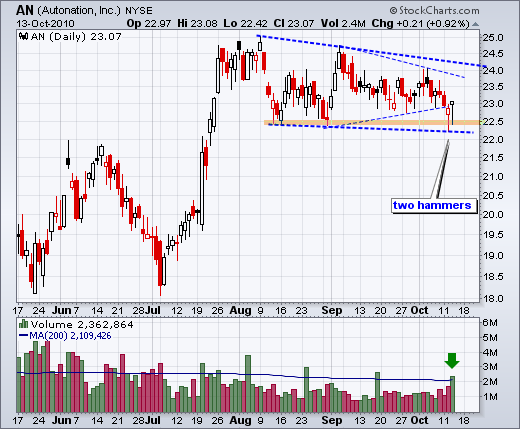
Charts: AN, BSX, CAG, GILD, LEAP, TIN, TLAB
by Arthur Hill,
Chief Technical Strategist, TrendInvestorPro.com
AN forms a high volume hammer. BSX forms small ascending triangle. CAG breaks resistance on good volume. GILD breaks flag resistance. LEAP consolidates after breakout. TIN breaks triangle resistance on big volume. TLAB gaps to triangle resistance.
-----------------------------------------------------------------------------
This commentary and charts-of-interest are designed to stimulate thinking. This analysis...
READ MORE
MEMBERS ONLY
SPY is bverbought and built to stay that way
by Arthur Hill,
Chief Technical Strategist, TrendInvestorPro.com
With another surge higher the last four days, the major index ETFs are overbought by most measures. SPY is up over 13% in seven weeks, 14-day RSI moved above 70 and CCI is near 180. RSI was last above 70 in mid April. At the time, the indicator oscillated...
READ MORE
MEMBERS ONLY
Noble Drilling appears in bullish engulfing scan $NE
by Arthur Hill,
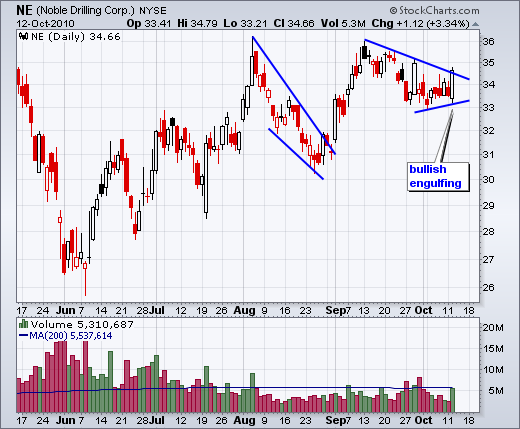
Chief Technical Strategist, TrendInvestorPro.com
With a weak open and strong close in stock market, 70 securities appears on the bullish engulfing scan for the Nasdaq and NYSE. The chart below shows Noble Drilling (NE) surging in early September, correcting into early October and then forming a bullish engulfing on Tuesday.
Click this image for...
READ MORE
MEMBERS ONLY
Stocks just love a weak Dollar
by Arthur Hill,
Chief Technical Strategist, TrendInvestorPro.com
Maybe it is just coincidence, but there sure is a strong negative correlation between the Dollar and stocks. Stocks started weak as the Dollar surged in early trading. The FOMC minutes hit the market in the afternoon and the Dollar swooned as QE2 became more of a reality. QE2 and...
READ MORE
MEMBERS ONLY
SMH challenges summer highs
by Arthur Hill,
Chief Technical Strategist, TrendInvestorPro.com
The Semiconductor HOLDRS (SMH) continues to show relative strength as it surges to its summer highs. Reaction highs in June-July mark a resistance zone around 28.7. The indicator window shows the price relative (SMH:SPY ratio) bottoming in early September and moving higher the last 4-5 weeks....
READ MORE
MEMBERS ONLY
SBUX surges through pennant resistance
by Arthur Hill,
Chief Technical Strategist, TrendInvestorPro.com
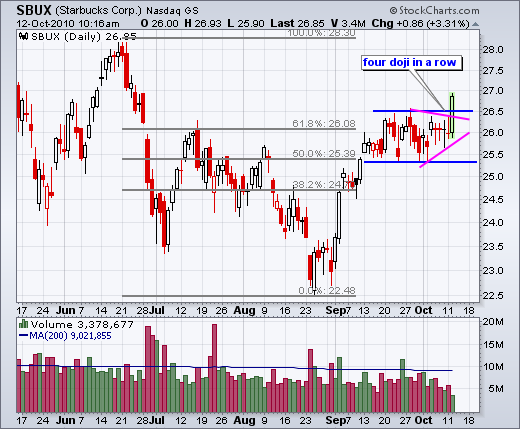
After consolidating near a key retracement and forming four doji, Starbucks (SBUX) broke through pennant resistance with a surge early Tuesday. The June highs mark the next resistance level. A move below Tuesday's low would signal a breakout failure.
Click this image for a live chart....
READ MORE
MEMBERS ONLY
Charts of Interest: CTAS, EBAY, EXPD, PFCB, RIMM, SBUX
by Arthur Hill,
Chief Technical Strategist, TrendInvestorPro.com
CTAS shows 3 weeks of relative weakness. EBAY breaks flag support. EXPD forms rising flag on lower volume. PFCB consolidates after long red candlestick. RIMM retraces 50% rising wedge. SBUX stalls at key retracement with four doji.
-----------------------------------------------------------------------------
This commentary and charts-of-interest are designed to stimulate thinking. This analysis...
READ MORE